

Abstract
Purpose:
Degradation of image quality caused by cardiac and respiratory motions hampers the diagnostic quality of cardiac PET. It has been shown that improved diagnostic accuracy of myocardial defect can be achieved by tagged MR (tMR) based PET motion correction using simultaneous PET-MR. However, one major hurdle for the adoption of tMR-based PET motion correction in the PET-MR routine is the long acquisition time needed for the collection of fully sampled tMR data. In this work, the authors propose an accelerated tMR acquisition strategy using parallel imaging and/or compressed sensing and assess the impact on the tMR-based motion corrected PET using phantom and patient data.
Methods:
Fully sampled tMR data were acquired simultaneously with PET list-mode data on two simultaneous PET-MR scanners for a cardiac phantom and a patient. Parallel imaging and compressed sensing were retrospectively performed by GRAPPA and kt-FOCUSS algorithms with various acceleration factors. Motion fields were estimated using nonrigid B-spline image registration from both the accelerated and fully sampled tMR images. The motion fields were incorporated into a motion corrected ordered subset expectation maximization reconstruction algorithm with motion-dependent attenuation correction.
Results:
Although tMR acceleration introduced image artifacts into the tMR images for both phantom and patient data, motion corrected PET images yielded similar image quality as those obtained using the fully sampled tMR images for low to moderate acceleration factors (<4). Quantitative analysis of myocardial defect contrast over ten independent noise realizations showed similar results. It was further observed that although the image quality of the motion corrected PET images deteriorates for high acceleration factors, the images were still superior to the images reconstructed without motion correction.
Conclusions:
Accelerated tMR images obtained with more than 4 times acceleration can still provide relatively accurate motion fields and yield tMR-based motion corrected PET images with similar image quality as those reconstructed using fully sampled tMR data. The reduction of tMR acquisition time makes it more compatible with routine clinical cardiac PET-MR studies.
Keywords: simultaneous PET-MR, motion correction, cardiac PET, cardiac motion, tagged MR
1. INTRODUCTION
Cardiac PET plays an important role in the detection and monitoring of heart diseases. However, the degradation of image quality caused by cardiac and respiratory motions hampers the diagnostic quality of cardiac PET.1–4
Although cardiac and/or respiratory gating5–8 can alleviate image artifacts caused by motion, gated images suffer from signal to noise ratio (SNR) deterioration since the images are reconstructed using only a small portion of the detected PET events. To address the SNR limitations of gating while removing motion blurring, motion correction techniques have been developed and evaluated in both oncologic and cardiac PET.9–11 Organ motion can be estimated using gated PET images12–15 or separately acquired 4D CT images.16,17 Motion correction can be performed postreconstruction12,15 by combining the deformed gated images or, more accurately, in the iterative reconstruction which preserves the Poisson statistics.16–19 However, accurate motion estimation of the myocardium is challenging due to its uniform appearance in PET and CT. Moreover, the accuracy of motion estimated from PET images is limited by its relatively low intrinsic resolution and high noise, whereas motion estimated from 4D CT may not be accurate because PET and CT data are not acquired simultaneously. Moreover, due to the fact that myocardium and the blood pool have similar Hounsfield units, estimating cardiac motion from CT may require the use of CT contrast agent,20 which is not part of routine cardiac PET/CT practice, and lead to added renal toxicity.
Simultaneous PET-MR, an emerging hybrid modality generating substantial interest recently, allows simultaneous acquisition of PET and MR data. Researchers have demonstrated the benefits of performing MR-assisted PET motion correction using a simultaneous PET-MR scanner.11,21–30 Advantages of MR-assisted PET motion correction as compared to CT-based motion correction in PET-CT are that the MR images are acquired simultaneously with PET and MRI provides superior soft-tissue contrast. However, myocardial tissue still has uniform appearance in conventional MR images, similar to CT, making it challenging to accurately measure the complex cardiac motion.
To address these challenges, tagged MR (tMR)4 based motion measurement was proposed for motion correction in motion corrected PET.2,31 In a tMR-based motion measurement, a special combination of radiofrequency (RF) pulses and gradients is used to introduce a periodic tagging pattern onto the object. The tags in the magnetization of the object move with the underlying object, allows obtaining accurate motion even within uniform objects. It has been shown that improved diagnostic accuracy of transmural and nontransmural myocardial defects can be achieved using tMR-based motion correction in cardiac PET-MR.2
Nonetheless, one major hurdle for the adoption of tMR-based PET motion correction in the PET-MR routine is the long acquisition time needed to collect fully sampled (FS) tMR data. Even with optimized acquisition protocols such as the one used in this work, in vivo tMR data collection still requires more than 8 min, which makes its adoption in clinical imaging challenging. Although cardiac PET acquisitions are much longer (15–30 min, typically) than the 8 min required for the acquisition of fully sampled tMR, it is neither practical nor realistic and unnecessary to use MRI solely for measuring the cardiac motion for PET motion correction during the entire cardiac PET acquisition. Indeed, in order to truly benefit from the synergy of the two modalities, clinical cardiac MR (CMR) sequences such as late gadolinium enhancement (LGE), dynamic contrast enhancement (DCE), T1/T2 mapping,32 TrueFISP, or even cardiac diffusion MR tractography33 should also be performed during PET acquisition. These CMR acquisitions each requires several minutes. Consequently, an “ideal” tMR-based cardiac motion measurement acquisition should save as much time as possible for other clinically relevant CMR sequences while also improving patient comfort by reducing the time in the scanner. On the other hand, a long tMR acquisition is more prone to patient motion, respiratory pattern drifting, and heart rate changes, which could lead to artifacts in tMR images and lead to consequent erroneous estimated motion.
In this work, we propose an accelerated tMR acquisition using parallel imaging34,35 (PI) and/or compressed sensing36–38 (CS) and assess the impact on the tMR-based motion corrected PET using phantom and patient data.
2. MATERIALS AND METHODS
2.A. Cardiac phantom
As shown in Fig. 1(a), the beating cardiac phantom consisted of two inflatable balloons, whose interspace (approximately 1 cm thick) was filled with 18F radioactive gel to mimic myocardium. The two balloons were suspended in a radioactive gel background. The radioactivity concentration ratio between the “myocardium” and the background was approximately 3:1. To mimic cold myocardial defects, three pieces of nonradioactive gel doped with Gadolinium were placed in the interspace. Beating motion was introduced by connecting the inner balloon to a ventilator which inflated and deflated the phantom at a rate of 65 times/min. Figures 1(b)–1(d) show the PET, conventional T1-weighted MR, and tMR images of the phantom, respectively.
FIG. 1.

(a) The beating cardiac phantom consisted of two inflatable balloons, and the interspace (approximately 1 cm thick) between the two balloons was filled with 18F gel with three pieces of nonradioactive gel doped with gadolinium to mimic cold defects in the myocardium. Beating motion was introduced by connecting the balloons to a ventilator. (b) PET, (c) conventional T1-weighted, and (d) tMR images of the phantom. Note that the three cold “defects” are visible on both MR and PET images.
2.B. tMR and PET acquisition
tMR data were acquired simultaneously with PET list-mode events on two simultaneous PET-MR scanners. In tMR, a special combination of pulses and gradients is used to introduce signal modulation in line or grid pattern that persists in the myocardial muscle during one heartbeat.3 The lines deform with the underlying tissue’s motion during myocardium contraction. The signal variation introduced by the tag lines allows motion estimation for uniform medium. Tagging was ECG-triggered by the R-wave in the patient acquisition and by external air pressure-based triggering in the beating phantom study. The tagging process takes approximately 20 ms for each heart beat. A multislice/multiphase gradient recalled echo (GRE) MRI acquisition of nine volumes, one for each cardiac phase, followed tagging to reveal the motion throughout the cardiac cycle. The tagging sequence used in this work was 1-1 SPAMM (SPAtial Modulation of Magnetization4). The multislice (nine slices were used in this work) interleaved acquisition was then performed with tags in the acquisition plane. Because this technique is sensitive to motion perpendicular to the tag lines and insensitive to through-slice motion and motion along the tag lines, the same acquisition was performed for each of the X, Y, and Z directions. The final tMR image volumes were obtained by summing the X, Y, Z volumes together.
The phantom data were acquired on a Siemens simultaneous PET-MR prototype scanner installed in the Department of Imaging (A. Martinos Center for Biomedical Imaging) at Massachusetts General Hospital using an eight-channel head coil. This PET-MR system consists of a MR compatible PET insert and a 3 T Magnetom Tim Trio MR scanner. The parameters of the tMR sequence were echo time (TE) = 2.41 ms, repetition time (TR) = 100 ms, flip angle (FA) = 25°, tagging distance = 8 mm, acquisition matrix size of 144 (read-out) × 144 (phase encoding) for each slice and each of the 9 cardiac phases, in-plane resolution =1 × 1 mm2, slice thickness = 8 mm, 16 slices. The tMR acquisition took 6 min and 45 s when the “heart rate” was set to 65BPM. Note that there was no respiratory gating in the phantom acquisition; the acquisition time will double when assuming a 50% respiratory gating efficiency. The PET acquisition for the beating heart phantom was performed for 30 min, and the acquired data were divided into ten independent noise realizations.
Cardiac patient data were acquired on a commercial whole-body PET-MR scanner (Biograph mMR, Siemens Healthcare, Erlangen, Germany) at the National Institutes of Health Clinical Center using a posterior spinal coil and an anterior flexible surface coil. The acquisition was performed after approximately 8 h uptake time, for which 375.1 Mbq (10.1 mCi) of 18F-FDG was injected. The patient study was approved by the NIH institutional review board and informed consent was obtained prior to the study. The tMR acquisition parameters were TE = 2.10 ms, TR = 84 ms, FA = 9°, tagging distance = 8 mm with in-plane resolution 2.3 × 2.3 mm2 and slice thickness = 8 mm, 9 slices were used to cover the entire heart for each acquisition direction, the acquisition matrix was 192 (read-out) × 114 (phase encoding). To avoid imaging artifact caused by respiratory motion, respiratory gating was used with MR pencil-beam navigator39 placed at the dome of the liver. tMR acquisition was only performed when the respiratory phase is at end-exhalation. With a 60% respiratory gating efficiency, the acquisition of the tMR images took approximately 8 min and 30 s.
PET list-mode data were acquired simultaneously with the tMR acquisition. PET and MR data were synchronized by cardiac triggers stored in PET list-mode and MR physiological measurement unit signal logging.
2.C. Parallel imaging
PI is accomplished by acquiring a reduced k-space using a uniform downsampling pattern along the phase encoding direction with multichannel RF coils and reconstructing the image with a priori knowledge of the smooth coil sensitivity maps.34 The reconstruction can be performed in image space [such as SENSE (Ref. 40)] or in k-space [such as GRAPPA (Ref. 41)]. In this work, GRAPPA was used for PI. In many implementations including the approach used here, the center of the k-space is always kept fully sampled to provide the coil sensitivity map.
In this work, PI was retrospectively performed by removing k-lines from the acquired raw multicoil MR data. GRAPPA (Ref. 41) algorithm was used with nominal acceleration factors (AFs) 2, 3, 4, and 6. There are r − 1 out of r phase encoding lines in k-space removed for nominal AF r. Since the center of k-space was fully sampled (12 lines), the final AFs were 1.9, 2.5, 3.2, and 4.3 for the corresponding nominal AFs. These numbers can be translated into equivalent reduction in acquisition time when the reduction is employed in the acquisition.39
The reduction of k-space (hence the reduction of acquisition time) using PI comes at the expense of residual artifacts and noise amplification.34
2.D. Compressed sensing
CS is another technique allowing to significantly undersample k-space by taking advantage of the implicit sparsity in MR images.36 For Cartesian acquisitions as used in this work, a pseudorandom sampling pattern in k-space with the center fully sampled is typically used. For dynamic MRI such as tMR imaging of the heart, a series of frames of the same moving object is acquired. Therefore, these images are compressible in the temporal direction and hence can be reconstructed with less data than Nyquist sampling limit using iterative reconstruction techniques promoting this compressibility.37,42
In this work, the kt-FOCUSS algorithm37 was used for the CS approach. Several reduction factors were tested: 2, 3, 4, 6, and 8 (corresponding to the resulting reduction in acquisition time if implemented in image acquisition). kt-FOCUSS reconstruction using undersampled tMR data can lead to loss of tagging contrast and blurry images.
2.E. Motion corrected PET reconstruction
2.E.1. tMR-based motion fields estimation
Although ideally the 3D motion should be estimated in real-time (subsecond temporal resolution), current MR scanners and techniques do not offer temporal resolution sufficient to acquire a full 3D tMR volume in less than 1 s. Therefore, it is necessary to assume that the average cardiac motion measured by the tMR acquisition is a good representation of the cardiac motion throughout the entire course of the PET acquisition.
Average motion fields were obtained from the nine tMR volumes (corresponding to nine cardiac phases) using B-spline nonrigid image registration.31,43 Such an example is shown in Fig. 2. This registration algorithm uses tags and edges as landmarks and estimates motion between adjacent cardiac phases while ensuring the smoothness and invertibility of the motion fields. On the one hand, the tags made it possible to measure the nonrigid motion in uniform area such as the myocardium; on the other hand, the underlying heart image itself ensures the motion along the myocardium edge is correctly estimated. Furthermore, as shown in Fig. 2, the tags help to distinguish myocardium and the blood.
FIG. 2.

(Left) Same transverse tMR slice representing two different cardiac phases. A dotted vertical line is shown for better visualization of the motion. (Right) The yellow arrows represent the transverse projection of the motion fields estimated using 3D nonrigid image registration overlaid on the image of phase 1.
The motion fields were calculated from fully sampled tMR images and accelerated tMR images obtained with various undersampling techniques and reduction factors discussed above. The nonrigid registration algorithm finds the optimal B-spline motion-warping operator minimizing the sum of squared differences (SSD) between intensities of the static target image (ftar) and the “motion-warped” source image (Tfsrc) such that
| (1) |
where ψSSD is the SSD operator, R is a regularization term44 enforcing the smoothness and invertibility of the estimated motion field, and η controls the strength of the regularization. The invertibility constraint ensures the nonrigid image registration algorithm provides realistic motion fields.
There are two main parameters that can be varied in the registration procedure: the motion field B-spline control grid spacing (h) and η. Based on parameters’ values tested in our previous studies,2,43 the parameters were set to h = 4 pixels and η = 1 000 000 in this study for all images.
2.E.2. Motion corrected PET reconstruction
The motion vectors were estimated on the MR voxel grid (typically ∼2 × 2 × 2 mm3 resolution which is much higher than the resolution of PET images) with subvoxel accuracy. The motion fields were resampled to match the resolution of PET voxel grid and then incorporated into a motion corrected ordered subset expectation maximization (OSEM) reconstruction algorithm with motion-dependent attenuation correction.2
The motion fields measured by tMR were incorporated into the PET system matrix Am,
| (2) |
where S is a diagonal matrix provides normalization factors for each lines of response (LORs), P is the forward-projection matrix obtained using Siddon’s ray-tracing algorithm,45 Tm is a diagonal matrix providing motion-dependent LOR attenuation correction factors for the mth motion phase, and Mm is the motion-warping operator registering any given cardiac phase m to the reference phase. Motion-dependent attenuation maps were generated by deforming the reference attenuation map using the motion-warping operator Mm. For the phantom study, the attenuation map was obtained using the same cardiac-gated GRE acquisition with tagging turned off, followed by segmentation into two tissue classes (air μ = 0.00 cm−1 and gel μ = 0.0096 cm−1). For the patient study, an attenuation map with four different tissue classes (air, fat, nonfat soft tissue, and lung) was obtained using the MR attenuation correction (MRAC) pulse sequence provided by the scanner and acquired during a breath-hold at end-exhalation.
Based on the PET system matrix formalism described by Eq. (2), iterative motion corrected OSEM reconstruction algorithms were implemented for the PET-MR prototype scanner2 and the whole-body mMR scanner.10
Since tMR images for cardiac motion measurement were only acquired at end-exhalation during the patient acquisition, the PET reconstruction for human data was performed using the events detected at the same respiratory phase (retrospective respiratory gating).
Because the scope of this work is to study the effect of tMR acquisition acceleration, PET images reconstructed using accelerated tMR images with various AFs were compared with images reconstructed with FS tMR for both phantom and patient datasets. PET data were also reconstructed with no motion correction (NMC) for reference. Phantom images were reconstructed on a 2 mm isotropic voxel grid with 10 iterations and 4 subsets, and the reconstructed images were smoothed using a Gaussian kernel with a full-width-at-half-maximum (FWHM) = 2 mm. In vivo images were reconstructed on a 2 mm isotropic voxel grid with 12 iterations and 8 subsets, and the reconstructed images were smoothed using a Gaussian kernel with a FWHM = 4 mm.
2.F. PET image quality assessment
To study the similarity of the PET images reconstructed from different tMR images, Pearsons product-moment correlation coefficients were calculated between the motion corrected PET images using accelerated tMR and the ones reconstructed with FS tMR for each noise realization. The mean correlation coefficients were then computed across the ten independent noise realizations. Similarly, the mean correlation coefficient for PET images with and without fully sampled tMR-based motion correction was also obtained.
Myocardial defect contrast analysis was also performed on the phantom data using the ten independent noise realizations. The myocardial defect contrast Cm was defined as
| (3) |
where ad is the activity concentration of the large transmural defect on the right in Fig. 1(a), and ab is the activity concentration of the gel background. Cm was obtained for each of the noise realization, and the mean and standard deviation were calculated across noise realizations. Independent samples t-test was performed to study the contrasts obtained using tMR images reconstructed with different techniques.
3. RESULTS
Figure 3 shows the tMR images of the same motion phase obtained using different reconstruction techniques. As shown in Figs. 3(b)–3(d), accelerated tMR images reconstructed using PI suffer from substantial noise amplification when compared to images reconstructed from fully sampled tMR data [Fig. 3(a)]. The noise becomes more pronounced when higher AF is used. Figures 3(e)–3(g) demonstrate the loss of tag contrast and image blurring associated with CS (specifically, kt-FOCUSS). As can be seen, blurring worsens as the AF of tMR images increases.
FIG. 3.
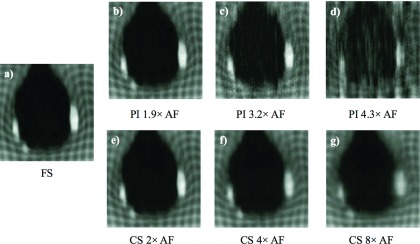
tMR images reconstructed from (a) fully sampled tMR data and accelerated tMR data with various AFs using (b)–(d) PI and (e)–(g) CS.
Although the tMR images reconstructed from accelerated data suffer from various image artifacts, it does not necessarily lead to significant changes in the motion fields estimated using these tMR images. Figure 4 shows tMR images at a different motion phase with the same acceleration technique and AFs as the images shown in Fig. 3. The motion fields corresponding to the image pairs of the two cardiac phases are depicted by the arrows superimposed on each image. As can be seen, the motion fields shown in Figs. 4(b), 4(c), and 4(e)–4(g) were similar to the motion fields extracted from fully sampled tMR data [Fig. 4(a)], which is the gold standard in this study. However, the obtained motion fields started to substantially deviate from the gold standard for AFs too high, as shown in Fig. 4(d). Consequently, it might be possible to obtain motion corrected PET images reconstructed from accelerated tMR images at appropriate AF, even though with artifacts in the tMR images, with good image quality.
FIG. 4.
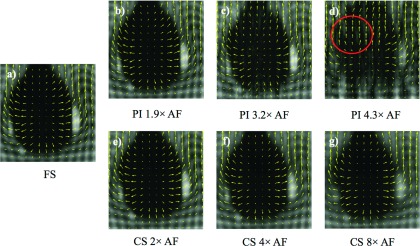
tMR images at a different cardiac phase with the same acceleration technique and AFs as the images shown in Fig. 3. The motion fields estimated from the paired images of two cardiac phases are illustrated by the arrows. The motion fields shown in (b), (c), and (e)–(g) are similar to the motion fields shown in (a); the region inside the circle in (d) demonstrated visible deviation from the motion fields in (a).
Figure 5 shows PET images of the cardiac phantom reconstructed with motion correction from motion fields obtained from fully sampled tMR images and accelerated tMR images with various AFs. NMC image [Fig. 5(e)] is shown for comparison. Taking the PET image reconstructed with fully sampled tMR images as the reference, the percent difference maps of the reconstructed PET using both PI and CS acceleration techniques with various AFs are also shown in Figs. 5(i)–5(n). It can be seen that the motion corrected PET images in Figs. 5(b)–5(d) and 5(f)–5(h) are similar to the PET image with motion correction obtained using fully sampled tMR data shown in Fig. 5(a). The observation is further confirmed by the corresponding percent difference maps [Figs. 5(i), 5(j), 5(l), and 5(m)]. The two nontransmural cardiac defects [arrow heads in Fig. 5(a)] are preserved even with as high as 8 times acceleration with CS. While all motion corrected PET images demonstrated large improvement from the image reconstructed without motion correction [shown in Fig. 5(e)], the quantitation accuracy of the activity concentration decreases as the AF increases for both acceleration techniques as demonstrated in the percent difference maps. The differences are generally <5% for PI with AF ≤ 3.2 and for CS with AF ≤ 4. Differences larger than 10% were observed in the difference map for PI with 4.3 times acceleration and CS with 8 times acceleration. The motion corrected PET images using accelerated tMR also show artifacts [arrows in Figs. 5(d) and 5(h)] when the AFs were too high for either PI or CS as shown in Figs. 5(d) and 5(h).
FIG. 5.

The PET images of one noise realization with motion correction using tMR images reconstructed using (a) fully sampled, (b)–(d) PI accelerated, and (f)–(h) CS accelerated tMR data with various AFs and (i)–(n) their corresponding percent difference maps using FS as the reference. (e) The NMC PET image is also shown for comparison. The arrowheads in (a) point to two nontransmural cardiac defects. Arrows in (d) and (h) point to image artifacts in motion corrected PET when AFs are too high. The artifacts are also clearly visualized in the percent difference maps.
The global similarity of the PET images were further studied quantitatively using linear correlation coefficient between the motion corrected PET images reconstructed using accelerated tMR images and the PET images reconstructed with fully sampled tMR images. The corresponding mean linear correlation coefficients as shown in Table I were obtained for each acceleration technique and AFs and averaged over ten noise realizations. The value is a decimal number between 0 and 1 representing the similarity between the images with higher values that represents higher similarity. As shown here, the of all motion corrected PET images using either PI or CS with various AFs is considerably higher than the of NMC. For higher AF values, it can be seen that the motion corrected PET images using CS accelerated tMR images are more similar to the gold standard than the PET images using PI accelerated tMR images with similar AF values. For instance, CS with AF = 8 yielded higher than PI with AF = 4.3 which is in agreement with the images shown in Fig. 5.
TABLE I.
Mean linear correlation between PET images reconstructed using fully sampled and accelerated tMR images of ten noise realizations.
| PI | CS | |||||||||
|---|---|---|---|---|---|---|---|---|---|---|
| AF | 1.9 × | 2.5 × | 3.2 × | 4.3 × | 2 × | 4 × | 6 × | 8 × | 12 × | NMC |
| 0.9984 | 0.9963 | 0.9922 | 0.9778 | 0.9982 | 0.9971 | 0.9952 | 0.9930 | 0.9891 | 0.9040 | |
Figure 6 shows the results of the myocardial defect contrast analysis performed on the cardiac phantom using the ten noise realizations. This analysis confirmed the observations made in Fig. 5 and Table I: the difference of the contrast values obtained from PET images reconstructed using fully sampled and accelerated tMR images was small and statistically nonsignificant for PI acceleration with AF = 1.9, 2.5, and 3.3, and CS acceleration with AF 2, 4, 6, and 8 (P > 0.05). However, the contrast of the defect obtained from PET images reconstructed from PI accelerated tMR images with AF = 4.3 and CS accelerated tMR images with AF = 12 was found to be significantly higher than the contrasts obtained using fully sampled tMR (P < 0.01). Nonetheless, they still yielded superior myocardial defect contrast than the one obtained from the PET image reconstructed without motion correction.
FIG. 6.

(Left) The arrow points to the cold transmural defect which the contrast analysis was performed on. The contrast was defined as the ratio of the mean activity concentrations of the defect and the warm background. (Right) Means and standard deviations of the contrast values obtained using ten noise realizations were shown for PET images reconstructed from fully sampled and accelerated tMR images, as well as NMC. The contrasts of the defect calculated using accelerated tMR images with PI using AFs 1.9, 2.5, and 3.3 and CS using AFs 2, 4, 6, and 8 were found to be not significantly different from the contrasts obtained using fully sampled tMR images, while those obtained using PI with AF 4.3, CS with AF 12, and without motion correction were found to be significantly different from the contrast derived using fully sampled tMR images.
Similar results were observed in the patient study shown in Fig. 7(a). Motion correction performed using both fully sampled and accelerated tMR images reduced PET image blurring and achieved better myocardial wall definition as compared to the image reconstructed without motion correction. The contrast of the papillary muscle within the left ventricle was also better recovered by both fully sampled tMR and accelerated tMR even with 8 times acceleration using CS. While using the image with fully sampled tMR-based motion correction as the reference, the percent difference map corresponding to the PET images reconstructed using accelerated tMR images and without motion correction is shown in Fig. 7(b). Large bias can be observed at inferolateral wall of the myocardium wall in the NMC map which is the region suffering from the most motion blurring. The bias is largely alleviated in the maps corresponding to the motion corrected images based on accelerated tMR images. The profiles of a line through the myocardial wall and papillary muscle [as illustrated in left top panel of Fig. 7(a)] are shown in Fig. 7(c). PET images reconstructed using both CS and PI accelerated tMR images produced similar profiles as the PET image reconstructed using fully sampled tMR data, while the profile corresponding to the PET image reconstructed without motion correction was substantially different than the others. The similarity of the line profiles was studied quantitatively using Pearson linear correlation coefficient. Both profiles of accelerated tMR techniques yielded considerably higher linear correlation coefficient than the profile from image reconstructed without motion correction [0.9966 (PI with AF = 2.4) and 0.9958 (CS with AF = 8) vs 0.9313 (NMC)].
FIG. 7.

(a) PET images reconstructed from the same PET list-mode data set (NMC) without motion correction and with motion correction using FS and accelerated tMR images (CS, PI), and (b) the difference maps of the CS, PI, NMC with FS as the reference. The accelerated tMR-based motion correction yields better myocardium contrast than the image reconstructed without cardiac motion correction. (c) The line profiles for the four reconstructed PET images of the line shown in the top left panel of (a). (d) The linear correlation coefficient of the line profiles of NMC, CS, and PI compared to the profile corresponding to FS.
4. DISCUSSION
In this work, tMR acceleration was performed using CS and PI. Both acceleration techniques introduced artifacts into the reconstructed tMR images as illustrated in Fig. 3. The accelerated tMR images with artifacts were used to estimate motion fields, which in turn were incorporated into the PET image reconstruction. The motion corrected PET images were compared with cardiac motion corrected PET images using fully sampled tMR images and PET images reconstructed without motion correction. Even though artifacts are present in the accelerated tMR images, it has been shown that these images can yield motion corrected PET images with similar quality to PET images reconstructed with motion correction using fully sampled tMR images and provide substantial image quality improvement compared to the images reconstructed without motion correction. Cardiac defect contrast analysis further demonstrated that accelerated tMR is able to provide similar quantitation in the motion corrected PET images to the fully sampled tMR for this specific task.
As shown above, accelerated tMR images with artifacts associated with specific acceleration techniques might still provide similar motion field estimation, and consequently similar tMR-based motion corrected PET, to the fully sampled tMR images. The results shown in Figs. 4–6 also demonstrated that when the AF is too high for either CS or PI, the image artifacts in the accelerated tMR images might become destructive and lead to erroneous motion fields, reducing the PET image quality improvement. As a result, it is important to determine the optimal AF that can be used to obtain similar motion corrected PET as the one using the fully sampled tMR. Due to the nature of CS and PI images artifacts, the optimal AF will depend on many factors including specific CS and PI techniques, number of RF coils available, RF coil arrangement, strength of the magnet, size of the subject, heart rate of the subject, etc. Therefore, although the optimal AF can be different for each scan, it is still possible to obtain a conservative AF upper limit for a given acceleration technique and a given scanner with the same RF coil placement. The determination of this upper limit is still an open question and warrants further research.
As shown in Figs. 5 and 6, both CS and PI tMR acceleration techniques led to PET images with similar quality for small to moderate AFs (<4), whereas CS acceleration outperformed PI acceleration for higher AF values. As shown in Table I, the PET images reconstructed from 8 times accelerated tMR using CS were more similar to the gold standard than the images reconstructed from 3.2 times PI accelerated tMR images. This is mainly due to the fact that images are highly compressible in the temporal direction. As a result, CS acceleration might be preferred when high AF is desired.
Even though the quality of the reconstructed PET images deteriorates for high AFs using either CS or PI, as shown in Figs. 5 and 6, the reconstructed PET images remain superior to the images reconstructed without motion correction in terms of myocardial wall intensity recovery (Fig. 5) or quantitative analysis of the myocardial defect contrast (Fig. 6). This suggests that highly accelerated tMR acquisition might still be worth performing when the acquisition time is limited and does not permit fully sampled tMR acquisition or tMR acceleration with optimal AF. Future studies are needed to confirm this observation.
In this work, PI and CS were implemented using GRAPPA and kt-FOCUSS, respectively. Both of these two MR acceleration techniques have many other implementations which are expected to yield similar performance. The optimal AF, however, might be different from implementation to implementation. As shown in Fig. 3, a major image artifact arising from the use of kt-FOCUSS is the loss of image contrast. This is partially due to the fact the specific implementation assumes all images have the same contrast. This artifact might be alleviated using a recently developed modified kt-FOCUSS technique with patch based low-rank regularization.46 Moreover, the studies performed in this work were conducted using Cartesian MR sampling trajectory, higher acceleration of acquisition time might be achieved using other trajectories such as radial or spiral.47 We also would like to point out that the accelerated data were obtained by decimating fully sampled raw tMR data in this study; when correctly implemented in MR acquisition, the accelerated data are likely to have a better performance than the decimated data because less variation is expected in the reduced acquisition duration.
The scope of this work was to investigate the impact of tMR acceleration on the reconstructed motion corrected PET images. We only studied the tMR-based cardiac motion correction.10 Even though the cardiac motion fields were only measured at end-expiration phase, the measured cardiac motion fields can be used to correct its motion in any respiratory phase under the approximation that cardiac motion is superimposed on top of the respiratory motion. Other MR acquisition techniques, such as radial FLASH,24 can be used to independently measure respiratory motion of heart and combined with the cardiac motion fields measured using tMR to obtain motion for any given combination of respiratory and cardiac phases.10 As a result, all PET events detected in any respiratory and cardiac phase can be used to form the final motion corrected image.
One limitation of this work is that task-based image quality analysis was only performed using myocardial defect contrast analysis on phantom data. Depending on the specific task, other objective image quality analysis such as channelized Hotelling observer analysis can also be performed. Although this kind of task-based analysis is difficult to perform on in vivo data due to the requirement for multiple noise realizations, the efficacy of the accelerated tMR-based motion correction still needs to be evaluated in vivo statistically using a larger patient cohort for which further studies are needed.
5. CONCLUSION
Images reconstructed from accelerated tMR images can provide accurate motion fields and yield tMR-based motion corrected PET images with similar image quality as those reconstructed using fully sampled tMR data. The reduction of tMR acquisition time makes it more compatible with routine clinical cardiac PET-MR and can alleviate potential image artifacts associated with long acquisition.
ACKNOWLEDGMENTS
This research was supported in part by NIH Grant No. R21-EB012326, R01-CA165221, R01-HL110241, R01-HL118261, NIH intramural research program, the Athinoula A. Martinos Center for Biomedical Imaging, the Imaging Sciences Training Program at the National Institutes of Health, and the Center for Functional Neuroimaging Technologies (funded by NIH Grant No. P41-EB015896). The authors would like to thank Wen-Tung Wang for the help with patient acquisition.
REFERENCES
- 1.Hachamovitch R., Hayes S. W., Friedman J. D., Cohen I., and Berman D. S., “Comparison of the short-term survival benefit associated with revascularization compared with medical therapy in patients with no prior coronary artery disease undergoing stress myocardial perfusion single photon emission computed tomography,” Circulation 107, 2900–2907 (2003). 10.1161/01.CIR.0000072790.23090.41 [DOI] [PubMed] [Google Scholar]
- 2.Petibon Y., Ouyang J., Zhu X., Huang C., Reese T., Li Q., and El Fakhri G., “Cardiac motion compensation and resolution modeling in simultaneous PET-MR: A cardiac lesion detection study,” Phys. Med. Biol. 58, 2085–2102 (2013). 10.1088/0031-9155/58/7/2085 [DOI] [PMC free article] [PubMed] [Google Scholar]
- 3.McVeigh E. R., “MRI of myocardial function: Motion tracking techniques,” Magn. Reson. Imaging 14, 137–150 (1996). 10.1016/0730-725X(95)02009-I [DOI] [PubMed] [Google Scholar]
- 4.Axel L. and Dougherty L., “MR imaging of motion with spatial modulation of magnetization,” Radiology 171, 841–845 (1989). 10.1148/radiology.171.3.2717762 [DOI] [PubMed] [Google Scholar]
- 5.Hickey K. T., Sciacca R. R., Bokhari S., Rodriguez O., Chou R.-L., Faber T. L., Cooke C. D., Garcia E. V., Nichols K., and Bergmann S. R., “Assessment of cardiac wall motion and ejection fraction with gated PET using N-13 ammonia,” Clin. Nucl. Med. 29, 243–248 (2004). 10.1097/01.rlu.0000118001.14457.c3 [DOI] [PubMed] [Google Scholar]
- 6.Yang Y., Rendig S., Siegel S., Newport D. F., and Cherry S. R., “Cardiac PET imaging in mice with simultaneous cardiac and respiratory gating,” Phys. Med. Biol. 50, 2979–2989 (2005). 10.1088/0031-9155/50/13/001 [DOI] [PubMed] [Google Scholar]
- 7.Büther F., Dawood M., Stegger L., Wübbeling F., Schäfers M., Schober O., and Schäfers K. P., “List mode-driven cardiac and respiratory gating in pet,” J. Nucl. Med. 50, 674–681 (2009). 10.2967/jnumed.108.059204 [DOI] [PubMed] [Google Scholar]
- 8.Teräs M., Kokki T., Durand-Schaefer N., Noponen T., Pietilä M., Kiss J., Hoppela E., Sipilä H. T., and Knuuti J., “Dual-gated cardiac PET-Clinical feasibility study,” Eur. J. Nucl. Med. Mol. Imaging 37, 505–516 (2010). 10.1007/s00259-009-1252-4 [DOI] [PubMed] [Google Scholar]
- 9.Petibon Y., Huang C., Ouyang J., Reese T. G., Li Q., Syrkina A., Chen Y. L., and El Fakhri G., “Relative role of motion and PSF compensation in whole-body oncologic PET-MR imaging,” Med. Phys. 41, 042503 (12 pp.) (2014). 10.1118/1.4868458 [DOI] [PMC free article] [PubMed] [Google Scholar]
- 10.Petibon Y., Huang C., Ouyang J., Reese T., Kolnick A., Chen Y.-L., and El Fakhri G., “Cardiac, respiratory motion and point spread function (PSF) compensation in simultaneous PET-MR: A cardiac sarcoma study,” J. Nucl. Med. Meet. Abstr. 55, 647 (2014). [Google Scholar]
- 11.Würslin C., Schmidt H., Martirosian P., Brendle C., Boss A., Schwenzer N. F., and Stegger L., “Respiratory motion correction in oncologic PET using T1-weighted MR imaging on a simultaneous whole-body PET/MR system,” J. Nucl. Med. 54, 464–471 (2013). 10.2967/jnumed.112.105296 [DOI] [PubMed] [Google Scholar]
- 12.Klein G. J. and Huesman R. H., “Four-dimensional processing of deformable cardiac PET data,” Med. Image Anal. 6, 29–46 (2002). 10.1016/S1361-8415(01)00050-0 [DOI] [PubMed] [Google Scholar]
- 13.Dawood M., Buther F., Jiang X., and Schafers K. P., “Respiratory motion correction in 3-D PET data with advanced optical flow algorithms,” IEEE Trans. Med. Imaging 27, 1164–1175 (2008). 10.1109/tmi.2008.918321 [DOI] [PubMed] [Google Scholar]
- 14.Slomka P. J., Nishina H., Berman D. S., Kang X., Akincioglu C., Friedman J. D., Hayes S. W., Aladl U. E., and Germano G., “Motion-frozen’ display and quantification of myocardial perfusion,” J. Nucl. Med. 45, 1128–1134 (2004). [PubMed] [Google Scholar]
- 15.Gigengack F., Ruthotto L., Burger M., Wolters C. H., Jiang X., and Schafers K. P., “Motion correction in dual gated cardiac PET using mass-preserving image registration,” IEEE Trans. Med. Imaging 31, 698–712 (2012). 10.1109/tmi.2011.2175402 [DOI] [PubMed] [Google Scholar]
- 16.Qiao F., Pan T., J. W. Clark, Jr., and Mawlawi O. R., “A motion-incorporated reconstruction method for gated PET studies,” Phys. Med. Biol. 51, 3769–3783 (2006). 10.1088/0031-9155/51/15/012 [DOI] [PubMed] [Google Scholar]
- 17.Lamare F., Carbayo M. L., Cresson T., Kontaxakis G., Santos A., Le Rest C. C., Reader A., and Visvikis D., “List-mode-based reconstruction for respiratory motion correction in PET using non-rigid body transformations,” Phys. Med. Biol. 52, 5187–5204 (2007). 10.1088/0031-9155/52/17/006 [DOI] [PubMed] [Google Scholar]
- 18.Rahmin A., Dinelle K., Cheng J., Shilov M., Segars W., Lidstone S., Blinder S., Rousset O., Vajihollahi H., Tsui B., Wong D., and Sossi V., “Accurate event-driven motion compensation in high-resolution PET incorporating scattered and random events,” IEEE Trans. Med. Imaging 27, 1018–1033 (2008). 10.1109/tmi.2008.917248 [DOI] [PMC free article] [PubMed] [Google Scholar]
- 19.Li T., Thorndyke B., Schreibmann E., Yang Y., and Xing L., “Model-based image reconstruction for four-dimensional PET,” Med. Phys. 33, 1288–1298 (2006). 10.1118/1.2192581 [DOI] [PubMed] [Google Scholar]
- 20.Ohnesorge B., Flohr T., Becker C., Kopp A. F., Schoepf U. J., Baum U., Knez A., Klingenbeck-Regn K., and Reiser M. F., “Cardiac imaging by means of electrocardiographically gated multisection spiral CT: Initial experience,” Radiology 217, 564–571 (2000). 10.1148/radiology.217.2.r00nv30564 [DOI] [PubMed] [Google Scholar]
- 21.Furst S., Grimm R., Hong I., Souvatzoglou M., Casey M., Schwaiger M., Ziegler S., and Nekolla S., “MR-and PET-driven motion correction for integrated PET-MR abdominal/thoracic imaging,” J. Nucl. Med. 55(Suppl. 1), 643 (2014). [Google Scholar]
- 22.Huang C., Ackerman J. L., Petibon Y., Brady T. J., El Fakhri G., and Ouyang J., “MR-based motion correction for PET imaging using wired active MR microcoils in simultaneous PET-MR: Phantom studya),” Med. Phys. 41, 041910 (8 pp.) (2014). 10.1118/1.4868457 [DOI] [PMC free article] [PubMed] [Google Scholar]
- 23.Huang C., Ackerman J. L., Petibon Y., Normandin M. D., Brady T. J., El Fakhri G., and Ouyang J., “Motion compensation for brain PET imaging using wireless MR active markers in simultaneous PET-MR: Phantom and non-human primate studies,” NeuroImage 91, 129–137 (2014). 10.1016/j.neuroimage.2013.12.061 [DOI] [PMC free article] [PubMed] [Google Scholar]
- 24.Dutta J., El Fakhri G., Huang C., Petibon Y., Reese T. G., and Li Q., “Respiratory motion compensation in simultaneous PET/MR using a maximum a posteriori approach,” in Biomedical Imaging (ISBI), 2013 IEEE 10th International Symposium, San Francisco, CA (IEEE, 2013), pp. 800–803. 10.1109/ISBI.2013.6556596 [DOI] [Google Scholar]
- 25.King A., Tsoumpas C., Buerger C., Schulz V., Marsden P., and Schaeffter T., “Real-time respiratory motion correction for simultaneous PET-MR using an MR-derived motion model,” in Nuclear Science Symposium and Medical Imaging Conference (NSS/MIC), Valencia (IEEE, 2011), pp. 3589–3594. 10.1109/NSSMIC.2011.6153674 [DOI] [Google Scholar]
- 26.Dikaios N., Izquierdo-Garcia D., Graves M. J., Mani V., Fayad Z. A., and Fryer T. D., “MRI-based motion correction of thoracic PET: Initial comparison of acquisition protocols and correction strategies suitable for simultaneous PET/MRI systems,” Eur. Radiol. 22, 439–446 (2012). 10.1007/s00330-011-2274-4 [DOI] [PMC free article] [PubMed] [Google Scholar]
- 27.Catana C., Benner T., van der Kouwe A., Byars L., Hamm M., Chonde D. B., Michel C. J., El Fakhri G., Schmand M., and Sorensen A. G., “MRI-assisted PET motion correction for neurologic studies in an integrated MR-PET scanner,” J. Nucl. Med. 52, 154–161 (2011). 10.2967/jnumed.110.079343 [DOI] [PMC free article] [PubMed] [Google Scholar]
- 28.Guo L., Ahlman M., Feng T., Guttman M., McVeigh E., Bluemke D., Tsui B., and Herzka D., “Real-time 3D MR respiratory motion acquisition for simultaneous PET/MR imaging,” J. Nucl. Med. 55(Suppl. 1), 644 (2014). [Google Scholar]
- 29.Feng T., Ahlman M., Tsui B., Guo L., Guttman M., McVeigh E., and Bluemke D., “Hybrid MR-guided and PET-guided motion correction of PET images in simultaneous PET/MR,” J. Nucl. Med. 55(Suppl. 1), 646 (2014). [Google Scholar]
- 30.Fayad H., Schmidt H., Wuerslin C., and Visvikis D., “Reconstruction space non rigid respiratory motion correction in whole body PET/MR imaging,” J. Nucl. Med. 55(1), 154 (2014). 24232871 [Google Scholar]
- 31.Guérin B., Cho S., Chun S., Zhu X., Alpert N., El Fakhri G., Reese T., and Catana C., “Nonrigid PET motion compensation in the lower abdomen using simultaneous tagged-MRI and PET imaging,” Med. Phys. 38, 3025–3038 (2011). 10.1118/1.3589136 [DOI] [PMC free article] [PubMed] [Google Scholar]
- 32.Altbach M., Barr T., Singh J., Ainapurapu B., Kc D., Squire S., Galons J.-P., Huang C., and Abidov A., “T2 mapping of the heart with high temporal and spatial resolution using a radial double inversion fast spin-echo pulse sequence with view sharing,” J. Cardiovasc. Magn. Reson. 14, O112 (2012). 10.1186/1532-429X-14-S1-O112 [DOI] [Google Scholar]
- 33.Sosnovik D. E., Wang R., Dai G., Reese T. G., and Wedeen V. J., “Diffusion MR tractography of the heart,” J. Cardiovasc. Magn. Reson. 11, 47 (2009). 10.1186/1532-429X-11-47 [DOI] [PMC free article] [PubMed] [Google Scholar]
- 34.Deshmane A., Gulani V., Griswold M. A., and Seiberlich N., “Parallel MR imaging,” J. Magn. Reson. Imaging 36, 55–72 (2012). 10.1002/jmri.23639 [DOI] [PMC free article] [PubMed] [Google Scholar]
- 35.Ji J. X., Son J. B., and Rane S. D., “PULSAR: A matlab toolbox for parallel magnetic resonance imaging using array coils and multiple channel receivers,” Concepts Magn. Reson. Part B 31B, 24–36 (2007). 10.1002/cmr.b.20081 [DOI] [Google Scholar]
- 36.Lustig M., Donoho D., and Pauly J. M., “Sparse MRI: The application of compressed sensing for rapid MR imaging,” Magn. Reson. Med. 58, 1182–1195 (2007). 10.1002/mrm.21391 [DOI] [PubMed] [Google Scholar]
- 37.Jung H., Sung K., Nayak K. S., Kim E. Y., and Ye J. C., “k-t FOCUSS: A general compressed sensing framework for high resolution dynamic MRI,” Magn. Reson. Med. 61, 103–116 (2009). 10.1002/mrm.21757 [DOI] [PubMed] [Google Scholar]
- 38.Donoho D. L., “Compressed sensing,” IEEE Trans. Inf. Theory 52, 1289–1306 (2006). 10.1109/tit.2006.871582 [DOI] [Google Scholar]
- 39.Nehrke K., Börnert P., Groen J., Smink J., and Böck J. C., “On the performance and accuracy of 2D navigator pulses,” Magn. Reson. Imaging 17, 1173–1181 (1999). 10.1016/S0730-725X(99)00043-0 [DOI] [PubMed] [Google Scholar]
- 40.Pruessmann K. P., Weiger M., Scheidegger M. B., and Boesiger P., “SENSE: Sensitivity encoding for fast MRI,” Magn. Reson. Med. 42, 952–962 (1999). 10.1002/(SICI)1522-2594(199911)42:53.0.CO;2-S [DOI] [PubMed] [Google Scholar]
- 41.Griswold M. A., Jakob P. M., Heidemann R. M., Nittka M., Jellus V., Wang J., Kiefer B., and Haase A., “Generalized autocalibrating partially parallel acquisitions (GRAPPA),” Magn. Reson. Med. 47, 1202–1210 (2002). 10.1002/mrm.10171 [DOI] [PubMed] [Google Scholar]
- 42.Jung H., Ye J. C., and Kim E. Y., “Improved k-t BLAST and k-t SENSE using FOCUSS,” Phys. Med. Biol. 52, 3201–3226 (2007). 10.1088/0031-9155/52/11/018 [DOI] [PubMed] [Google Scholar]
- 43.Chun S. Y., Reese T. G., Ouyang J., Guerin B., Catana C., Zhu X., Alpert N. M., and El Fakhri G., “MRI-based nonrigid motion correction in simultaneous PET/MRI,” J. Nucl. Med. 53, 1284–1291 (2012). 10.2967/jnumed.111.092353 [DOI] [PMC free article] [PubMed] [Google Scholar]
- 44.Chun S. and Fessler J., “A simple regularizer for B-spline nonrigid image registration that encourages local invertibility,” IEEE Sel. Top. Signal Process. 3, 159–169 (2009). 10.1109/jstsp.2008.2011116 [DOI] [PMC free article] [PubMed] [Google Scholar]
- 45.Siddon R. L., “Fast calculation of the exact radiological path for a three-dimensional CT array,” Med. Phys. 12, 252–255 (1985). 10.1118/1.595715 [DOI] [PubMed] [Google Scholar]
- 46.Yoon H., Kim K. S., and Ye J. C., “Motion residual reconstruction using low rank property of similarity patches in motion compensated compressed sensing dynamic MRI,” Proc. Int. Soc. Magn. Reson. Med. 21, 3803 (2013). [Google Scholar]
- 47.Ryf S., Kissinger K. V., Spiegel M. A., Börnert P., Manning W. J., Boesiger P., and Stuber M., “Spiral MR myocardial tagging,” Magn. Reson. Med. 51, 237–242 (2004). 10.1002/mrm.10688 [DOI] [PubMed] [Google Scholar]