Abstract
Tuberous sclerosis complex (TSC) is an autosomal dominant syndrome associated with tumors of the brain, heart, kidney, and lung. The TSC protein complex inhibits the mammalian or mechanistic target of Rapamycin complex 1 (mTORC1). Inhibitors of mTORC1, including Rapamycin, induce a cytostatic response in TSC tumors, resulting in temporary disease stabilization and prompt regrowth when treatment is stopped. The lack of TSC-specific cytotoxic therapies represents an important unmet clinical need. Using a high-throughput chemical screen in TSC2-deficient, patient-derived cells we identified a series of molecules antagonized by Rapamycin and therefore selective for cells with mTORC1 hyperactivity. In particular, the cell-permeable alkaloid chelerythrine induced reactive oxygen species (ROS) and depleted glutathione (GSH) selectively in TSC2-null cells based on metabolic profiling. N-acetylcysteine (NAC) or GSH co-treatment protected TSC2-null cells from chelerythrine's effects, indicating that chelerythrine-induced cell death is ROS-dependent. Induction of hemeoxygenase-1 (HMOX1/HO-1) with hemin also blocked chelerythrine-induced cell death. In vivo, chelerythrine inhibited the growth of TSC2-null xenograft tumors with no evidence of systemic toxicity with daily treatment over an extended period of time. This study reports the results of a bioactive compound screen and the identification of a potential lead candidate that acts via a novel oxidative stress-dependent mechanism to selectively induce necroptosis in TSC2-deficient tumors.
Keywords: tuberous sclerosis complex, chelerythrine chloride, ROS, glutathione, necroptosis, heme-oxygenase 1
Introduction
Tuberous Sclerosis Complex (TSC) is an autosomal dominant, hamartomatous syndrome characterized by seizures, autism, and tumors of the brain (subependymal giant cell astrocytomas), heart (rhabdomyomas), kidney (angiomyolipomas), and skin (angiofibromas). Multiple bilateral renal angiomyolipomas occur in the majority of both children and adults with TSC. At least thirty percent of women with TSC develop lymphangioleiomyomatosis (LAM), a destructive cystic lung disease (1, 2). LAM also occurs in a sporadic form, in which somatic TSC2 mutations are found in the distinctive pulmonary LAM cells and in renal angiomyolipomas, which occur in approximately 50% of sporadic LAM patients.
TSC is caused by germline loss of function mutations in either the TSC1 or TSC2 gene, which encode the proteins hamartin and tuberin. The TSC protein complex negatively regulates the activity of the mammalian or mechanistic target of Rapamycin (mTOR) kinase via the small GTPase Rheb (3–5). mTOR is a serine/threonine protein kinase complex that regulates autophagy, cell growth, cell proliferation, cell motility, protein synthesis, transcription, and cell survival (6, 7). Two distinct mTOR kinase complexes have been identified: mTORC1, which includes mTOR, Raptor, MLST8, DEPTOR, and Pras40, and mTORC2, which contains mTOR, Rictor, MSIN1, and GβL (8).
Clinical trials have demonstrated the efficacy of mTORC1 inhibitors in TSC and LAM. Rapamycin (sirolimus), which inhibits mTORC1, slows further loss of lung function in LAM and partially decreases the size of TSC-associated kidney and brain tumors (9, 10). Everolimus, a sirolimus analog or “Rapalog,” also induces a partial decrease in tumor size and is FDA-approved for the treatment of angiomyolipomas and subependymal astrocytomas (11, 12). Rapalogs appear to induce a primarily cytostatic effect in TSC-deficient cells. Tumors regrow and lung function declines when treatment is discontinued (9, 10), with documented regrowth of a subependymal giant cell astrocytoma to its original size within 6 weeks after discontinuation of Rapamycin (13). Therefore, continuous therapy appears to be necessary in both adults and children with TSC-associated tumors and/or LAM. The adverse effects of Rapalogs include oral mucositis, fatigue, hyperlipidemia, interstitial pneumonitis, electrolyte imbalance, and immune suppression, further underscoring the unmet clinical need for therapeutic strategies that induce a cytocidal rather than cytostatic response in cells with hyperactive mTORC1, thereby inducing more complete and durable clinical responses.
To identify compounds that induce death in mTORC1-hyperactive cells, we performed a high-throughput screen of 6,700 “known bioactive” compounds using human angiomyolipoma-derived cells that carry bi-allelic inactivation of the TSC2 gene (14). The screen was performed in the presence and absence of Rapamycin, allowing the identification of compounds that selectively inhibit proliferation in the setting of hyperactive mTORC1, which we refer to as Rapamycin antagonists. Thirty-two compounds were antagonized by Rapamycin by least 2-fold, thereby meeting the criterion of acting selectively in the presence of hyperactive mTORC1. Chelerythrine chloride demonstrated the highest fold Rapamycin antagonism. Chelerythrine chloride is a plant-derived benzophenanthridine alkaloid that was first identified as a Protein Kinase C (PKC) inhibitor (15). However, it has since been found to induce rapid release of cytochrome c (16, 17), decrease Bcl-xL and increase Bax expression (18), induce reactive oxygen species (ROS) (19, 20), and activate RAF/MEK/ERK signaling (21). Here, we demonstrate that chelerythrine chloride treatment depletes glutathione levels and induces ROS production in TSC2-null cells, leading to necroptotic cell death. These data support the hypothesis that the metabolic vulnerabilities of TSC2-deficient cells can be therapeutically targeted by single agents, without the use of mTORC1 inhibitors.
Materials and Methods
Cell culture and reagents
621-101, ELT-V3/T3, and mouse embryonic fibroblasts (MEFs) were maintained in high glucose DMEM supplemented with 10% FBS and 1% pen/strep. The V3/T3 cell media was additionally supplemented with 2 ug/mL of puromycin (Invitrogen). Chelerythrine chloride, Mitotempo, NAC, and Necrostatin-1 were purchased from Sigma-Aldrich.
High-throughput screen
621-101 cells were plated at a density of 1200 cells/well in 384-well format and incubated overnight at 5% CO2 and 37°C. 16 hours later, cells were pretreated with either DMSO or 20 uM Rapamycin for 2 hours. Compound libraries were then pin transferred to a final concentration of 10–30 uM (depending on the library plate). Plates were incubated for an additional 48 hours and ATP levels analyzed via CellTiter Glo Assay. All compound library plates were tested in duplicate. The Known Bioactive Collection was screened. Details of this collection of compounds can be found at http://iccb.med.harvard.edu/libraries/compound-libraries/#known.
Cell proliferation assay (crystal violet)
Cells were plated in either 12- or 96-well format and allowed to grow to approximately 60% confluency. Following treatment, cells were fixed with 10% formalin and stained with crystal violet (0.05% solution) for 30 minutes. Cells were washed twice with water and solubilized by the addition of methanol and shaking for 10 minutes. Absorbance was read at 540 nm.
Immunoblotting
Cells were lysed on ice in lysis buffer (1% NP-40, 25mM Tris pH 7.4, and 150mM NaCl) and centrifuged at 14,000 rpm for 15 minutes. The supernatants were boiled, proteins separated by SDS-PAGE, and transferred onto nitrocellulose. Membranes were incubated with the following antibodies from Cell Signaling: Actin, phospho-S6 (Ser235/36 and Ser240/44), phospho-p70S6K, PARP and cleaved PARP, TSC2, p-AKT (Ser473) HO-1, and p-ERK (p42/44); Sigma: p62; and Bach-1 and SP1: Santa Cruz Biotechnology. Chemiluminescent signal was captured using a Syngene G-BOX iChemi XT imager.
Preparation of Nuclear and Cytoplasmic Extracts
Nuclear extracts for Bach-1 were prepared from the cells using a nuclear extraction kit (Active Motif). Following treatment, cells were collected in PBS in the presence of phosphatase inhibitors. The cells were resuspended in hypotonic buffer (supplied with the kit) and incubated on ice for 15 min. Cytoplasmic fractions were collected after adding detergent (supplied with the kit) and centrifuging the cells. The nuclear pellets were resuspended in complete lysis buffer and incubated on ice for 30 min. The nuclear fractions were collected by centrifuging the cells for 10 min.
Receptor Tyrosine Kinase array
Tsc2+/+ and Tsc2−/− MEFs were treated with chelerythrine chloride (2 uM, 60 min.). Analysis of phosphorylated antibodies was performed as suggested by the manufacturer (R&D Systems). Chemiluminescent signal was captured using a Syngene G-BOX iChemi XT imager and densitometry was performed using Syngene GeneTools software.
Cellular ROS analysis
5,000 cells/well were plated in 96-well format. 16 hours later, a 100 mM solution of DFCDA was diluted 1:2000 in phenol red free DMEM and 100 uL was added to each well. Cells were incubated for 45 minutes, followed by the indicated treatments. Fluorescence was measured at an excitation of 485nm and emission of 535nm using a BioTek Synergy HT plate reader.
Metabolomic profiling
Tsc2+/+ and Tsc2−/− MEFs were treated with chelerythrine chloride (1 uM, 4h). Metabolites were isolated via cold methanol extraction. The supernatant was dried and samples were run on a AB/SCIEX 5500 QTRAP triple quadrupole instrument. Raw data was normalized to vehicle treated cells (n=3). Normalized data was analyzed using MetaboAnalyst (http://www.metaboanalyst.ca/MetaboAnalyst/).
Animal studies
All animal experiments were performed in accordance with approved protocols by the IACUC of Boston Children’s Hospital. Female intact nude mice (Charles River) were used. For xenograft tumors, 2 × 10⁶ cells were inoculated bilaterally into the posterior flank. Six-weeks post cell injection, mice bearing subcutaneous tumors were randomized into two groups: Vehicle control (n = 7, 10% DMSO in PBS, 100 uL/day, i.p.) and chelerythrine chloride (n = 9, 10 mg/kg/day, i.p.). Tumor area was measured weekly using a digital Caliper. Tumor volume was calculated: (width2 × length)/2.
Bioluminescent reporter imaging
Ten minutes prior to imaging, mice were injected with D-luciferin (Xenogen) (120 mg/kg, i.p.). Bioluminescent signals were recorded using a Xenogen IVVIS System. Total photon flux was analyzed for each tumor (22).
Results
A high-throughput screen for Rapamycin antagonists identifies chelerythrine chloride as an inhibitor of angiomyolipoma-derived 621-101 cells
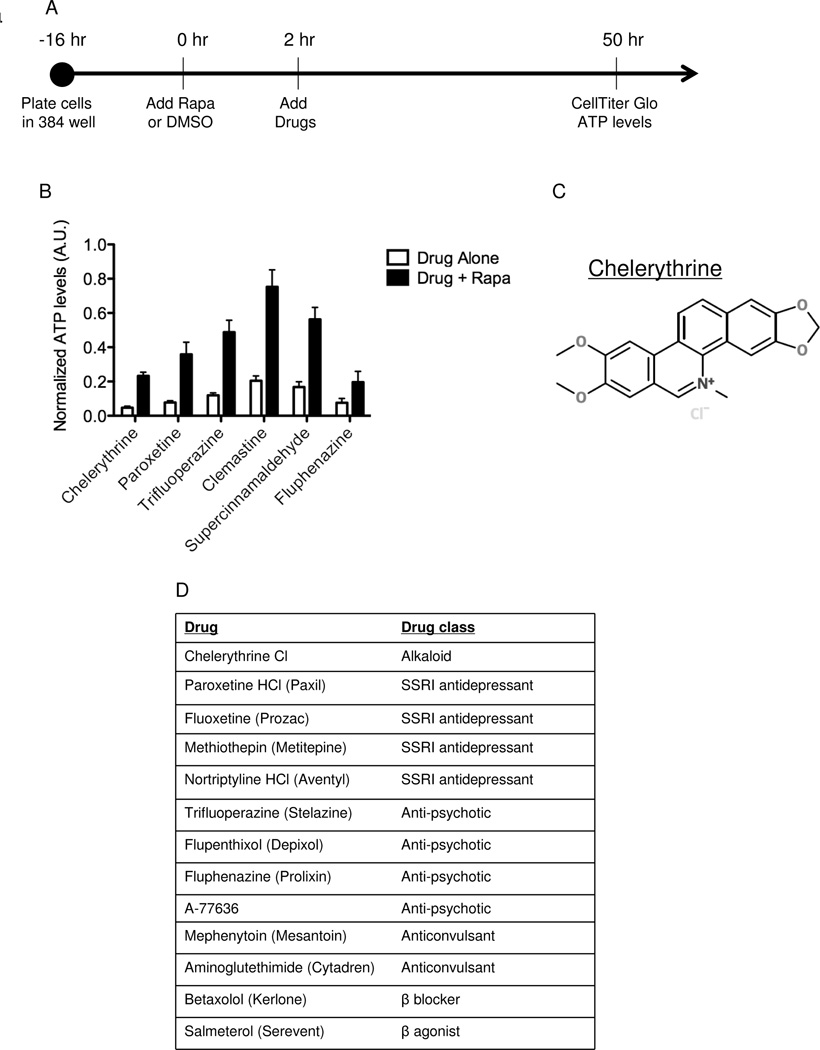
To discover single agents that inhibit TSC2-null, mTORC1 hyperactive cells we performed a high-throughput drug screen in 621-101 cells which were derived from a renal angiomyolipoma in a woman with the sporadic form of LAM and carry bi-allelic TSC2 inactivation (14, 23). The collections that were screened include approximately 6,700 agents that are FDA-approved, have been in clinical trials, and/or have a known mechanism of action. To identify agents that are act via an mTORC1-dependent mechanism, Rapamycin (20 nM), an allosteric mTORC1 inhibitor, was added 2 hours prior to pin transfer of the compounds. ATP levels were measured using CellTiter Glo after 48 hours of incubation (Figure 1A).
Figure 1. A high-throughput screen identifies chelerythrine chloride as a selective inhibitor of TSC2-deficient angiomyolipoma-derived cells.
A) Design of screen. 621-101 cells were plated in 384-well plates and incubated overnight. DMSO or Rapamycin (20 nM) was added for a 2 hr pretreatment. The compounds were then pin transferred and the cells incubated for an additional 48 hours. ATP levels were assayed using CellTiter Glo and normalized to DMSO treatment. B) Top 6 hits from the screen showing relative ATP levels with and without Rapamycin. C) The chemical structure of chelerythrine chloride. D) Drug classes for 13 of the 32 agents with greater than 2-fold higher ATP levels when combined with Rapamycin vs. DMSO.
Thirty-two compounds showed a greater than 2-fold inhibition of ATP levels when used alone vs. in combination with Rapamycin, indicating selectivity for cells with hyperactive mTORC1 (Table S1), representing several distinct drug classes (Figure 1B). The top hit, based on fold change, was chelerythrine chloride, a plant-derived benzophenanthridine alkaloid (Figure 1C). Interestingly, multiple selective serotonin reuptake inhibitors (SSRIs) and other neuroactive agents were identified in the screen, including paroxetine, which showed the second highest antagonism to Rapamycin (Figure 1D).
Chelerythrine chloride inhibits the growth of TSC2-null cells
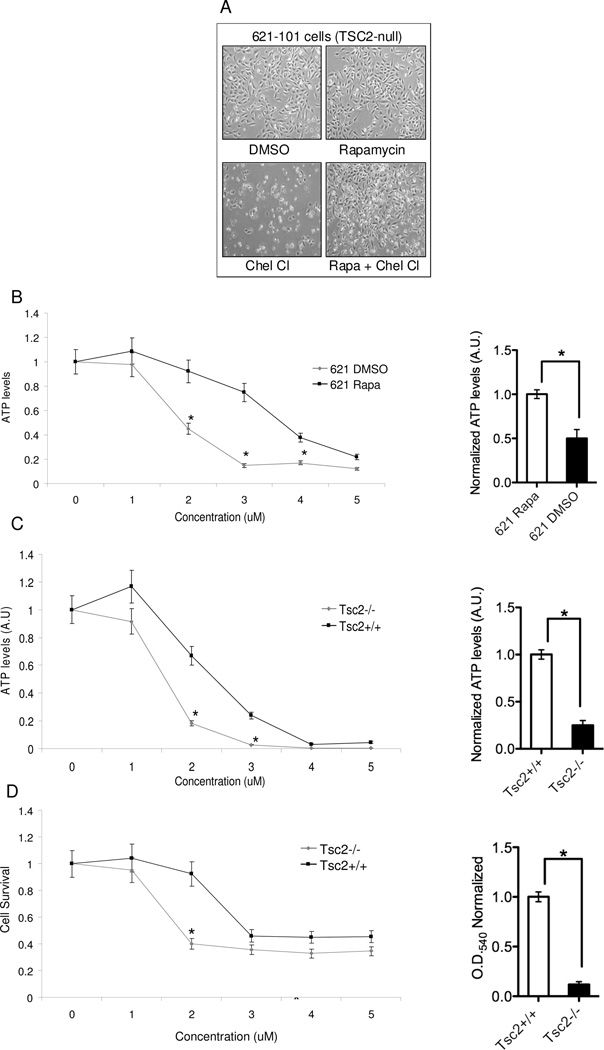
To confirm that chelerythrine chloride, the top hit from the screen, selectively inhibits mTORC1 hyperactive cells, 621-101 cells were treated for 24 hours with DMSO, Rapamycin (20 nM), chelerythrine chloride (2 uM), or Rapamycin (2 hour pretreatment) plus chelerythrine chloride (Figure 2A). Chelerythrine chloride inhibited growth when used alone, but not in combination with Rapamycin, consistent with the results from the screen. Paroxetine, the second highest hit in terms of fold-change of ATP levels with and without Rapamycin, inhibited the growth of TSC2-deficient ELT3-V3 cells, but not TSC2-expressing ELT3-T3 cells (Figure S1), further confirming the integrity of the screen.
Figure 2. Chelerythrine chloride’s inhibition of TSC2-null cells requires mTORC1 activation.
A) Phase contrast images (4X) of 621-101 cells treated with for 24 hours with DMSO, Rapamycin (20 uM) chelerythrine chloride (2 uM), or 2 hour Rapamycin pretreatment followed by chelerythrine chloride. B, C) ATP levels (measured using CellTiter Glo) in 621-101 cells and Tsc2+/+ and Tsc2−/− MEFs treated with 5 doses of chelerythrine chloride (n=8 per dose, *p<0.05). Bar graphs show normalized ATP levels at 2 uM. D) Proliferation (measured by crystal violet staining) of Tsc2+/+ and Tsc2−/− MEFs treated with 5 doses of chelerythrine chloride (n=8 per dose, *p<0.05). Bar graph shows normalized OD at 2 uM.
To define the dose-response of chelerythrine chloride we analyzed ATP levels using five concentrations of chelerythrine chloride (100 nM to 10 uM) in 621-101 cells (Figure 2B). The IC50 (the concentration that inhibited 50% of ATP levels) in 621-101 cells was 1.8 uM without Rapamycin vs. 3.75 uM with Rapamycin. To determine if the effects of chelerythrine are TSC2-dependent, we tested Tsc2+/+ and Tsc2−/− mouse embryonic fibroblasts (MEFs) (Figure 2C). The IC50 for Tsc2-null MEFs was 1.5 uM vs. 2.5 uM for the Tsc2+/+ MEFs. A significant decrease in cell survival, measured using crystal violet staining, was seen in the Tsc2−/− MEFs when compared with the Tsc2+/+ MEFs, consistent with the ATP analyses (Figure 2D). These data indicate that chelerythrine chloride-induced changes in cell number are TSC2-dependent.
Chelerythrine chloride induces cell death in Tsc2-null cells
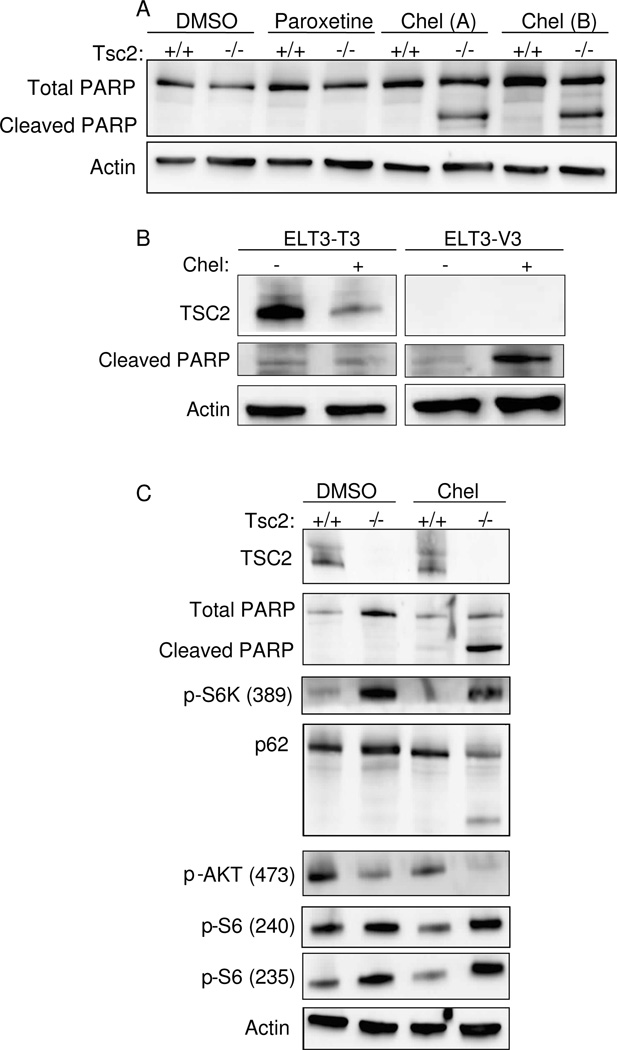
The major goal of the screen was to identify agents that induce a cytocidal, rather than cytostatic, response in Tsc2-null cells, because of the potential therapeutic benefit in TSC and LAM. To determine whether chelerythrine chloride induced cell death, we treated Tsc2-null and Tsc2+/+ MEFs with chelerythrine chloride (2 uM) or paroxetine (10 uM) for 4 hours and analyzed PARP levels by western blot (Figure 3A). Chelerythrine chloride induced PARP cleavage in Tsc2-null MEFs but not Tsc2-expressing MEFs. Interestingly, paroxetine, the second-highest hit from the screen, did not induce PARP cleavage at this timepoint. Together with the data in Figure 2, this indicates that chelerythrine chloride induces cell death in a TSC2-dependent manner. Chelerythrine also induced PARP cleavage in TSC2-null ELT-V3 cells but not in TSC2-expressing ELT-T3 cells, further confirming the TSC2-dependence of chelerythrine’s effects (Figure 3B). To determine whether chelerythrine chloride impacts the mTORC1 signaling pathway, Tsc2-null and Tsc2+/+ MEFs were treated with DMSO or chelerythrine chloride (2 uM) for 2 hours (Figure 3C). Chelerythrine chloride treatment induced PARP cleavage, as expected. Chelerythrine chloride did not inhibit the phosphorylation of p70-S6K or ribosomal protein S6, suggesting that its primary mechanism of action does not involve mTORC1 inhibition. Chelerythrine chloride blocked the phosphorylation of Akt (S473) and induced cleavage of p62/sequestosome 1, a signaling adaptor and autophagy substrate that is essential for the in vivo growth of TSC2-deficient cells (6).
Figure 3. Chelerythrine chloride induces TSC2-dependent cell death.
A) Immunoblot analysis of Tsc2+/+ and Tsc2−/− MEFs treated with chelerythrine chloride (2 uM, 2h) or paroxetine (10 uM, 2 h). B) Immunoblot analysis of ELT3-T3 (TSC2-expressing) and ELT-V3 (TSC2-null) cells treated with chelerythrine chloride (6 uM, 3 h). C) Immunoblot of Tsc2+/+ and Tsc2−/− MEFs treated with chelerythrine chloride (2 uM, 2 h).
Chelerythrine chloride activates EGFR-MEK-ERK signaling in TSC2-null cells, but this is not required for induction of cell death
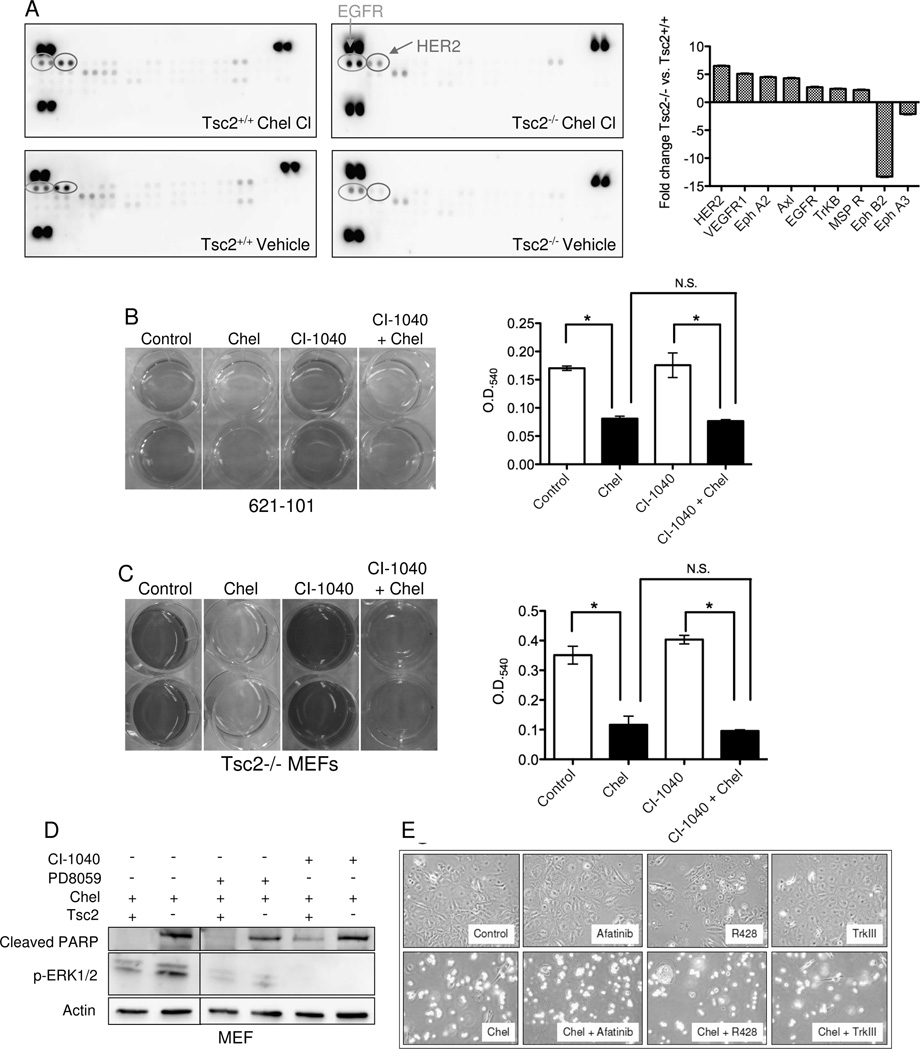
To identify signaling pathways that are altered in TSC2-null cells treated with chelerythrine chloride, Tsc2-null and Tsc2+/+ MEFs were treated with chelerythrine chloride for 1 hour and lysates were applied to a phospho-receptor tyrosine kinase array. Phospho-EGFR (2.7 fold) and phospho-HER2 (6.5-fold) were among most differentially upregulated phospho-proteins in chelerythrine-treated Tsc2-null MEFS compared with chelerythrine-treated Tsc2+/+ MEFs after normalization to vehicle control (Figure 4A). These findings are consistent with prior work showing that chelerythrine-induced apoptosis is mediated by the MEK-ERK pathway in osteosarcoma-derived cells (21).
Figure 4. Chelerythrine chloride induces EGFR and HER2 signaling in Tsc2-null cells.
A) Phospho-receptor tyrosine kinase array of Tsc2−/− and Tsc2+/+ MEFs treated with 1 uM chelerythrine chloride for 1h. The bar graph shows densitometric analysis of relative changes in chelerythrine-treated Tsc2−/− vs. Tsc2+/+ cells after normalization to vehicle control. B, C) 621-101 cells and Tsc2−/− MEFs were pretreated with the MEK inhibitor CI-1040 (1 uM) for 16 hours followed by the addition of 5 uM chelerythrine chloride (621-101) or 2 uM chelerythrine (MEFs) for 2 hours. Cell proliferation was measured by crystal violet staining. MEK inhibition did not block the chelerythrine-induced effects in either cell type. (D) Immunoblot analysis of Tsc2+/+ and Tsc2−/− MEFs pretreated with the ERK inhibitor PD98059 (50 uM) or the MEK inhibitor CI-1040 (1 uM) for 16 hours followed by chelerythrine chloride (1 uM) for 3 hours. E) Phase contrast images (4X) of Tsc2-null MEFs treated with chelerythrine chloride (2 uM) and/or the EGFR inhibitor Afatinib (300 nM), the Axl inhibitor R428 (300 nM), or the Trk-beta inhibitor TrkIII (300 nM). Inhibitors were chosen based on results from panel A. Images were captured 24 hours post addition of chelerythine.
To determine whether induction of MEK signaling mediates chelerythrine’s TSC2-dependent effects, 621-101 cells and Tsc2-null MEFs were treated with chelerythrine chloride with or without pre-treatment with the MEK inhibitor CI-1040 (1 uM). CI-1040 pretreatment did not abrogate the effects of chelerythrine chloride in 621-101 cells or Tsc2-null MEFs (Figures 4B, C). Furthermore, neither CI-1040 or PD98059 was sufficient to prevent chelerythrine chloride-induced PARP cleavage (Figure 4D), despite inhibiting the phosphorylation of ERK (Figure S2), suggesting that the effects of chelerythrine are MEK-independent, in contrast to prior work in osteosarcoma-derived cells in which chelerythrine-induced apoptosis is mediated by the MEK-ERK pathway (21). Based on the kinases that were most upregulated on the phospho-kinase array, we tested the EGFR/HER2 inhibitor Afatinib, the Axl inhibitor R428, and the Trk-beta inhibitor TrkIII. None of these agents was sufficient to protect Tsc2-null cells from chelerythrine chloride-induced death (Figure 4E).
Chelerythrine chloride-induced decrease in glutathione levels is required for cell death induction in TSC2-null cells
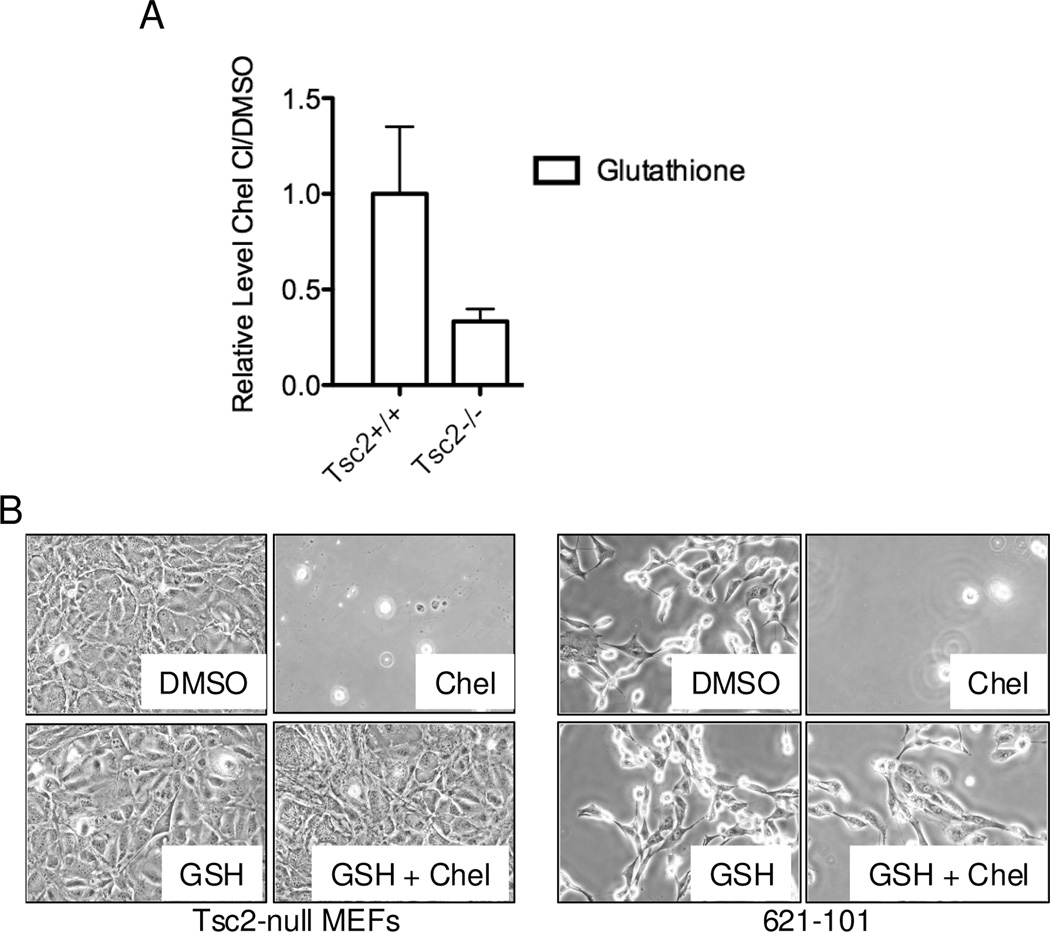
To further investigate chelerythrine’s chloride mechanism of action in TSC2-null cells, we performed steady state metabolite analysis of Tsc2−/− and Tsc2+/+ MEFs treated with chelerythrine chloride (1 uM) for 4 hours. Interestingly, glutathione (GSH) was the second most decreased metabolite when comparing Tsc2-null treated cells to Tsc2+/+ treated cells (Figure 5A); only 6-phosphogluconate showed a higher fold reduction. To determine whether this reduction in glutathione is required for chelerythrine chloride-induced death, we treated cells with chelerythrine chloride, GSH, or a both chelerythrine and GSH (Figure 5B). GSH abrogated the chelerythrine chloride-induced cell death in both Tsc2-null MEFs and 621-101 cells, suggesting that glutathione depletion is a critical component of chelerythrine chloride’s mechanism of action in TSC2-null cells.
Figure 5. Selective decrease of glutathione levels is required for chelerythrine chloride-induced death of TSC2-null cells.
A) Metabolomic analysis was performed on Tsc2-null and Tsc2+/+ MEFs treated with vehicle or chelerythrine chloride (1 uM, 4 h, n=3 per condition). Metabolite levels were normalized to vehicle-treated cells. Glutathione and reduced glutathione levels were significantly lower in Tsc2-null MEFs treated with chelerythrine chloride vs. Tsc2+/+ treated MEFs treated with chelerythrine chloride. B) Tsc2-null MEFs and 621-101 cells were treated for 20 hours with DMSO, chelerythrine chloride (2 uM for MEFs or 5 uM for 621-101), glutathione (GSH, 1 mM), or chelerythrine chloride plus GSH. GSH protects both types of TSC2-null cells from chelerythrine chloride-induced death.
Induction of reactive oxygen species (ROS) and necroptosis is necessary for chelerythrine-chloride induced death in Tsc2-null, mTORC1 hyperactive cells
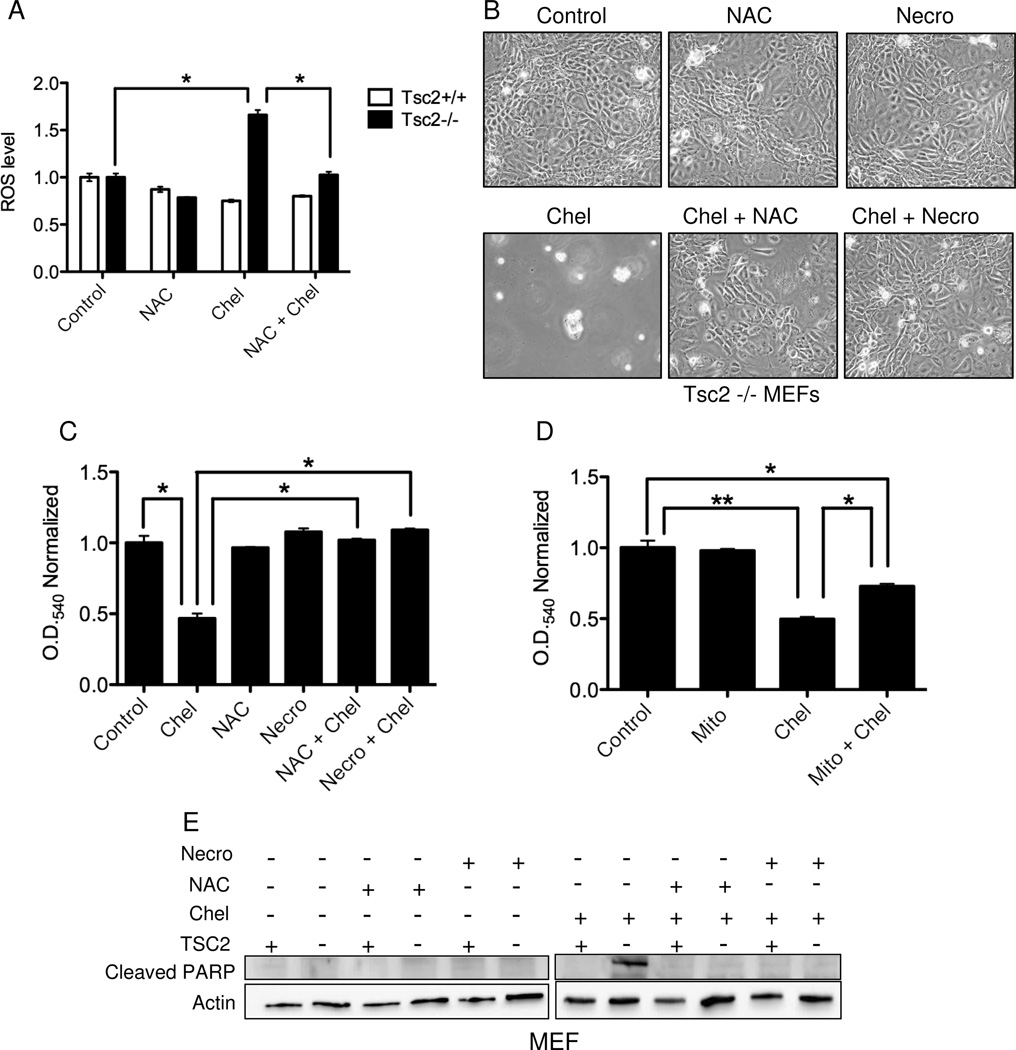
Based on the glutathione results, we hypothesized that chelerythrine selectively induces ROS levels in TSC2-null cells. To test this hypothesis, we used the cell permeant reporter compound 2,7-dichlorofluorescin diacetate (DCFDA). ROS levels at baseline were approximately 1.5 fold higher in the Tsc2−/− MEFs compared to Tsc2+/+ MEFs, consistent with prior findings (24–26). After 20 hours of chelerythrine chloride treatment, ROS levels were further increased in Tsc2-null MEFs by 1.6 fold relative to untreated cells, with no change in Tsc2+/+ MEFs (Figure 6A). Furthermore, N-acetylcysteine (NAC), a ROS scavenger, restored ROS levels to baseline in chelerythrine chloride treated cells, but had no significant impact on ROS levels in Tsc2+/+ cells (Figure 6A).
Figure 6. Induction of reactive oxygen species (ROS) and necroptosis are necessary for chelerythrine chloride induced death in Tsc2-null cells.
A) ROS levels in Tsc2−/− and Tsc2+/+ MEFs treated with 3 uM chelerythrine chloride and/or 2 mM n-acetylcysteine (NAC) for 4 h. ROS levels were normalized to control (vehicle) treated cells. B) Phase contrast analysis of Tsc2-null MEFs treated with chelerythrine chloride (2 uM) and/or NAC (2 mM) or Necrostatin-1 (Necro, 100 uM) for 20 hours. C) Crystal violet analysis of 621-101 cells treated with chelerythrine chloride (5 uM) and/or NAC (2 mM) or Necrostatin-1 (100 uM) for 20 hours (n=4, *p<0.005). D) Crystal violet analysis of Tsc2-null MEFs treated with chelerythrine chloride (2 uM) and/or mitotempo (Mito, 60 uM) for 20 hours (n=4, *p<0.05, **p<0.001). E) Immunoblot analysis of cleaved PARP levels in Tsc2+/+ and Tsc2−/− MEFs treated with chelerythine (2 uM) and/or NAC (2 mM) or Necrostatin-1 (100 uM) for 3 hours.
To determine whether chelerythrine-induced ROS production is necessary for the induction of cell death, Tsc2-null MEFs were treated with the combination of chelerythrine chloride and NAC. NAC was sufficient to protect cells from chelerythrine chloride-induced death (Figure 6B). Intracellular ROS can induce cell death via programmed necrosis, also known as necroptosis (27). Necroptosis is mediated by Receptor-interacting serine/threonine-protein kinase 1 (RIPK1) which interacts with RIPK3 to activate the necrosome (28, 29). To determine whether chelerythrine chloride induces cell death in TSC2-null cells via necroptosis, we used the RIPK1 inhibitor Necrostatin-1 (30). Necrostatin-1 blocked the anti-proliferative effects of chelerythrine chloride in Tsc2-null MEFs (Figure 6B). NAC or necrostatin also protected 621-101 cells from chelerythrine chloride-induced death as measured by crystal violet staining (Figure 6C). To assess the relative contribution of mitochondrial-derived ROS to these phenotypes, we used the mitochondrial ROS scavenger Mito-tempo, which partially rescued the effects of chelerythrine chloride on Tsc2−/− MEFs (Figure 6D).
Finally, to further verify that NAC and Necrostatin-1 protect Tsc2-null cells from chelerythrine chloride-induced death, PARP levels were monitored by immunoblot (Figure 6E). Chelerythrine chloride-induced PARP cleavage selectively in the Tsc2-null cells, as shown earlier. PARP cleavage was prevented by co-treatment with NAC or Necrostatin-1. Based on these data, we conclude that chelerythrine chloride induces TSC2-dependent necroptosis via an ROS-dependent mechanism.
Induction of HO-1 protects Tsc2-null cells from chelerythrine chloride induced cell death
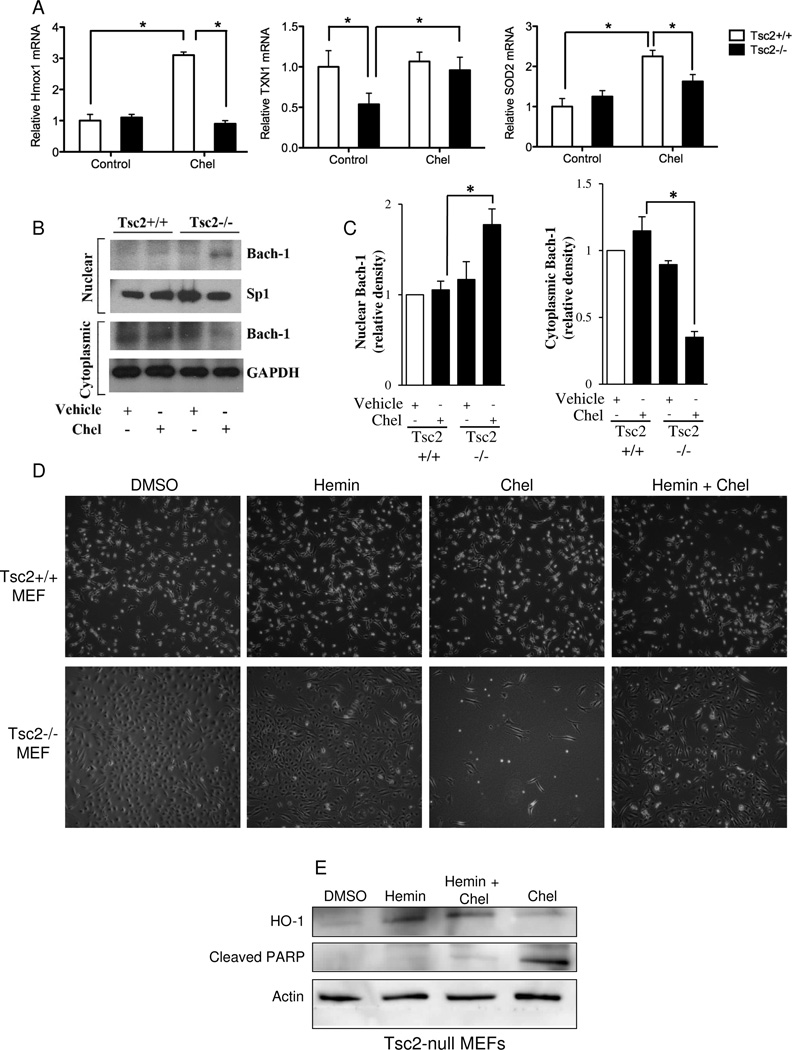
To further investigate the mechanism through which chelerythrine chloride induces ROS-dependent death in Tsc2-null cells, we examined the expression of three antioxidant response genes: heme oxygenase 1 (Hmox1), superoxide dismutase (SOD), and thioredoxin (TXN1). Chelerythrine chloride induced a 3-fold increase in Hmox1 mRNA levels in Tsc2+/+ MEFs, but did not induce Hmox1 in Tsc2-null MEFs (Figure 7A). To better understand the mechanism of this difference between Tsc2+/+ and Tsc2−/− MEFs, we investigated the nuclear and cytoplasmic localization of Bach-1, a negative regulator of HO-1 expression (31–33), in Tsc2+/+ and Tsc2−/− MEFs treated with chelerythrine chloride or vehicle alone. Following treatment, the nuclear and cytoplasmic fractions were isolated. Upon chelerythrine chloride treatment, Bach-1 was increased in the nuclear fraction and reduced in the cytoplasmic fraction of Tsc2−/− MEFs (Figure 7B, C), whereas there was no significant change in Bach-1 levels between the nuclear and cytoplasmic fractions of Tsc2+/+ MEFs upon chelerythrine chloride treatment. These findings suggest that chelerythrine chloride treatment selectively promotes nuclear translocation of Bach-1 in TSC2-null cells, leading to down regulation of Hmox1 and HO-1 expression in TSC2-null cells vs. TSC2-expressing. Consistent with this model, induction of HO-1 using Hemin was sufficient to block chelerythrine chloride-induced death in Tsc2-null MEFs (Figure 7D, E). These results indicate that chelerythrine chloride-induced death in Tsc2-null cells is HO-1 dependent.
Figure 7. Induction of HO-1 is sufficient to rescue Tsc2-null cells from chelerythrine chloride-induced death.
A) Tsc2+/+ and Tsc2−/− MEFs were treated with chelerythrine chloride (2 uM, 2 h). Hmox1, SOD2, and TXN1 levels were measured by quantitative RT-PCR and normalized to beta actin. B) Tsc2+/+ and Tsc2−/− null MEFs were treated with chelerythrine chloride (2µM) or vehicle alone. Cells were harvested after 6 hours, the nuclear and cytoplasmic fractions were isolated from these cells and the expression of Bach-1 was quantified by western blot analysis. Expression of SP-1 and GAPDH were used to assess the purity of the nuclear and cytoplasmic fractions, respectively. C) Densitometry was used to quantitate the results of three independent experiments. *p<0.05, two-sided T-Test. D) Tsc2+/+ and Tsc2−/− MEFs were treated for 20 hours with DMSO or Hemin (10 uM) in replicate cultures; chelerythrine chloride (2 uM, 2 h) was added for the final 2 hr to the indicated wells. Phase contrast images (4X) show rescue of chelerythrine chloride-induced death by Hemin in the Tsc2−/− cells. E) Immunoblot showing induction of HO-1 by Hemin.
Chelerythrine chloride inhibits the progression of Tsc2-null cell xenograft tumors
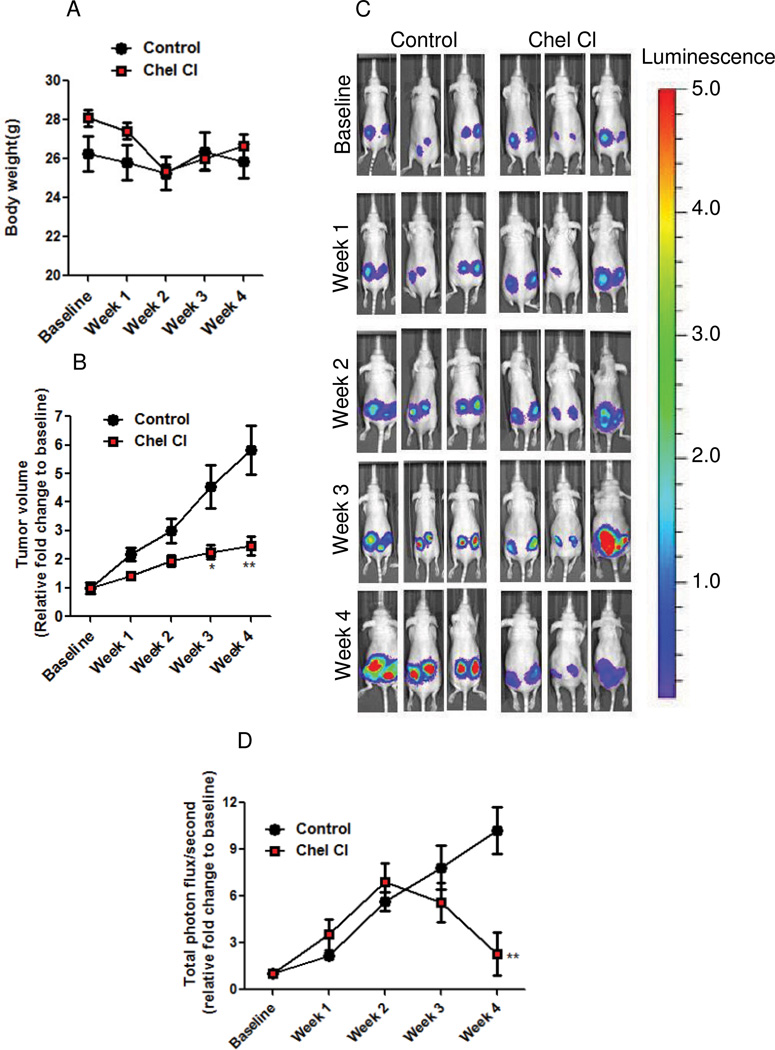
To evaluate the efficacy of chelerythrine chloride in vivo, mice bearing TSC2-null, ELT3-luciferase-expressing xenograft tumors (22) were treated daily with chelerythrine chloride or vehicle control for four weeks. No effect on body weight or other evidence of toxicity was observed (Figure 8A). Chelerythrine chloride significantly reduced tumor volume by 44% at week 3 and 57% week 4, compared with vehicle treatment (Figure 8B). Chelerythrine chloride also significantly decreased the bioluminescence intensity of the xenograft tumors (Figure 8C–D, p<0.05).
Figure 8. Chelerythrine chloride reduces the growth of Tsc2-null xenograft tumors.
Female nude mice were inoculated subcutaneously with ELT3-Luciferase cells. Mice were treated with vehicle control (n = 7) or chelerythrine chloride (n = 9, 10 mg/kg/i.p.) daily for four weeks. A) Body weight was not affected by chelerythrine chloride treatment. B) Tumor volume was calculated weekly using a digital caliper. C) Representative bioluminescent images of chelerythrine chloride and control treated mice. D) Quantification of bioluminescent intensity in xenograft tumors, measured weekly. * p < 0.05, ** p < 0.01.
Discussion
The TSC proteins form a complex that inhibits mTORC1. Rapamycin and its analogs decrease the size of TSC-associated angiomyolipomas and subependymal giant cell astrocytomas and decrease the rate of lung function decline in women with TSC-associated and sporadic LAM. However, Rapalogs only partially decrease tumor size in TSC patients, with most studies demonstrating a 20–40% decrease in tumor volume. Furthermore, continuous therapy is required, since tumors regrow and lung function deteriorates when therapy is discontinued, consistent with the known cytostatic effects of Rapalogs. One strategy to achieve a more durable clinical response in TSC and LAM would be to identify compounds that induce cytocidal effects in TSC2-deficient cells. To achieve this goal, we screened 6,700 compounds in patient-derived TSC2-deficient cells in the presence and absence of Rapamycin. We focused on agents that are antagonized by Rapamycin because they are predicted to be selective for cells with mTORC1 hyperactivation and may therefore represent a step toward single-agent cytocidal therapeutic strategies for TSC and LAM. Thirty-two compounds exhibited at least two-fold Rapamycin antagonism (i.e. at least two-fold lower ATP levels when the drug was used alone vs. in combination with Rapamycin). The top two hits were chelerythrine chloride and paroxetine, both of which selectively inhibited the proliferation of TSC2-deficient cells when compared with TSC2-expressing cells. Chelerythrine chloride, a benzophenanthridine alkaloid, induced cell death in TSC2-deficient cells, thereby achieving the major goal of the screen: to identify compounds that induce a selective cytocidal effect in TSC2-deficient cells.
To identify the mechanisms through which chelerythrine chloride impacts cells with hyperactive mTORC1, we performed a kinase array and found that chelerythrine chloride induced the phosphorylation of multiple kinases (including EGFR, Her2, Axl, and TrK-beta) more strongly in TSC2-deficient vs. TSC2-expressing cells, after normalization for baseline differences in phosphorylation in vehicle treated cells. However, inhibition of these kinases was not sufficient to block chelerythrine chloride induced death. Metabolite profiling revealed a selective decrease in glutathione levels after chelerythrine treatment of TSC2-null cells when compared with TSC2-expressing cells. Glutathione was sufficient to block chelerythrine chloride induced death, indicating that oxidative stress pathways are essential to chelerythrine’s selectivity for TSC2-null cells. NAC and hemin, which induces heme oxygenase 1 (HO-1), also blocked chelerythrine chloride-induced cell death, further supporting a model in which ROS induction by chelerythrine chloride is required for its cytocidal effects on TSC2-deficient cells. In vivo, chelerythrine inhibited the growth of TSC2-deficient cells with no evidence of toxicity. Therefore, our screen for Rapamycin antagonists has identified chelerythrine chloride as a novel potential single agent therapeutic strategy for TSC and LAM that acts via a TSC2-dependent and ROS-dependent mechanism.
The TSC proteins have been previously shown to participate in the regulation of ROS levels via multiple mechanisms. Rheb localizes to the mitochondrial outer membrane where it promotes mitophagy in growth conditions that favor oxidative phosphorylation (34), leading us to hypothesize that mitochondria are the source of the increased ROS induced by chelerythrine chloride. However, the mitochondrial ROS scavenger, mito-tempo, only partially blocked chelerythrine chloride induced cell death, in contrast to NAC which completely blocked cell death, suggesting that both mitochondrial and non-mitochondrial sources of ROS contribute to chelerythrine chloride induced cell death. The peroxisome, to which the TSC protein complex was recently found to localize (35), may represent another source of chelerythrine-induced ROS. The TSC proteins also regulate the cellular response to ROS. Regulation of T cell quiescence is regulated by ROS levels in a TSC-dependent manner (24, 36) and ataxia-telangiectasia mutated (ATM) signals to TSC2 to regulate mTORC1 in response to ROS (37, 38).
ROS can activate RIP1 and RIP3 kinase, which are components of the necrosome. We found that chelerythrine chloride-induced cell death is abrogated by co-treatment with Necrostatin-1, an inhibitor of RIP1 kinase. mTOR inhibition has been linked to imbalances in ROS leading to necroptosis in a renal cell carcinoma cell line (39), but this is the first time that the necrosome has been linked to TSC. Further work will be required to determine whether TSC2-deficient cells are hypersensitive to necroptosis induced by other stimuli.
While we chose to focus on chelerythrine chloride because it induced apoptosis, it is remarkable that our screen identified four Selective Serotonin Reuptake Inhibitors (SSRIs) with at least 2-fold Rapamycin antagonism, including paroxetine, the second strongest Rapamycin-antagonist based on fold change. SSRIs have been previously shown to exert anti-proliferative effects in tumor cells, including Burkitt’s lymphoma (40, 41), but to our knowledge no prior links to the mTOR signaling pathway have been identified. Unexpectedly, four of the other top hits were also psychoactive drugs. We speculate that the strikingly high proportion of neuroactive agents identified in the screen reflects the cell-of-origin origin of angiomyolipomas, from which the cell line used in the screen, was derived. While the cell-of-origin of angiomyolipomas is unknown, it is speculated that angiomyolipomas and LAM arise from the neural crest lineage because they express many neural crest lineage markers including the majority of melanoma-associated antigens (2). The fact that these neuroactive agents are Rapamycin-antagonists may reflect fundamental effects of the TSC complex on cellular differentiation, consistent with previous work demonstrating that the TSC proteins regulate Notch-dependent cell fate decisions in the Drosophila external sensory organ and in mammalian cells (42, 43).
In summary, we report the results of a high throughput screen for molecules that are antagonized by Rapamycin. The top hit, chelerythrine chloride, acts via a novel oxidative stress-dependent mechanism to selectively induce necroptosis in TSC2-deficient cells. Our data provide proof-of-concept that the consequences of mTORC1 hyperactivity can be therapeutically targeted by a single agent, without the use of a Rapalog, to generate a cytocidal response. We hypothesize that compounds that induce cell death in TSC2-deficient cells will lead to more complete and durable clinical responses when compared with Rapalogs, with substantial clinical benefit for patients with TSC and LAM and for potentially also patients with sporadic malignancies harboring mutations in the TSC genes, including bladder cancer and renal cell carcinoma.
Supplementary Material
Implications.
This study demonstrates that TSC2-deficient tumor cells are hypersensitive to oxidative stress-dependent cell death, and provide critical proof-of-concept that TSC2-deficient cells can be therapeutically targeted without the use of a Rapalog to induce a cell death response.
Acknowledgements
The authors thank Doug Flood, Stewart Rudnicki, and Caroline Shamu at the ICCB-Longwood, Harvard Medical School, for their invaluable assistance with the design of the high-throughput screen.
Footnotes
Conflict of Interest: The authors disclose no potential conflicts of interest.
References
- 1.Crino PB, Nathanson KL, Henske EP. The tuberous sclerosis complex. N Engl J Med. 2006;355(13):1345–1356. doi: 10.1056/NEJMra055323. [DOI] [PubMed] [Google Scholar]
- 2.Henske EP, McCormack FX. Lymphangioleiomyomatosis - a wolf in sheep's clothing. J Clin Invest. 2012;122(11):3807–3816. doi: 10.1172/JCI58709. PMCID: 3484429. [DOI] [PMC free article] [PubMed] [Google Scholar]
- 3.Huang J, Manning BD. A complex interplay between Akt, TSC2 and the two mTOR complexes. Biochem Soc Trans. 2009;37(Pt 1):217–222. doi: 10.1042/BST0370217. PMCID: 2778026. [DOI] [PMC free article] [PubMed] [Google Scholar]
- 4.Ma XM, Blenis J. Molecular mechanisms of mTOR-mediated translational control. Nat Rev Mol Cell Biol. 2009;10(5):307–318. doi: 10.1038/nrm2672. [DOI] [PubMed] [Google Scholar]
- 5.Laplante M, Sabatini DM. mTOR signaling in growth control and disease. Cell. 2012;149(2):274–293. doi: 10.1016/j.cell.2012.03.017. PMCID: 3331679. [DOI] [PMC free article] [PubMed] [Google Scholar]
- 6.Parkhitko A, Myachina F, Morrison TA, Hindi KM, Auricchio N, Karbowniczek M, Wu JJ, Finkel T, Kwiatkowski DJ, Yu JJ, Henske EP. Tumorigenesis in tuberous sclerosis complex is autophagy and p62/sequestosome 1 (SQSTM1)-dependent. Proc Natl Acad Sci U S A. 2011;108(30):12455–12460. doi: 10.1073/pnas.1104361108. PMCID: 3145704. [DOI] [PMC free article] [PubMed] [Google Scholar]
- 7.Choo AY, Yoon SO, Kim SG, Roux PP, Blenis J. Rapamycin differentially inhibits S6Ks and 4E-BP1 to mediate cell-type-specific repression of mRNA translation. Proc Natl Acad Sci U S A. 2008;105(45):17414–17419. doi: 10.1073/pnas.0809136105. PMCID: 2582304. [DOI] [PMC free article] [PubMed] [Google Scholar]
- 8.Sarbassov DD, Ali SM, Kim DH, Guertin DA, Latek RR, Erdjument-Bromage H, Tempst P, Sabatini DM. Rictor, a novel binding partner of mTOR, defines a rapamycin-insensitive and raptor-independent pathway that regulates the cytoskeleton. Curr Biol. 2004;14(14):1296–1302. doi: 10.1016/j.cub.2004.06.054. [DOI] [PubMed] [Google Scholar]
- 9.McCormack FX, Inoue Y, Moss J, Singer LG, Strange C, Nakata K, Barker AF, Chapman JT, Brantly ML, Stocks JM, Brown KK, Lynch JP, 3rd, Goldberg HJ, Young LR, Kinder BW, Downey GP, Sullivan EJ, Colby TV, McKay RT, Cohen MM, Korbee L, Taveira-DaSilva AM, Lee HS, Krischer JP, Trapnell BC. Efficacy and safety of sirolimus in lymphangioleiomyomatosis. N Engl J Med. 2011;364(17):1595–1606. doi: 10.1056/NEJMoa1100391. PMCID: 3118601. [DOI] [PMC free article] [PubMed] [Google Scholar]
- 10.Bissler JJ, McCormack FX, Young LR, Elwing JM, Chuck G, Leonard JM, Schmithorst VJ, Laor T, Brody AS, Bean J, Salisbury S, Franz DN. Sirolimus for angiomyolipoma in tuberous sclerosis complex or lymphangioleiomyomatosis. N Engl J Med. 2008;358(2):140–151. doi: 10.1056/NEJMoa063564. PMCID: 3398441. [DOI] [PMC free article] [PubMed] [Google Scholar]
- 11.Franz DN, Belousova E, Sparagana S, Bebin EM, Frost M, Kuperman R, Witt O, Kohrman MH, Flamini JR, Wu JY, Curatolo P, de Vries PJ, Whittemore VH, Thiele EA, Ford JP, Shah G, Cauwel H, Lebwohl D, Sahmoud T, Jozwiak S. Efficacy and safety of everolimus for subependymal giant cell astrocytomas associated with tuberous sclerosis complex (EXIST-1): a multicentre, randomised, placebo-controlled phase 3 trial. Lancet. 2013;381(9861):125–132. doi: 10.1016/S0140-6736(12)61134-9. [DOI] [PubMed] [Google Scholar]
- 12.Krueger DA, Care MM, Holland K, Agricola K, Tudor C, Mangeshkar P, Wilson KA, Byars A, Sahmoud T, Franz DN. Everolimus for subependymal giant-cell astrocytomas in tuberous sclerosis. N Engl J Med. 2010;363(19):1801–1811. doi: 10.1056/NEJMoa1001671. [DOI] [PubMed] [Google Scholar]
- 13.Franz DN, Leonard J, Tudor C, Chuck G, Care M, Sethuraman G, Dinopoulos A, Thomas G, Crone KR. Rapamycin causes regression of astrocytomas in tuberous sclerosis complex. Ann Neurol. 2006;59(3):490–498. doi: 10.1002/ana.20784. [DOI] [PubMed] [Google Scholar]
- 14.Yu J, Astrinidis A, Howard S, Henske EP. Estradiol and tamoxifen stimulate LAM-associated angiomyolipoma cell growth and activate both genomic and nongenomic signaling pathways. Am J Physiol Lung Cell Mol Physiol. 2004;286(4):L694–L700. doi: 10.1152/ajplung.00204.2003. [DOI] [PubMed] [Google Scholar]
- 15.Herbert JM, Augereau JM, Gleye J, Maffrand JP. Chelerythrine is a potent and specific inhibitor of protein kinase C. Biochem Biophys Res Commun. 1990;172(3):993–999. doi: 10.1016/0006-291x(90)91544-3. [DOI] [PubMed] [Google Scholar]
- 16.Vogler M, Weber K, Dinsdale D, Schmitz I, Schulze-Osthoff K, Dyer MJ, Cohen GM. Different forms of cell death induced by putative BCL2 inhibitors. Cell Death Differ. 2009;16(7):1030–1039. doi: 10.1038/cdd.2009.48. [DOI] [PubMed] [Google Scholar]
- 17.Wan KF, Chan SL, Sukumaran SK, Lee MC, Yu VC. Chelerythrine induces apoptosis through a Bax/Bak-independent mitochondrial mechanism. J Biol Chem. 2008;283(13):8423–8433. doi: 10.1074/jbc.M707687200. PMCID: 2417179. [DOI] [PMC free article] [PubMed] [Google Scholar]
- 18.Zhang ZF, Guo Y, Zhang JB, Wei XH. Induction of apoptosis by chelerythrine chloride through mitochondrial pathway and Bcl-2 family proteins in human hepatoma SMMC-7721 cell. Arch Pharm Res. 2011;34(5):791–800. doi: 10.1007/s12272-011-0513-5. [DOI] [PubMed] [Google Scholar]
- 19.Yamamoto S, Seta K, Morisco C, Vatner SF, Sadoshima J. Chelerythrine rapidly induces apoptosis through generation of reactive oxygen species in cardiac myocytes. J Mol Cell Cardiol. 2001;33(10):1829–1848. doi: 10.1006/jmcc.2001.1446. [DOI] [PubMed] [Google Scholar]
- 20.Matkar SS, Wrischnik LA, Hellmann-Blumberg U. Production of hydrogen peroxide and redox cycling can explain how sanguinarine and chelerythrine induce rapid apoptosis. Arch Biochem Biophys. 2008;477(1):43–52. doi: 10.1016/j.abb.2008.05.019. [DOI] [PubMed] [Google Scholar]
- 21.Yang R, Piperdi S, Gorlick R. Activation of the RAF/mitogen-activated protein/extracellular signal-regulated kinase kinase/extracellular signal-regulated kinase pathway mediates apoptosis induced by chelerythrine in osteosarcoma. Clin Cancer Res. 2008;14(20):6396–6404. doi: 10.1158/1078-0432.CCR-07-5113. [DOI] [PubMed] [Google Scholar]
- 22.Yu JJ, Robb VA, Morrison TA, Ariazi EA, Karbowniczek M, Astrinidis A, Wang C, Hernandez-Cuebas L, Seeholzer LF, Nicolas E, Hensley H, Jordan VC, Walker CL, Henske EP. Estrogen promotes the survival and pulmonary metastasis of tuberin-null cells. Proc Natl Acad Sci U S A. 2009;106(8):2635–2640. doi: 10.1073/pnas.0810790106. PMCID: 2637277. [DOI] [PMC free article] [PubMed] [Google Scholar]
- 23.Carsillo T, Astrinidis A, Henske EP. Mutations in the tuberous sclerosis complex gene TSC2 are a cause of sporadic pulmonary lymphangioleiomyomatosis. Proc Natl Acad Sci U S A. 2000;97(11):6085–6090. doi: 10.1073/pnas.97.11.6085. PMCID: 18562. [DOI] [PMC free article] [PubMed] [Google Scholar]
- 24.Chen C, Liu Y, Liu R, Ikenoue T, Guan KL, Zheng P. TSC-mTOR maintains quiescence and function of hematopoietic stem cells by repressing mitochondrial biogenesis and reactive oxygen species. J Exp Med. 2008;205(10):2397–2408. doi: 10.1084/jem.20081297. PMCID: 2556783. [DOI] [PMC free article] [PubMed] [Google Scholar]
- 25.Finlay GA, Thannickal VJ, Fanburg BL, Kwiatkowski DJ. Platelet-derived growth factor-induced p42/44 mitogen-activated protein kinase activation and cellular growth is mediated by reactive oxygen species in the absence of TSC2/tuberin. Cancer Res. 2005;65(23):10881–10890. doi: 10.1158/0008-5472.CAN-05-1394. [DOI] [PubMed] [Google Scholar]
- 26.Suzuki T, Das SK, Inoue H, Kazami M, Hino O, Kobayashi T, Yeung RS, Kobayashi K, Tadokoro T, Yamamoto Y. Tuberous sclerosis complex 2 loss-of-function mutation regulates reactive oxygen species production through Rac1 activation. Biochem Biophys Res Commun. 2008;368(1):132–137. doi: 10.1016/j.bbrc.2008.01.077. [DOI] [PubMed] [Google Scholar]
- 27.Vandenabeele P, Galluzzi L, Vanden Berghe T, Kroemer G. Molecular mechanisms of necroptosis: an ordered cellular explosion. Nat Rev Mol Cell Biol. 2010;11(10):700–714. doi: 10.1038/nrm2970. [DOI] [PubMed] [Google Scholar]
- 28.Basit F, Cristofanon S, Fulda S. Obatoclax (GX15-070) triggers necroptosis by promoting the assembly of the necrosome on autophagosomal membranes. Cell Death Differ. 2013;20(9):1161–1173. doi: 10.1038/cdd.2013.45. PMCID: 3741498. [DOI] [PMC free article] [PubMed] [Google Scholar]
- 29.Moriwaki K, Chan FK. RIP3: a molecular switch for necrosis and inflammation. Genes Dev. 2013;27(15):1640–1649. doi: 10.1101/gad.223321.113. PMCID: 3744722. [DOI] [PMC free article] [PubMed] [Google Scholar]
- 30.Degterev A, Maki JL, Yuan J. Activity and specificity of necrostatin-1, small-molecule inhibitor of RIP1 kinase. Cell Death Differ. 2013;20(2):366. doi: 10.1038/cdd.2012.133. PMCID: 3554332. [DOI] [PMC free article] [PubMed] [Google Scholar]
- 31.Balan M, Pal S. A novel CXCR3-B chemokine receptor-induced growth-inhibitory signal in cancer cells is mediated through the regulation of Bach-1 protein and Nrf2 protein nuclear translocation. J Biol Chem. 2014;289(6):3126–3137. doi: 10.1074/jbc.M113.508044. PMCID: 3916518. [DOI] [PMC free article] [PubMed] [Google Scholar]
- 32.Shan Y, Lambrecht RW, Ghaziani T, Donohue SE, Bonkovsky HL. Role of Bach-1 in regulation of heme oxygenase-1 in human liver cells: insights from studies with small interfering RNAS. J Biol Chem. 2004;279(50):51769–51774. doi: 10.1074/jbc.M409463200. [DOI] [PubMed] [Google Scholar]
- 33.Suzuki H, Tashiro S, Sun J, Doi H, Satomi S, Igarashi K. Cadmium induces nuclear export of Bach1, a transcriptional repressor of heme oxygenase-1 gene. J Biol Chem. 2003;278(49):49246–49253. doi: 10.1074/jbc.M306764200. [DOI] [PubMed] [Google Scholar]
- 34.Melser S, Chatelain EH, Lavie J, Mahfouf W, Jose C, Obre E, Goorden S, Priault M, Elgersma Y, Rezvani HR, Rossignol R, Benard G. Rheb regulates mitophagy induced by mitochondrial energetic status. Cell Metab. 2013;17(5):719–730. doi: 10.1016/j.cmet.2013.03.014. [DOI] [PubMed] [Google Scholar]
- 35.Zhang J, Kim J, Alexander A, Cai S, Tripathi DN, Dere R, Tee AR, Tait-Mulder J, Di Nardo A, Han JM, Kwiatkowski E, Dunlop EA, Dodd KM, Folkerth RD, Faust PL, Kastan MB, Sahin M, Walker CL. A tuberous sclerosis complex signalling node at the peroxisome regulates mTORC1 and autophagy in response to ROS. Nat Cell Biol. 2013 doi: 10.1038/ncb2822. [DOI] [PMC free article] [PubMed] [Google Scholar]
- 36.Yang K, Neale G, Green DR, He W, Chi H. The tumor suppressor Tsc1 enforces quiescence of naive T cells to promote immune homeostasis and function. Nat Immunol. 2011;12(9):888–897. doi: 10.1038/ni.2068. PMCID: 3158818. [DOI] [PMC free article] [PubMed] [Google Scholar]
- 37.Tripathi DN, Chowdhury R, Trudel LJ, Tee AR, Slack RS, Walker CL, Wogan GN. Reactive nitrogen species regulate autophagy through ATM-AMPK-TSC2-mediated suppression of mTORC1. Proc Natl Acad Sci U S A. 2013;110(32):E2950–E2957. doi: 10.1073/pnas.1307736110. PMCID: 3740898. [DOI] [PMC free article] [PubMed] [Google Scholar]
- 38.Alexander A, Kim J, Walker CL. ATM engages the TSC2/mTORC1 signaling node to regulate autophagy. Autophagy. 2010;6(5):672–673. doi: 10.4161/auto.6.5.12509. PMCID: 3259740. [DOI] [PMC free article] [PubMed] [Google Scholar]
- 39.Bray K, Mathew R, Lau A, Kamphorst JJ, Fan J, Chen J, Chen HY, Ghavami A, Stein M, DiPaola RS, Zhang D, Rabinowitz JD, White E. Autophagy suppresses RIP kinase-dependent necrosis enabling survival to mTOR inhibition. PLoS One. 2012;7(7):e41831. doi: 10.1371/journal.pone.0041831. PMCID: 3406086. [DOI] [PMC free article] [PubMed] [Google Scholar]
- 40.Schuster C, Fernbach N, Rix U, Superti-Furga G, Holy M, Freissmuth M, Sitte HH, Sexl V. Selective serotonin reuptake inhibitors--a new modality for the treatment of lymphoma/leukaemia? Biochem Pharmacol. 2007;74(9):1424–1435. doi: 10.1016/j.bcp.2007.07.017. [DOI] [PubMed] [Google Scholar]
- 41.Cloonan SM, Williams DC. The antidepressants maprotiline and fluoxetine induce Type II autophagic cell death in drug-resistant Burkitt's lymphoma. Int J Cancer. 2011;128(7):1712–1723. doi: 10.1002/ijc.25477. [DOI] [PubMed] [Google Scholar]
- 42.Karbowniczek M, Zitserman D, Khabibullin D, Hartman T, Yu J, Morrison T, Nicolas E, Squillace R, Roegiers F, Henske EP. The evolutionarily conserved TSC/Rheb pathway activates Notch in tuberous sclerosis complex and Drosophila external sensory organ development. J Clin Invest. 2010;120(1):93–102. doi: 10.1172/JCI40221. PMCID: 2798691. [DOI] [PMC free article] [PubMed] [Google Scholar]
- 43.Ma J, Meng Y, Kwiatkowski DJ, Chen X, Peng H, Sun Q, Zha X, Wang F, Wang Y, Jing Y, Zhang S, Chen R, Wang L, Wu E, Cai G, Malinowska-Kolodziej I, Liao Q, Liu Y, Zhao Y, Xu K, Dai J, Han J, Wu L, Zhao RC, Shen H, Zhang H. Mammalian target of rapamycin regulates murine and human cell differentiation through STAT3/p63/Jagged/Notch cascade. J Clin Invest. 2010;120(1):103–114. doi: 10.1172/JCI37964. PMCID: 2798675. [DOI] [PMC free article] [PubMed] [Google Scholar]
Associated Data
This section collects any data citations, data availability statements, or supplementary materials included in this article.


