

Abstract
Purpose
An external driver-free MRI method for assessment of liver fibrosis offers a promising non-invasive tool for diagnosis and monitoring of liver disease. Lately, the heart’s intrinsic motion and MR tagging have been utilized for the quantification of liver strain. However, MR tagging requires multiple breath-hold acquisitions and substantial post-processing. This work proposes a fast strain-encoded (FSENC) MRI methodology to measure the peak strain (Sp) in the liver’s left lobe, which is in close proximity and caudal to the heart. Additionally, a new method is introduced to measure heart-induced shear wave velocity (SWV) inside the liver.
Methods
Phantom and in-vivo experiments (11 healthy subjects, and 11 patients with liver fibrosis) were conducted. Reproducibility experiments were performed in seven healthy subjects.
Results
Peak liver strain Sp significantly decreased in fibrotic liver compared healthy liver (6.46%±2.27% vs. 12.49%±1.76%, P<0.05). Heart-induced SWV significantly increased in patients compared to healthy subjects (0.15±0.04 m/s vs. 0.63±0.32 m/s, P<0.05). Reproducibility analysis yielded no significant difference in Sp (P=0.47) or SWV (P=0.56).
Conclusion
Accelerated external driver-free noninvasive assessment of left liver lobe strain and shear wave velocity is feasible using strain-encoded MRI. The two measures significantly separate healthy subjects from patients with fibrotic liver.
Keywords: Strain-encoded MRI, SENC, liver stiffness, fibrosis, liver motion
INTRODUCTION
Liver cirrhosis is one of the leading causes of death for adults in both high- and low-income countries (1). Liver cirrhosis is the last of the five stages (F0–F4) of fibrosis (F0: no fibrosis, F1: portal fibrosis without septa, F2: few septa, F3: numerous septa without cirrhosis and F4: cirrhosis) according to the METAVIR scoring system (2). Recent research has shown that liver fibrosis is reversible in its early stages (3–5). Although biopsy is the gold standard for determining fibrotic stage, it is subjective to a small local liver sample and may be vulnerable to different pathological interpretation (6–10). Moreover, patients in early stages of the disease may be reluctant to undergo an invasive biopsy procedure that may cause complications. Therefore, there is a need for a convenient non-invasive procedure as a screening tool to detect liver fibrosis in early stages and for monitoring disease progression over time.
Conventional non-invasive modalities to measure liver stiffness are ultrasound elastography (USE) (11–14) and magnetic resonance elastography (MRE) (15,16). Transient elastography (TE) or FibroScan (Echosens, Paris, France) is a commercially available ultrasound device that utilizes one-dimensional transient elastography (13). With USE, a one-dimensional ultrasonic transducer generates and transmits shear waves deep into the liver. Shear waves are traced to determine the shear velocity and Young’s modulus of the liver. Although the method was shown to have good accuracy and reproducibility (17) and a typical failure rate of reliable liver stiffness measurement of approximately 5% in lean subjects, the failure rate deteriorates substantially to over 30% in overweight or obese patients who have fatty thoracic belt, which attenuates ultrasonic waves (12,13). Other USE promising techniques that transmit a mechanical pulse into the liver and track its propagation include Acoustic Radiation Force Impulse imaging (ARFI) (18–20), and Shearwave Dispersion Ultrasound Vibrometry (SDUV) (21,22). Similarly, MRE relies on a special external driver (23) to induce mechanical waves through the liver. Phase contrast MR technique is used to image the wave propagation into the liver. The liver’s stiffness can be determined as waves propagate faster in stiff objects than in soft objects; therefore, the wavelength is longer in stiff objects than in soft tissue. However, image quality may be affected by the magnetic field inhomogeneities exacerbated in patients who have iron-overloading in the liver or by the MRE external driver itself. Most importantly, placing the MRE driver may cause discomfort, or may not even be feasible, in patients of large size –especially in regular-bore MRI scanner.
Recently, intrinsic driver MRI techniques have been developed to assess liver fibrosis using cardiac motion as an intrinsic source of motion instead of an external driver (24–26). The techniques rely on analyzing the deformation of MR tags, first introduced by Zerhouni et al.(27) and Axel et al. (28). MR tagging is a noninvasive method that marks the tissue’s magnetization appearing as bright and dark bands throughout the tissue. Previous techniques required multiple slice acquisitions with long breath holds. Gabor filter bank (24) and harmonic phase analysis (24,29) were used to track the deformation of the MR tags in the liver. Manually selected regions of interest below the diaphragm were used to calculate maximum and minimum strain. Stiffness was not reported in either work, but Chung et al. introduced a normalized strain in order to minimize the variability of the myocardial motion. On the other hand, Watanabe et al. (26) manually-selected tagged liver systolic and diastolic images then calculated the bending energy required for deformation as a measure to differentiate fibrotic stage. However, images were acquired during exhaling at constant speed, which requires the patient to be trained before the actual scan.
Fast Strain-Encoded (FSENC) imaging (30) is a faster implementation of the Strain-Encoded (SENC) (31), which measures strain (ε) directly defined as the percentage change in length of the tissue. Initially FSENC was used to image the myocardial as well as to detect stiff masses in a homogeneous phantom (32,33) and in ex-vivo breast tissue (34). In this work, we developed and implemented an accelerated intrinsic driver technique for the assessment of biopsy-proven liver fibrosis using FSENC MRI at 3T and the intrinsic cardiac motion. Unlike other methods that require long scanning time and computationally-demanding post-processing, ours requires one breath hold with minimal post-processing that can be performed on the scanner console. In addition, strain propagation velocity is measured in order to decouple strain measurements from cardiac motion and make stiffness assessment less sensitive to variations in cardiac kinetics between patients.
METHODS
A. Strain Encoding
Strain-Encoded (SENC) MRI was first introduced by Osman et al. in 2001 (31) for imaging the mechanical strain of the myocardium. SENC-MRI directly measures strain (ε) defined as the percentage change in length of the tissue, or mathematically as ε = ΔL/L0, where ΔL is the change of the length, and L0 is the tissue’s initial length before deformation.
FSENC pulse sequence, as shown in Figure 1, generates a sinusoidal magnetization saturation pattern with the tagging spatial frequency (ω0) in the slice selection direction by applying two 90° pulses with a gradient GTag in the slice selection direction. To enable reduced field of view (FOV) acquisition without fold-over artifacts localized tagging pulses were utilized using cylindrical excitation (35). As the tissue stretches due to relaxation, the initial tagging spatial frequency (ω0) shifts to lower z-encoding frequency (ωs) that depends on the tissue’s stretching. To determine this shift, two images, low-tune (IL) and high-tune (IH), are acquired in an interleaved fashion at two different z-encoding frequencies (ωL) and (ωH), respectively.
Figure 1.

Pulse sequence for fast SENC. Tagging consists of two 90° pulses, tagging gradient Gtag is applied in the slice selection direction. Second Tagging pulse is a cylindrical excitation to overcome fold-over artifacts. Interleaved tuning with spiral acquisition is used by alternating the refocusing gradients GLT and GHT. Ramp flip angle is used during imaging to compensate for tag fading. RF: Radio frequency; Sl: slice selection; Ph: phase encoding; Rd: read out.
By combining the two images using the center-of-mass method, the local spatial frequency ωs at a particular pixel p at time t can be calculated as
and local strain can then be quantified as
B. Heart-Induced Shear Wave Velocity
As the heart contracts during systole, the intrinsic cardiac motion interacts with the liver tissue adjacent to the heart-liver surface in the form of stretching as the liver tissue rebounds close the region of impact (ROI) near the heart. The further the anatomical slice is from the heart-liver contact surface, the less affected it is and hence the smaller the peak strain Sp, and the shorter the time to post-stretch relaxation.
The concept of measuring the vibration propagation speed inside a tissue has been commonly utilized as indicative parameter in USE to assess liver fibrosis (11,36). An external probe was used to both transmit a low frequency wave in to the liver and measure the wave propagation speed (13). Similarly, measuring the heart-induced shear velocity through the tissue may be a normalized measurement independent of Sp.
A graphical representation of a hypothetical multi-slice ROI strain-time (s-t) curves throughout the cardiac cycle is shown in Figure 2a. Collectively, these curves construct a 3-dimensional strain(s)-time(t)-depth(z) surface. The figure demonstrates the incremental stretching and displacement of liver tissue during systole to fill in the space previously occupied by the heart followed by liver push-back to its initial position at end- diastole. Figure 2b shows the projection of the strain surface that is attenuated as we move away from the myocardium. The relaxing front of the strain surface is fitted using a plane equation given by as + bt + cz + d = 0, where a, b, c, and d are constants obtained by the linear least square fitting algorithm (broken line segments in Figure 2a). Only the strain values on declining wave front of the strain surface after reaching the peak strain point and before the no-strain plateau are included in the fitting. The strain propagation plane intersects with x-t, t-z, and s-z planes in three lines with slopes representing strain propagation velocity, strain rate, and normalized strain, respectively. Heart-induced shear wave velocity, strain rate, and normalized strain are reported in m/s, ms−1, and mm−1, respectively.
Figure 2.

(a) Simulated strain surface propagating through time and space with the fitted strain propagation plan shown in dotted black lines. (b) Projection of the strain-time-depth (ε-t-z) surface on the time-depth (t-z) plane.
C. Phantom experiments
Three homogenous elastic phantoms were constructed as described in (37) with three different degrees of stiffness; soft, medium, and stiff, to simulate liver elasticity at different stages of fibrosis. Phantoms were composed of water, Agar, and beef gelatin (250 bloom). Phantom’s stiffness was controlled be alternating gelatin concentration as shown in table 1. All phantoms were constructed as cubes with side length of 10 cm.
Table 1.
Phantom composition and the corresponding stiffness
| Phantom Type | Gelatin (g) | Agar (g) | Water (ml) | Stiffness (kPa) |
|---|---|---|---|---|
| Soft | 50 | 10 | 1000 | 2 |
| Medium | 80 | 10 | 1000 | 4 |
| Stiff | 180 | 10 | 1000 | 8 |
An electro-mechanical actuating setup was developed similar to the one described by Harouni et al. (38) to periodically compress the elastic phantom. As shown in Figure 3, a double acting plastic piston compresses a phantom resulting in an adjustable Sp that ranges from 1% to 15%. To obtain the same strain spatial-distribution pattern seen by SENC imaging of the liver and thus mimicking the heart-liver contact, a hard hemi-spherical object (3 cm in diameter) was attached to the moving plate thus creating a localized point of contact between the moving plate and the phantom. The flow of compressed air into the piston is controlled using a control circuit and a four-way solenoid valve placed outside the scanner room. The control circuit also generates a periodic trigger signal, which synchronized the piston’s motion with the triggering of scanner imaging sequence. The hardware was designed to simulate a heart rate of 45 beat-per-minute. The piston’s maximum displacement and speed were controlled by the air pressure driving the pistons. Air pressure was set to 5 PSI in order to obtain moderate force capable of compressing all three phantoms with different degrees of displacements. During the first half of the motion cycle, the compressing piston moves backwards allowing the phantom to stretch thus yielding in a positive strain, while in the second half of the cycle the piston compresses the phantom to initial position.
Figure 3.

Hardware used for phantom experiments. Control circuit generates a trigger signal to synchronize phantom stretching with triggering the scanner imaging sequence. The circuit also controls the direction of compressed air to a double acting piston. Piston moves from position A to position B simulating the myocardium pull-up that leads to the stretching of the liver tissue.
Imaging protocol and parameters were similar to the in vivo experiments described below except for changing the parameters for the FSENC imaging sequence to: field-of-view (FOV) = 220×220 mm2, in-plane resolution of 5×5 mm2, and four contiguous 8 mm-thick slices.
D. In vivo experiments
Twenty two subjects were recruited for this prospective study including 11 healthy subjects with no history of liver disease (three males; mean age 29±8.9 years), Eleven patients (six males; mean age 50±16 years) with known chronic liver disease and liver fibrosis confirmed by liver biopsy (10 patients) or hepatic ultrasound (one patient with cirrhosis). Fibrosis was graded F4 in one patient, F3 in five patients, and F1 in five patients based on the Histology Activity Index (HAI) (39). To test reproducibility of the technique, seven of the healthy subjects were rescanned within a period of one month.
All in-vivo experiments and scanning protocol were reviewed and approved by the local institutional review board and all subjects signed informed consent for participation in this study. MRI scans were performed at a 3T MRI Philips scanner (Achieva, Philips Medical Systems, Best, the Netherlands) using a 32-channel phased array cardiac-abdominal coil. All MRI sequences were breath-hold sequences. In order to localize the motion of the heart-liver interface, a cine coronal steady state free precession (SSFP) dataset was acquired through the heart and liver with the following parameters: TR/TE= 2500/60 ms, FOV= 340×340 mm2, slice thickness= 5 mm, and temporal resolution= 10 ms. Anatomical axial T1-weighted (T1W) and FSENC imaging planes were rotated by 5° to 10° around the sagittal axis in order to be parallel to the heart-liver interface as shown in Figure 4. Multi-slice T1W images were acquired with the following parameters: TR/TE=3.6/1.24 ms, FOV= 340 × 340 mm2, in-plane resolution of 1 × 1 mm2, 20 slices, slice thickness= 5 mm, SENSE acceleration factor= 2. FSENC imaging had the following parameters: TR/TE= 7.5/1.1 ms, FOV= 340×340 mm2, in-plane resolution of 5×5 mm2, seven slices, slice thickness = 9 mm, inter-slice gap= -3 mm between their centers, spiral k-space acquisition window = 6 ms using turbo field echo (TFE) factor of 3, low and high tune images were acquired in an interleaved fashion with ωL = 0.91 mm−1, ωH = 0.97 mm−1, ω0 = 0.96 mm−1. The cine frames were spaced out in time to cover the whole cardiac cycle while keeping the inter-frame temporal resolution as close as possible to 25 ms. FSENC data were acquired every other heartbeat to allow full recovery of the longitudinal magnetization.; thus, for heart rate of 60 beats per minute all seven slices could be acquired in a 14-second breath hold. In order to obtain uniform signal intensity for the liver (T1= 700 ms at 3T) throughout time, ramped flip angles with last flip angle= 30° were used to compensate for the T1 relaxation (40,41).
Figure 4.
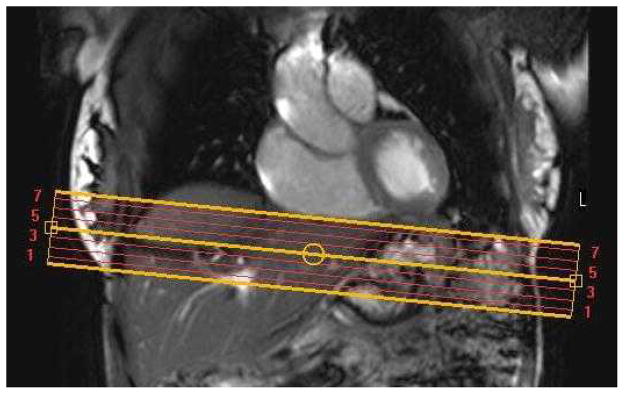
Coronal SSFP image for a healthy subject showing seven axial image planes (yellow line) used for T1-weighted and FSENC images. Axial images are tilted 5 to 10 degrees.
E. Data analysis
Data analysis was performed using in-house software written in Matlab (Mathworks version 7.11). Coronal SSFP images along with T1W images were used to localize slices of liver sections immediately below the myocardium. Through-plane strain was calculated from the fSENC images in each slice throughout the cardiac cycle (31). Imaged slices with peak strain greater than 50% of the peak strain the first slice were included in the SWV wave front analysis. The average strain was calculated in each cine frame in the automatically identified region of impact (ROI). In order to determine the parameters of the ROI, a marker image was generated as the temporal average of the strain maps of the all cine frames acquired during systole. The point of maximum strain in the marker image was chosen as the center of a two-dimensional Gaussian surface to fit the localized strain pattern in the marker image. The Gaussian fit then determines the center of the elliptical ROI as well as the length of major and minor axes, which are set to full width half maximum strain.
Sp and SWV measurements from healthy subjects were compared to those of patients using single tail student t-test and P<0.05 was defined as statistically significant. The correlation between SWV and Sp vs. the degree of fibrosis (Fdeg) was analyzed. In addition, potential correlation between peak-strain and SWV was evaluated using in-group linear regression analysis. To evaluate reproducibility, paired two-tailed student t-test was used to compare peak strain and SWV for repeated exams. Results are expressed as mean ± standard deviation.
RESULTS
A. Phantom Results
Figure 5a shows marker strain images overlaid over T1W images for the three phantoms along with the automatically selected ROI shown in white ellipse. Figure 5b shows strain spatial-temporal maps through the motion cycle and utilizing three slices at 0, 8, and 16 mm away from the piston. Slices closer to the compressing piston showed higher peak strains than the further slices. In the soft phantom, the sections near the piston accrued strain of up to 12.6% while the section 16 mm away from the piston only accrued 8.3% peak strain. Meanwhile, in the stiff phantom peak strains were 8% and 5.5% in the sections closest to and furthest from the piston, respectively. The slope of the solid black lines in Figure 5b represents strain propagation velocity that was higher in stiff (0.5 m/s) than medium (0.42 m/s) and soft phantoms (0.23 m/s). Figure 5c shows strain curves at the closest slice to the piston for the three phantoms throughout the cycle. The soft phantom yielded highest peak strain (12.6%), followed by the medium (11.1%) then the stiff phantoms (8%).
Figure 5.

(a) Marker strain images overlaid over T1W images for soft, medium, and stiff phantoms. (b) The corresponding strain projection through time for the first three slices that were used for SWV calculation at 0, 8, and 16 mm away from the piston (strain propagation velocity is shown in solid black line). Slices deeper (caudal to the heart) than the third slices had substantially faint strain and did not contribute to the wave front. (c) Strain curves throughout time calculated from automatically selected ROI (white ellipses) for soft (solid line), medium (dotted line) and stiff phantoms (gray dotted line).
B. In vivo Results
In vivo scans were completed successfully in all 22 subjects. Figure 6a and b show marker strain images overlaid over T1W images for a healthy subject and a patient, respectively. Figure 6 also shows strain images for three slices at 5, 11, and 17 mm away from the heart for healthy subject and patient. Note that in these particular subjects, the healthy liver demonstrated a positive strain for all slices with peak strains of up to 14%. The fibrotic liver yields lower strain values over all slices with peak strain of 6%.
Figure 6.

Strain color maps overlaid over T1W images for a healthy subject (a) and a patient (b). Marker images (top row) show automatic ROI (white ellipse) selected for analysis. Selected cine frames of three slices at caudal depth 5, 11 and 17 mm away for the heart are shown to demonstrate the peak strain frames at and around end-systole. Due to large amount of date collected, only 3 frames before and after the peak strain time (322 ms and 341ms for a and b respectively) are shown in the figure.
Figure 7a shows the spatial-temporal strain surface constructed from seven slices of a healthy subject throughout cardiac systole period. Black broken lines represent the fitted strain propagation plan. Figure 7b,c show strain curves from different slices and their corresponding projection, Figure 7d,e, throughout the cardiac cycle for a healthy subject and a patient, respectively.
Figure 7.

(a) Spatial-temporal strain surface constructed from seven slices of a healthy subject throughout time. Dotted black lines represent the fitted strain propagation plan. Strain curves for adjacent slices for healthy subject (b) and chronic patient (c) with corresponding projection of strain curves for strain curves healthy subject (d) and chronic patient (e). The slope of black line represents the strain propagation velocity.
Sp was significantly higher in healthy subjects; 12.49%±1.76% (range 8.45%-14.88%), compared to that in fibrotic liver; 6.46±2.27 (range 2.3%-10.3%), (P<0.01) as shown in Figure 8a. SWV was significantly higher in fibrotic patients 0.63±0.32m/s (range 0.16–1.05m/s) compared to 0.15±0.04m/s (range 0.08–0.22 m/s) in healthy subjects, (P<0.01) as shown in Figure 8b. Both Sp and SWV were significantly correlated with the degree of fibrosis. Correlation coefficient for Sp vs. Fdeg was -0.79 (CI:-0.89 to -0.60, P<0.05) and for SWV vs. Fdeg was 0.54 (CI: 0.23 to 0.76, P<0.05). Linear regression analysis shows no relationship between peak-strain and SWV measurements in the control group (R2=0.04, P=0.36) and in the patient group (R2=0.12, P=0.28). Bland-Altman plots are shown in Figure 9 with mean Sp difference and SWV difference between two measurements are 0.28% ±1.62% and 0.01±0.12 m/s, respectively. Two tailed paired student t-test showed no significant difference between repeated peak-strain measurements (P=0.47) or SWV measurements (P=0.56) for healthy subjects.
Figure 8.

Box plots showing peak strain (top) and SWV (bottom) for all healthy subjects and patients.
Figure 9.

Bland-Altman plots of the repeated measurements of peak-strain (top) and SWV (bottom).
DISCUSSION
In this work, we presented a fast external driver-free non-invasive imaging technique to asses liver stiffness using a FSENC MRI protocol at 3T. Unlike liver biopsy that is invasive, restricted to a small sample size, and has low patient acceptance. FSENC relies on the myocardium motion to induce motion and strain into the liver; hence, does not require any external devices required by traditional USE and MRE protocols. The proposed protocol requires only one breath hold and does not require complicated post processing computations. This speed of acquisition and analysis allows stiffness assessment to be performed on-site during the scanning session since colored strain images can be readily displayed at the scanner console immediately following the acquisition (33). Hence, the protocol may show to be beneficial for fast screening of patients. Like other T1-weighted tagged MRI sequences, FSENC is less affected by iron depositions found in the liver, which affects phase images used by MRE (42). Our results showed significant difference between peak strain measured for healthy subjects and patients with known liver disease; we have also showed that FSENC measurements are highly reproducible in healthy subjects. FSENC strain measurements ranged between -3% and 17%, which agrees with values recently published (25) conventional tagged MRI. The negative strain is the remnant contraction that may be attributed to non-ideal situations when the first frame is not acquired at the time when the liver is most-pressed or due to the potential anatomical slice through-plane motion. As FSENC is more suitable for assessing the liver’s left lobe stiffness, it could be used to complement traditional MRE, which assesses the liver’s right lobe stiffness since left lobe is far away from the external vibrator thus results in low quality phase images.
In addition to the proposed accelerated strain measurement, this study is the first to measure heart-induced SWV, which is another tissue property that is sensitive to stiffening and may add additional sensitivity to fibrosis and less dependence on cardiac motion. However, validating these hypotheses requires a larger and more extensive study. The apparent SWV in healthy subjects was in the range of 0.15 m/s. This is substantially lower than the reported SWV of 1.2 m/s using ARFI or FibroScan techniques with an external ultrasound pulsar (43). However, SWV depends on the frequency of the shear wave and declines substantially at pushing pulse frequencies below 200 Hz (21,44,45). ARFI and SDUV techniques utilize extremely short ultrasound pulses at frequencies in the KHz and MHz range and duration while FibroScan uses 50 Hz pulser. The actuating force by the heart to generate SWV has a main frequency around 1 Hz and a duration that is in the range of 200 msec. This is the primary frequency that largely determines the SWV in the proposed technique. In principle, higher frequency components might exist in the FSENC data due to transient heart motion. Even though such acoustic heart tones giving rise to a propagating shear wave in the left liver lobe can easily approach 50 Hz, which is in the FibroScan range, these wave components would be secondary and too faint to pick up with our technique. These factors and the limited temporal and spatial imaging resolution all attribute to the reduction of the perceived apparent SWV.
This study has some limitations: First, our population size was relatively small with a few patients. However, the size was sufficient to demonstrate proof of concept in human subjects. Second, limitation is inherent in the SENC technique itself as it only measures through-plan strain while strain is a three-dimensional (3D) tensor. Since we are only interested in the main component where the rebounding of the liver during heart contraction, this limitation may be minimized with careful planning. Third, the method presented is not slice-following therefore there is a through-motion artifact as we are not always imaging the same tissue throughout the cardiac cycle. We preferred to use non-slice-following SENC with higher SNR since average strain is 10% and at most 1 mm of tissue is different throughout the cardiac cycle. Fourth, the measurements are localized to the liver region near the heart. This limitation exists as well in other mechanisms including liver biopsy, which are considered the non-invasive reference standard. The left lobe is out of reach from the external actuators especially in obese patients, and hence the right lobe measurement is used a surrogate. Other points to consider is that in diffused diseases, in which all the liver is affected, a localized measurement is usually considered as representing the whole liver in clinical practice. Additionally, the presented technique is not intended as a replacement of other advanced assessment techniques such as FibroScan, SDUV, or ARFI. Yet, our hypothesis is that intrinsically induced MR parameters such as Sp and SWV may show to be an effective method to detect hepatic fibrosis. This may, therefore, be valuable as an initial screening tool since this technique can be easily embedded within a typical clinical liver MRI protocol adding only a few seconds need for a single breathhold to the MR exam. Meanwhile, the sensitivity of the technique to suboptimal orientation and to subtle fibrosis remains to be investigated. Finally, the coupling fact between the myocardium health and the strain measured at the liver is a limitation of all intrinsic driver methods as previously noted (25). To decouple this dependency, Mannelli et al. (24) introduced a cardiac-corrected strain gradient. Meanwhile, Chung et al. (25) introduced normalized strain (measured in mm−1) defined as strain measured inside the liver divided by the maximum local displacement at the liver-heart interface. In this work and in addition to strain measurement, we introduced a new methodology to calculate heart-induced SWV in m/s through the liver’s tissue as a potential surrogate of liver’s stiffness. While peak-strain is directly associated with the force exerted by the heart, SWV is more associated with the elasticity of the liver. Regression analysis of peak-strain association with SWV shows weak statistically insignificant correlation suggesting that the two variables are independent of each others. However, the sample size in this proof-of-concept study was limited and thus may have weakened the statistical power to the correlation analysis. Further larger studies needed to investigate the true value of SWV in assessment of liver stiffness.
Future improvements may include increasing temporal resolution in order to capture the strain pull-up slope as the myocardium is contracting, which could lead to measuring the shear velocity of the propagating wave that is independent of the myocardium force. SWV wave front plane was computed with linear least square-fitting algorithm using a pool of strain points on the strain surface along caudal depth and time dimensions. This method for measuring the shear wave speed values is an introductory approach for this MRI technique. Further studies would be valuable as recent SWV literature suggests more advanced methods for fitting the wave front plane (46–48). These algorithms may be considered as alternatives to improve wave front plane fitting accuracy. Other 3D displacement encoding techniques (49–52) may be utilized for quantification of 3D principle strains, SWV, and other higher order mechanics, albeit at the cost of longer acquisition and computation time. Also we may consider using slice following FSENC to overcome the through plan motion artifacts, however –as all slice following techniques– this would lead to lower SNR as the images slice is larger than tagged slice. Further work is needed to determine the sensitivity of SENC as an early liver fibroses detector; study should include large patient population with different fibrotic stages.
CONCLUSION
A new accelerated, external driver-free, and noninvasive method to assess the stiffness of the left liver lobe using fast strain-encoded MRI was developed at 3T. We presented two measures (peak strain and shear wave velocity) that significantly separate healthy subjects from patients with fibrotic liver diseases. Our method is easy to implement since it relies on the cardiac induced motion to deform the liver with no external device. Thus, it would be immediately implemented on conventional MRI systems. Moreover since it only requires one breath-hold, it could be simply added to routine liver MR scans as a fibrosis assessment sequence. This could have significant impact on patient care.
References
- 1.Mathers CD, Salomon JA, Ezzati M, Begg S, Hoorn SV, Lopez AD. Sensitivity and Uncertainty Analyses for Burden of Disease and Risk Factor Estimates. In: Lopez AD, Mathers CD, Ezzati M, Jamison DT, Murray CJL, editors. Global Burden of Disease and Risk Factors. Washington (DC): 2006. [PubMed] [Google Scholar]
- 2.Intraobserver and interobserver variations in liver biopsy interpretation in patients with chronic hepatitis C. The French METAVIR Cooperative Study Group. Hepatology. 1994;20(1 Pt 1):15–20. [PubMed] [Google Scholar]
- 3.Dufour JF, DeLellis R, Kaplan MM. Reversibility of hepatic fibrosis in autoimmune hepatitis. Annals of internal medicine. 1997;127(11):981–985. doi: 10.7326/0003-4819-127-11-199712010-00006. [DOI] [PubMed] [Google Scholar]
- 4.Friedman SL, Bansal MB. Reversal of hepatic fibrosis -- fact or fantasy? Hepatology. 2006;43(2 Suppl 1):S82–88. doi: 10.1002/hep.20974. [DOI] [PubMed] [Google Scholar]
- 5.Bonis PA, Friedman SL, Kaplan MM. Is liver fibrosis reversible? The New England journal of medicine. 2001;344(6):452–454. doi: 10.1056/NEJM200102083440610. [DOI] [PubMed] [Google Scholar]
- 6.Regev A, Berho M, Jeffers LJ, Milikowski C, Molina EG, Pyrsopoulos NT, Feng ZZ, Reddy KR, Schiff ER. Sampling error and intraobserver variation in liver biopsy in patients with chronic HCV infection. The American journal of gastroenterology. 2002;97(10):2614–2618. doi: 10.1111/j.1572-0241.2002.06038.x. [DOI] [PubMed] [Google Scholar]
- 7.Bedossa P, Dargere D, Paradis V. Sampling variability of liver fibrosis in chronic hepatitis C. Hepatology. 2003;38(6):1449–1457. doi: 10.1016/j.hep.2003.09.022. [DOI] [PubMed] [Google Scholar]
- 8.group TFMcs. Intraobserver and interobserver variations in liver biopsy interpretation in patients with chronic hepatitis C. The French METAVIR Cooperative Study Group. Hepatology. 1994;20(1 Pt 1):15–20. [PubMed] [Google Scholar]
- 9.Ratziu V, Charlotte F, Heurtier A, Gombert S, Giral P, Bruckert E, Grimaldi A, Capron F, Poynard T. Sampling variability of liver biopsy in nonalcoholic fatty liver disease. Gastroenterology. 2005;128(7):1898–1906. doi: 10.1053/j.gastro.2005.03.084. [DOI] [PubMed] [Google Scholar]
- 10.Vuppalanchi R, Unalp A, Van Natta ML, Cummings OW, Sandrasegaran KE, Hameed T, Tonascia J, Chalasani N. Effects of liver biopsy sample length and number of readings on sampling variability in nonalcoholic Fatty liver disease. Clinical gastroenterology and hepatology : the official clinical practice journal of the American Gastroenterological Association. 2009;7(4):481–486. doi: 10.1016/j.cgh.2008.12.015. [DOI] [PMC free article] [PubMed] [Google Scholar]
- 11.Andersen ES, Christensen PB, Weis N. Transient elastography for liver fibrosis diagnosis. European journal of internal medicine. 2009;20(4):339–342. doi: 10.1016/j.ejim.2008.09.020. [DOI] [PubMed] [Google Scholar]
- 12.Roulot D, Czernichow S, Le Clesiau H, Costes JL, Vergnaud AC, Beaugrand M. Liver stiffness values in apparently healthy subjects: influence of gender and metabolic syndrome. Journal of hepatology. 2008;48(4):606–613. doi: 10.1016/j.jhep.2007.11.020. [DOI] [PubMed] [Google Scholar]
- 13.de Ledinghen V, Vergniol J. Transient elastography (FibroScan) Gastroenterologie clinique et biologique. 2008;32(6 Suppl 1):58–67. doi: 10.1016/S0399-8320(08)73994-0. [DOI] [PubMed] [Google Scholar]
- 14.Colli A, Pozzoni P, Berzuini A, Gerosa A, Canovi C, Molteni EE, Barbarini M, Bonino F, Prati D. Decompensated chronic heart failure: increased liver stiffness measured by means of transient elastography. Radiology. 2010;257(3):872–878. doi: 10.1148/radiol.10100013. [DOI] [PubMed] [Google Scholar]
- 15.Manduca A, Oliphant TE, Dresner MA, Mahowald JL, Kruse SA, Amromin E, Felmlee JP, Greenleaf JF, Ehman RL. Magnetic resonance elastography: non-invasive mapping of tissue elasticity. Medical image analysis. 2001;5(4):237–254. doi: 10.1016/s1361-8415(00)00039-6. [DOI] [PubMed] [Google Scholar]
- 16.Rouviere O, Yin M, Dresner MA, Rossman PJ, Burgart LJ, Fidler JL, Ehman RL. MR elastography of the liver: preliminary results. Radiology. 2006;240(2):440–448. doi: 10.1148/radiol.2402050606. [DOI] [PubMed] [Google Scholar]
- 17.Sandrin L, Fourquet B, Hasquenoph JM, Yon S, Fournier C, Mal F, Christidis C, Ziol M, Poulet B, Kazemi F, Beaugrand M, Palau R. Transient elastography: a new noninvasive method for assessment of hepatic fibrosis. Ultrasound Med Biol. 2003;29(12):1705–1713. doi: 10.1016/j.ultrasmedbio.2003.07.001. [DOI] [PubMed] [Google Scholar]
- 18.Nightingale K, Soo MS, Nightingale R, Trahey G. Acoustic radiation force impulse imaging: in vivo demonstration of clinical feasibility. Ultrasound Med Biol. 2002;28(2):227–235. doi: 10.1016/s0301-5629(01)00499-9. [DOI] [PubMed] [Google Scholar]
- 19.Yap WW, Kirke R, Yoshida EM, Owen D, Harris AC. Non-invasive assessment of liver fibrosis using ARFI with pathological correlation, a prospective study. Ann Hepatol. 2013;12(4):608–615. [PubMed] [Google Scholar]
- 20.Friedrich-Rust M, Wunder K, Kriener S, Sotoudeh F, Richter S, Bojunga J, Herrmann E, Poynard T, Dietrich CF, Vermehren J, Zeuzem S, Sarrazin C. Liver fibrosis in viral hepatitis: noninvasive assessment with acoustic radiation force impulse imaging versus transient elastography. Radiology. 2009;252(2):595–604. doi: 10.1148/radiol.2523081928. [DOI] [PubMed] [Google Scholar]
- 21.Chen S, Urban MW, Pislaru C, Kinnick R, Zheng Y, Yao A, Greenleaf JF. Shearwave dispersion ultrasound vibrometry (SDUV) for measuring tissue elasticity and viscosity. IEEE Trans Ultrason Ferroelectr Freq Control. 2009;56(1):55–62. doi: 10.1109/TUFFC.2009.1005. [DOI] [PMC free article] [PubMed] [Google Scholar]
- 22.Urban MW, Chen S, Fatemi M. A Review of Shearwave Dispersion Ultrasound Vibrometry (SDUV) and its Applications. Curr Med Imaging Rev. 2012;8(1):27–36. doi: 10.2174/157340512799220625. [DOI] [PMC free article] [PubMed] [Google Scholar]
- 23.Tse ZT, Janssen H, Hamed A, Ristic M, Young I, Lamperth M. Magnetic resonance elastography hardware design: a survey. Proceedings of the Institution of Mechanical Engineers Part H, Journal of engineering in medicine. 2009;223(4):497–514. doi: 10.1243/09544119JEIM529. [DOI] [PubMed] [Google Scholar]
- 24.Mannelli L, Wilson GJ, Dubinsky TJ, Potter CA, Bhargava P, Cuevas C, Linnau KF, Kolokythas O, Gunn ML, Maki JH. Assessment of the liver strain among cirrhotic and normal livers using tagged MRI. J Magn Reson Imaging. 2012;36(6):1490–1495. doi: 10.1002/jmri.23743. [DOI] [PubMed] [Google Scholar]
- 25.Chung S, Breton E, Mannelli L, Axel L. Liver stiffness assessment by tagged MRI of cardiac-induced liver motion. Magnetic resonance in medicine : official journal of the Society of Magnetic Resonance in Medicine / Society of Magnetic Resonance in Medicine. 2011;65(4):949–955. doi: 10.1002/mrm.22785. [DOI] [PMC free article] [PubMed] [Google Scholar]
- 26.Watanabe H, Kanematsu M, Kitagawa T, Suzuki Y, Kondo H, Goshima S, Kajita K, Bae KT, Hirose Y, Miotani S, Zhou X, Fujita H. MR elastography of the liver at 3 T with cine-tagging and bending energy analysis: preliminary results. European radiology. 2010;20(10):2381–2389. doi: 10.1007/s00330-010-1800-0. [DOI] [PubMed] [Google Scholar]
- 27.Zerhouni EA, Parish DM, Rogers WJ, Yang A, Shapiro EP. Human heart: tagging with MR imaging--a method for noninvasive assessment of myocardial motion. Radiology. 1988;169(1):59–63. doi: 10.1148/radiology.169.1.3420283. [DOI] [PubMed] [Google Scholar]
- 28.Axel L, Dougherty L. Heart wall motion: improved method of spatial modulation of magnetization for MR imaging. Radiology. 1989;172(2):349–350. doi: 10.1148/radiology.172.2.2748813. [DOI] [PubMed] [Google Scholar]
- 29.Osman NF, Kerwin WS, McVeigh ER, Prince JL. Cardiac motion tracking using CINE harmonic phase (HARP) magnetic resonance imaging. Magnetic resonance in medicine : official journal of the Society of Magnetic Resonance in Medicine / Society of Magnetic Resonance in Medicine. 1999;42(6):1048–1060. doi: 10.1002/(sici)1522-2594(199912)42:6<1048::aid-mrm9>3.0.co;2-m. [DOI] [PMC free article] [PubMed] [Google Scholar]
- 30.Pan L, Stuber M, Kraitchman DL, Fritzges DL, Gilson WD, Osman NF. Real-time imaging of regional myocardial function using fast-SENC. Magnetic resonance in medicine : official journal of the Society of Magnetic Resonance in Medicine / Society of Magnetic Resonance in Medicine. 2006;55(2):386–395. doi: 10.1002/mrm.20770. [DOI] [PubMed] [Google Scholar]
- 31.Osman NF, Sampath S, Atalar E, Prince JL. Imaging longitudinal cardiac strain on short-axis images using strain-encoded MRI. Magnetic resonance in medicine : official journal of the Society of Magnetic Resonance in Medicine / Society of Magnetic Resonance in Medicine. 2001;46(2):324–334. doi: 10.1002/mrm.1195. [DOI] [PubMed] [Google Scholar]
- 32.Osman NF. Detecting stiff masses using strain-encoded (SENC) imaging. Magnetic resonance in medicine : official journal of the Society of Magnetic Resonance in Medicine / Society of Magnetic Resonance in Medicine. 2003;49(3):605–608. doi: 10.1002/mrm.10376. [DOI] [PubMed] [Google Scholar]
- 33.Harouni AA, Jacobs MA, Osman NF. Finding the optimal compression level for strain-encoded (SENC) breast MRI; simulations and phantom experiments. Medical image computing and computer-assisted intervention : MICCAI International Conference on Medical Image Computing and Computer-Assisted Intervention. 2011;14(Pt 1):444–451. doi: 10.1007/978-3-642-23623-5_56. [DOI] [PubMed] [Google Scholar]
- 34.Haruoni AA, Hossain J, El Khouli R, Matsuda KM, Bluemke DA, Osman NF, Jacobs MA. Strain-encoded breast MRI in phantom and ex vivo specimens with histological validation: Preliminary results. Medical Physics. 2012;39(12):7710. doi: 10.1118/1.4749963. [DOI] [PMC free article] [PubMed] [Google Scholar]
- 35.Fischer SE, McKinnon GC, Scheidegger MB, Prins W, Meier D, Boesiger P. True myocardial motion tracking. Magnetic resonance in medicine : official journal of the Society of Magnetic Resonance in Medicine / Society of Magnetic Resonance in Medicine. 1994;31(4):401–413. doi: 10.1002/mrm.1910310409. [DOI] [PubMed] [Google Scholar]
- 36.Foucher J, Chanteloup E, Vergniol J, Castera L, Le Bail B, Adhoute X, Bertet J, Couzigou P, de Ledinghen V. Diagnosis of cirrhosis by transient elastography (FibroScan): a prospective study. Gut. 2006;55(3):403–408. doi: 10.1136/gut.2005.069153. [DOI] [PMC free article] [PubMed] [Google Scholar]
- 37.Oudry J, Chen J, Glaser KJ, Miette V, Sandrin L, Ehman RL. Cross-validation of magnetic resonance elastography and ultrasound-based transient elastography: a preliminary phantom study. Journal of magnetic resonance imaging : JMRI. 2009;30(5):1145–1150. doi: 10.1002/jmri.21929. [DOI] [PMC free article] [PubMed] [Google Scholar]
- 38.Harouni AA, Hossain J, Jacobs MA, Osman NF. Improved hardware for higher spatial resolution strain-encoded (SENC) breast MRI for strain measurements. Academic radiology. 2011;18(6):705–715. doi: 10.1016/j.acra.2011.01.006. [DOI] [PMC free article] [PubMed] [Google Scholar]
- 39.Knodell RG, Ishak KG, Black WC, Chen TS, Craig R, Kaplowitz N, Kiernan TW, Wollman J. Formulation and application of a numerical scoring system for assessing histological activity in asymptomatic chronic active hepatitis. Hepatology. 1981;1(5):431–435. doi: 10.1002/hep.1840010511. [DOI] [PubMed] [Google Scholar]
- 40.Fischer SE, McKinnon GC, Maier SE, Boesiger P. Improved myocardial tagging contrast. Magnetic resonance in medicine : official journal of the Society of Magnetic Resonance in Medicine / Society of Magnetic Resonance in Medicine. 1993;30(2):191–200. doi: 10.1002/mrm.1910300207. [DOI] [PubMed] [Google Scholar]
- 41.Stuber M, Spiegel MA, Fischer SE, Scheidegger MB, Danias PG, Pedersen EM, Boesiger P. Single breath-hold slice-following CSPAMM myocardial tagging. MAGMA. 1999;9(1–2):85–91. doi: 10.1007/BF02634597. [DOI] [PubMed] [Google Scholar]
- 42.Rump J, Klatt D, Braun J, Warmuth C, Sack I. Fractional encoding of harmonic motions in MR elastography. Magn Reson Med. 2007;57(2):388–395. doi: 10.1002/mrm.21152. [DOI] [PubMed] [Google Scholar]
- 43.Yoneda M, Suzuki K, Kato S, Fujita K, Nozaki Y, Hosono K, Saito S, Nakajima A. Nonalcoholic fatty liver disease: US-based acoustic radiation force impulse elastography. Radiology. 2010;256(2):640–647. doi: 10.1148/radiol.10091662. [DOI] [PubMed] [Google Scholar]
- 44.Nenadic IZ, Urban MW, Bernal M, Greenleaf JF. Phase velocities and attenuations of shear, Lamb, and Rayleigh waves in plate-like tissues submerged in a fluid (L) J Acoust Soc Am. 2011;130(6):3549–3552. doi: 10.1121/1.3654029. [DOI] [PMC free article] [PubMed] [Google Scholar]
- 45.Chen K, Yao A, Zheng EE, Lin J, Zheng Y. Shear wave dispersion ultrasound vibrometry based on a different mechanical model for soft tissue characterization. J Ultrasound Med. 2012;31(12):2001–2011. doi: 10.7863/jum.2012.31.12.2001. [DOI] [PubMed] [Google Scholar]
- 46.Wang M, Byram B, Palmeri M, Rouze N, Nightingale K. On the precision of time-of-flight shear wave speed estimation in homogeneous soft solids: initial results using a matrix array transducer. IEEE Trans Ultrason Ferroelectr Freq Control. 2013;60(4):758–770. doi: 10.1109/TUFFC.2013.2624. [DOI] [PMC free article] [PubMed] [Google Scholar]
- 47.Rouze NC, Wang MH, Palmeri ML, Nightingale KR. Robust estimation of time-of-flight shear wave speed using a radon sum transformation. IEEE Trans Ultrason Ferroelectr Freq Control. 2010;57(12):2662–2670. doi: 10.1109/TUFFC.2010.1740. [DOI] [PMC free article] [PubMed] [Google Scholar]
- 48.Wang MH, Palmeri ML, Rotemberg VM, Rouze NC, Nightingale KR. Improving the robustness of time-of-flight based shear wave speed reconstruction methods using RANSAC in human liver in vivo. Ultrasound Med Biol. 2010;36(5):802–813. doi: 10.1016/j.ultrasmedbio.2010.02.007. [DOI] [PMC free article] [PubMed] [Google Scholar]
- 49.Abd-Elmoniem KZ, Stuber M, Prince JL. Direct three-dimensional myocardial strain tensor quantification and tracking using zHARP. Med Image Anal. 2008;12(6):778–786. doi: 10.1016/j.media.2008.03.008. [DOI] [PMC free article] [PubMed] [Google Scholar]
- 50.Abd-Elmoniem KZ, Osman NF, Prince JL, Stuber M. Three-dimensional magnetic resonance myocardial motion tracking from a single image plane. Magn Reson Med. 2007;58(1):92–102. doi: 10.1002/mrm.21267. [DOI] [PubMed] [Google Scholar]
- 51.Ryf S, Spiegel MA, Gerber M, Boesiger P. Myocardial tagging with 3D-CSPAMM. J Magn Reson Imaging. 2002;16(3):320–325. doi: 10.1002/jmri.10145. [DOI] [PubMed] [Google Scholar]
- 52.Kim D, Gilson WD, Kramer CM, Epstein FH. Myocardial tissue tracking with two-dimensional cine displacement-encoded MR imaging: development and initial evaluation. Radiology. 2004;230(3):862–871. doi: 10.1148/radiol.2303021213. [DOI] [PubMed] [Google Scholar]