Abstract
Objective
The objective of the present study was to elucidate the interactive roles of guanylyl cyclase/natriuretic peptide receptor-A (NPRA) gene (Npr1) and salt diets on cardiac angiotensin II (ANG II), aldosterone and proinflammatory cytokines levels in Npr1 gene-targeted (1-copy, 2-copy, 3-copy, 4-copy) mice.
Methods
Npr1 genotypes included 1-copy gene-disrupted heterozygous (+/−), 2-copy wild-type (+/+), 3-copy gene-duplicated heterozygous (++/+) and 4-copy gene-duplicated homozygous (++/++) mice. Animals were fed low, normal and high-salt diets. Plasma and cardiac levels of ANG II, aldosterone and pro-inflammatory cytokines were determined.
Results
With a high-salt diet, cardiac ANG II levels were increased (+) in 1-copy mice (13.7 ± 2.8 fmol/mg protein, 111%) compared with 2-copy mice (6.5 ± 0.6), but decreased (−) in 4-copy (4.0 ± 0.5, 38%) mice. Cardiac aldosterone levels were increased (+) in 1-copy mice (80 ± 4 fmol/mg protein, 79%) compared with 2-copy mice (38 ± 3). Plasma tumour necrosis factor alpha was increased (+) in 1-copy mice (30.27 ± 2.32 pg/ml, 38%), compared with 2-copy mice (19.36 ± 2.49, 24%), but decreased (−) in 3-copy (11.59 ± 1.51, 12%) and 4-copy (7.13 ± 0.52, 22%) mice. Plasma interleukin (IL)-6 and IL-1α levels were also significantly increased (+) in 1-copy compared with 2-copy mice but decreased (−) in 3-copy and 4-copy mice.
Conclusion
These results demonstrate that a high-salt diet aggravates cardiac ANG II, aldosterone and proinflammatory cytokine levels in Npr1 gene-disrupted 1-copy mice, whereas, in Npr1 gene-duplicated (3-copy and 4-copy) mice, high salt did not render such elevation, suggesting the potential roles of Npr1 against salt loading.
Keywords: aldosterone, angiotensin II, arterial pressure, atrial natriuretic peptide, gene duplication, gene knockout, pro-inflammatory cytokines, salt diet
INTRODUCTION
The natriuretic peptides comprise at least three ligands: atrial natriuretic peptide (ANP), brain natriuretic peptide (BNP) and C-type natriuretic peptide [1] (CNP) [2,3]. ANP and BNP are mainly released from the heart [3], whereas CNP is produced in endothelial cells [2,4]. Three distinct natriuretic peptide receptors have been identified and characterized by molecular cloning; these include natriuretic peptide receptor-A (NPRA), natriuretic peptide receptor-B (NPRB) and natriuretic peptide receptor-C (NPRC) [4–7]. ANP and BNP bind to NPRA, a membrane-bound form of guanylyl cyclase, which is termed as guanylyl cyclase-A (GC-A)/NPRA [5,6,8]. CNP binds to NPRB, which is also a membrane guanylyl cyclase and is known as GC-A/NPRB [8]. All three natriuretic peptides bind to NPRC, which lacks guanylyl cyclase activity [5,8]. The ligand binding to NPRA increases the intracellular second-messenger cyclic GMP (cGMP) concentrations by enhanced guanylyl cyclase activity [4,9–12]. The major functions of ANP-NPRA signalling include natriuretic, diuretic, vasodilatory [2,4,11,13,14], antifibrotic and antihypertrophic effects [8,15–17]. The Npr1 (coding for GC-A/NPRA) has been found to lower arterial pressure and to increase guanylyl cyclase activity in a gene dose-dependent manner [13,18]. Previous studies [13,15,18–24] have suggested the important functions of NPRA signalling in cardiac hypertrophy and arterial blood pressure regulation. The interaction of salt sensitivity with ANP/NPRA system in the development of hypertension, cardiac hypertrophy and inflammatory responses is incompletely understood. A high-salt diet contributes to the pathogenesis of hypertension, which is recognized as a multifactorial trait resulting from the effects of a combination of both environmental and genetic factors [25–28]. Disruption of Npr1 gene leads to hypertension and cardiac hypertrophy in null mutant mice [13,15]. Similarly, ANP homozygous null mutant (Nppa−/−) mice also show exaggerated cardiac hypertrophy and elevated blood pressures [15]. Sodium overload has been shown to be linked with essential hypertension, eliciting cardiac remodelling [29–32].
Aldosterone plays an important role in electrolyte transport and exerts direct effects on cardiac hypertrophy and heart failure by binding to mineralocorticoid receptors in the heart and blood vessels [33–35]. In addition, mineralocorticoid receptor antagonism has been shown to reverse myocardial and aortic fibrosis caused by aldosterone [36,37]. In humans, aldosterone has been shown to exert direct adverse effects on the heart that are independent of its effects on arterial pressure [38]. In patients with severe heart failure, the use of a mineralocorticoid receptor antagonist has been found to reduce morbidity and mortality by 30% [38]. Such studies clearly demonstrated the importance of aldosterone in cardiac hypertrophy and arterial blood pressure regulation. ANP inhibits aldosterone synthesis in cultured neonatal rat cardiomyocytes [39] and the adrenal glands [40,41]. The inhibitory effect of ANP on aldosterone synthesis should depend on the functionally active catalytic domain of NPRA [42]. As NPRA signalling counteracts the renin–angiotensin–aldosterone system (RAAS) [43–45], we tested the hypothesis that whether the cardiac angiotensin II (ANG II) and aldosterone levels are increased in Npr1 gene-disrupted mice, but decreased in Npr1 gene-duplicated mice, in a gene dose-dependent manner. We determined the effect of low-salt or high-salt diets on cardiac ANG II, aldosterone and pro-inflammatory cytokine levels in Npr1 gene-targeted (gene-knockout and gene-duplicated) mice having varying gene copy numbers. The part of our ongoing studies has previously reported the adrenal ANG II and aldosterone levels in Npr1 gene-targeted mice [43]. In the present communication, we report the further results of additional findings on the status of cardiac ANG II, aldosterone and pro-inflammatory cytokines in these genetically altered Npr1 mouse models.
MATERIALS AND METHODS
Generation of Npr1 gene-targeted mice
Npr1 gene-targeted (gene-knockout and gene-duplication) mice were generated by homologous recombination as previously described [8,13]. Animals were generated from correctly targeted embryonic stem cells as previously described [46]. F1 gene-knockout heterozygous animals were identified by Southern blot and PCR analysis of DNA extracted from tail biopsies as previously reported [14,15]. Gene-duplicated homozygous and heterozygous mice were identified by Massachusetts Institute of Technology (MIT) markers analysis using primers D3MIT40 and D3MIT101 [47]. All mice were female littermate progenies of the C57/BL6 genetic background. Mice were bred in the Animal Care Facility at the Tulane University Health Sciences Center. The following are the mice genotypes: 1-copy (+/−) is a gene-disrupted heterozygous mice; 2-copy (+/+) is a wild-type mice; 3-copy (++/+) is a gene-duplicated heterozygous mice; and 4-copy (++/++) is a gene-duplicated homozygous mice as previously reported [38]. Animals were maintained in a 12 :12-h light–dark cycle (0600 to 1800 h) at 25°C. During the 3-week study period, 24- to 28-week-old female mice were given a low-salt (0.05% NaCl), a normal salt (0.3% NaCl) or a high-salt (8% NaCl) diet and tap water ad libitum as previously reported [43]. In the present studies, the survival of animals was as follow: low-salt diet (1-copy, 97%; 2-copy, 97%; 3-copy 100%; 4-copy, 100%), normal salt diet (1-copy, 94%; 2-copy, 91%; 3-copy 97%; 4-copy, 100%) and high-salt diet (1-copy, 84%; 2-copy, 94%; 3-copy 100; 4-copy, 100%). In the present studies, the major limitation was encountered to obtain the sufficient number of Npr1 gene-disrupted homozygous null mutant (−/−; 0-copy) mice. Approximately, 25% Npr1 0-copy null mutant pups die after 1–2 days of birth. It has also been observed that some unborn pups die in utero just before the birth. Above all, approximately, 30% of the adult 0-copy mice die after 6 months of age due to congestive heart failure. Consequently, the adult 0-copy homozygous null mutant mice colonies are significantly reduced as compared with heterozygous (1-copy) and wild-type (2-copy) mice colonies. Thus, due to a low number of adult 0-copy mice colonies, we could not include these animals in the present studies. All protocols were approved by the Institutional Animal Care and Use Committee at Tulane University Health Sciences Center.
Arterial pressure measurement
The arterial pressure of Npr1 mice was measured every other day by the noninvasive computerized tail-cuff method, using a Visitech BP2000 (Visitech Systems Inc., Apex, North Carolina, USA) as previously described [48]. After 7 days of training of the mice for arterial pressure measurement, an average arterial pressure level of five sessions per day was calculated for the analysis.
Urine and urinary sodium and potassium measurements
After the first 3 days adaptation in metabolic cage, mice were provided with a low-salt, a normal salt or a high-salt diet, respectively, for a 3-week periods. Urine was collected and urine volumes were recorded every other day and kept at −20°C until used. Urinary sodium and potassium were measured using Flame Photometer IL973 (Instrumentation Laboratory, Lexington, Massachusetts, USA). Urine outputs, urinary sodium and potassium excretions per day were normalized by kidney weight.
Blood and tissue collection
After mice had been anaesthetized with CO2, blood was collected by cardiac puncture in a tube containing 10µl 0.25 mol/l EDTA as previously reported [43]. The blood was centrifuged and the separated plasma was kept at −80°C until used. Hearts were removed and blood exuded from them, after which the hearts were weighed, frozen in liquid nitrogen and kept at −80°C until used. The body weight and tibia length of each mouse was measured for normalization of heart weight.
Cardiac angiotensin II assay
Frozen heart tissues were rinsed and homogenized in 10 mmol/l pyrophosphate buffer containing 100 mmol/l NaCl, 1 mmol/l phenylmelthylsulfonylfluoride (PMSF) and 1 mmol/l EDTA with a Polytron (Brinkmann Instruments, Westbury, New York, USA) at a setting of 10 (three times for 30 s) at 4°C as previously described [49]. The homogenate was centrifuged at 40 000g for 40 min at 4°C. The protein concentration of the heart extract was determined using a protein assay reagent (BioRad, Hercules, California, USA) for normalization and assay of cardiac ANG II levels. The extraction and assay of ANG II was performed as previously described [43].
Cardiac aldosterone assay
Frozen heart tissues were rinsed in phosphate buffer and homogenized as described above for ANG II assay. Aldosterone levels in tissue extract and plasma were assayed using a radioimmunoassay kit (Diagnostic System, Webster, Texas, USA) according to the manufacturer’s protocol as previously described [21,43]. The assay of aldosterone indicated 100% cross-reactivity; however, corticosterone showed only 0.02% cross-reactivity and all other steroids were undetectable.
Plasma cyclic GMP assay
Blood samples were collected in tubes containing EDTA and immediately centrifuged at 2500 rpm for 10 min at 4°C. The plasma was separated and stored at −80°C until used. The plasma cGMP levels were assayed using a direct cGMP enzyme-linked immunoassay kit (Assay Designs, Ann Arbor, Michigan, USA), according to the manufacturer’s protocol.
Assay of pro-inflammatory and cytokines in plasma and heart tissues
The concentration of pro-inflammatory cytokines, including tumour necrosis factor-alpha (TNF-α), interleukin-6 (IL-6), interleukin-1 alpha (IL-1α) and interleukin-1 beta (IL-1β), was measured in plasma and heart tissues by multiplex bead array format (Millipore, Billerica, Massachusetts, USA), using a Bio-Plex instrument (Bio-Rad) according to the manufacturer’s guidelines. Spectrally addressed polystyrene beads coated with cytokine-specific monoclonal antibodies were used to capture the cytokines of interest. The instrument sorted out and measured the fluorescent signal from each bead by dual excitation sources.
Statistical analysis
Statistical analyses were performed by two-way analysis of variance (ANOVA) combined with Bonferroni’s multiple comparison posthoc test, using the GraphPad PRISM program (version 4.0; GraphPad Software, San Diego, California, USA). Due to the nonnormality of some of the data, we also performed the nonparametric statistical analysis using Kruskal–Wallis test to confirm the ANOVA analysis. The results are presented as mean ± standard error. Significance was set at a P value of less than 0.05.
RESULTS
Plasma cyclic GMP levels in Npr1 mice fed with different salt diets
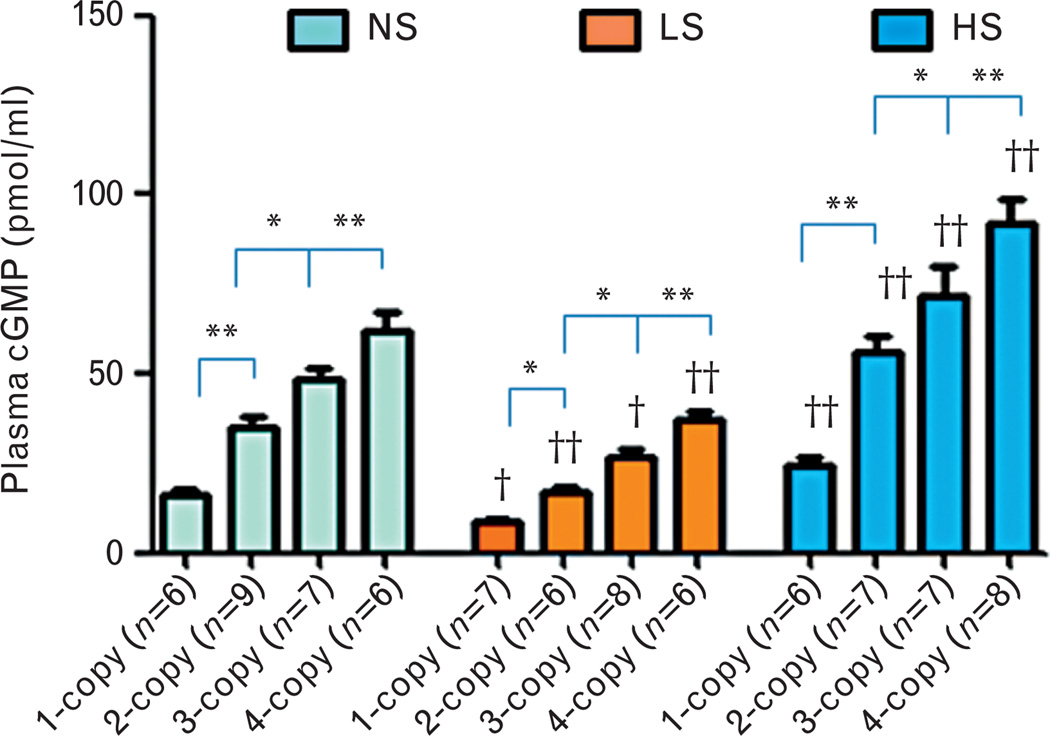
With all three salt diets, the plasma cGMP levels were decreased (−) in 1-copy mice [normal salt: −53% (16.24 ± 1.82, P<0.01); low salt: −48% (8.71 ± 0.63, P<0.05); high salt: −56% (24.53 ± 2.22, P<0.01)] compared with 2-copy mice (Fig. 1). However, with all three salt diets, the plasma cGMP levels were increased (+) in 3-copy mice [normal salt: 40% (48.69 ± 3.02, P<0.05); low salt: 60% (26.75 ± 2.49, P<0.05); high salt: 28% (72.09 ± 7.99, P<0.05)] and 4-copy mice [normal salt: 80% (62.01 ± 5.15, P<0.01); low salt: 120% (36.96 ± 2.84, P<0.01); high salt: 64% (91.73 ± 7.08, P<0.01)] compared with 2-copy mice (Fig. 1). We also compared plasma cGMP levels in mice with the same Npr1 gene copy number fed with the different salt diets. The low-salt diet decreased (−) plasma cGMP levels in 1-copy (−46%, P<0.05), 2-copy (−52%, P<0.01), 3-copy (−45%, P<0.05) and 4-copy mice (−40%, P<0.01) compared with plasma cGMP levels in mice given the normal salt diet (Fig. 1). However, with a high-salt diet, plasma cGMP levels were increased (+) in 1-copy (51%, P<0.01), 2-copy (62%, P<0.01), 3-copy (48%, P<0.01) and 4-copy mice (48%, P<0.01) (Fig. 1).
FIGURE 1.
Plasma cyclic GMP levels in Npr1 gene-targeted mice with a normal salt, a low-salt or a high-salt diet: Comparisons were made among mice having different Npr1 genotypes fed the same salt diet: *P<0.05; **P<0.01. Comparisons were also made among mice having the same Npr1 gene copy number fed the different salt diets: †P<0.05; ††P<0.01. Bars indicate the mean ± SE values for the representative genotypes. n = number of mice; cGMP, cyclic GMP; HS, high-salt diet; LS, low-salt diet; NS, normal salt diet.
Effect of salt diets on cardiac angiotensin II and aldosterone levels in Npr1 mice
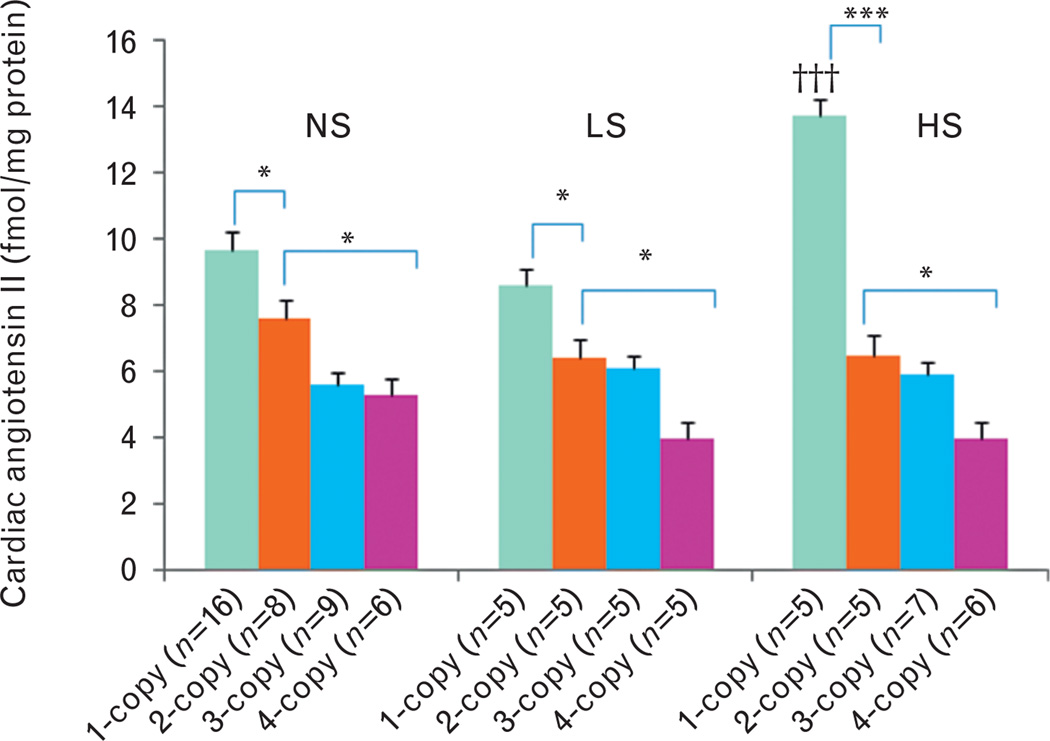
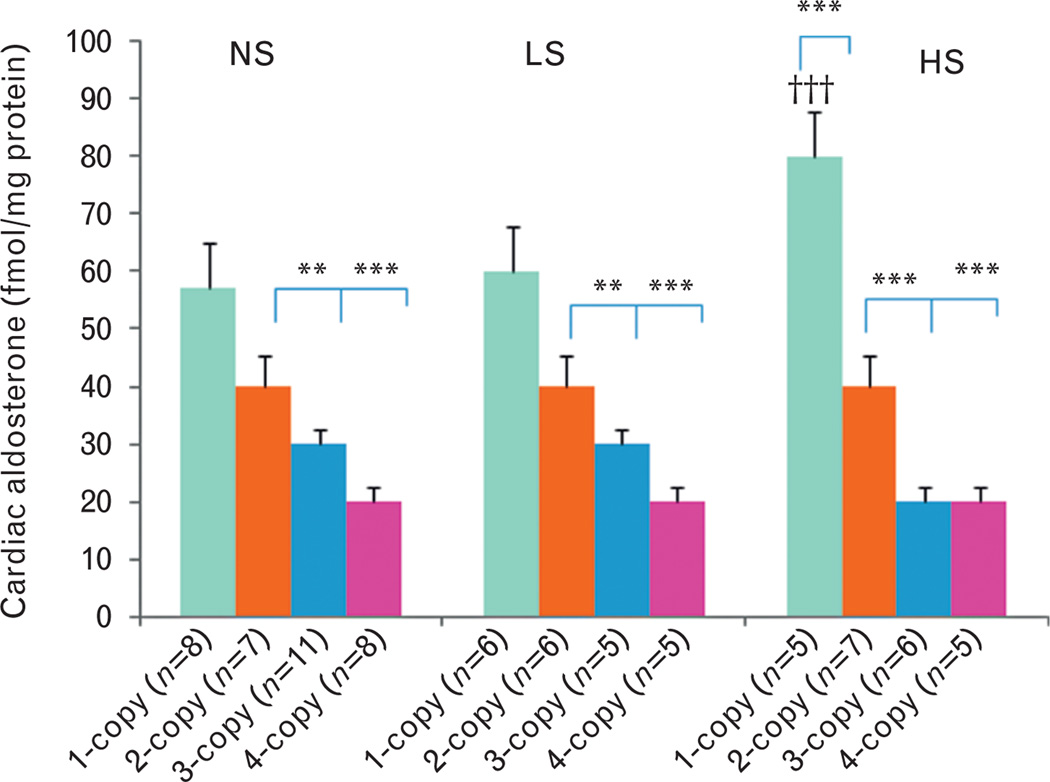
On a normal salt diet, cardiac ANG II levels increased (+) in 1-copy mice (27%, 9.7 ± 0.5, P<0.05) compared with 2-copy mice (7.6 ± 0.7), but decreased (−) in 4-copy mice (31%, 5.3 ± 0.2, P<0.05) (Fig. 2). Similarly, cardiac ALDO levels decreased (−) in 3-copy (33%, 0.03 ± 0.004, P<0.01) and 4-copy mice (55%, 0.02 ± 0.002, P<0.001) fed a normal salt diet as compared with 2-copy mice (0.04 ± 0.003) (Fig. 3). With a low-salt diet, cardiac ANG II levels slightly increased (+) in 1-copy mice (35%, 8.6 ± 0.7) compared with 2-copy mice (6.4 ± 0.4), but slightly decreased (−) in 4-copy (37%, 4.0 ± 0.8) mice (Fig. 2). On the same diet, cardiac aldosterone levels decreased (−) in 3-copy (38%, 0.03 ± 0.004, P<0.01) and 4-copy mice (59%, 0.02 ± 0.003, P<0.001) compared with 2-copy mice (0.04 ± 0.005) (Fig. 3). With a high-salt diet, cardiac ANG II levels increased (+) in 1-copy mice (111%, 13.7 ± 2.8, P<0.001) compared with 2-copy mice (6.5 ± 0.6), but decreased (−) in 4-copy (38%, 4.0 ± 0.5, P>0.05) mice (Fig. 2). Similarly, cardiac aldosterone levels also increased (+) in 1-copy mice (79%, 0.08 ± 0.004, P<0.001) at a high-salt diet compared with 2-copy mice (0.04 ± 0.003), but decreased (−) in 3-copy (43%, 0.02 ± 0.005, P<0.001) and 4-copy mice (61%, 0.02 ± 0.002, P<0.001) (Fig. 3). We also compared cardiac ANG II and aldosterone levels in mice with the same Npr1 gene copy number given different diets. The high-salt diet increased (+) cardiac ANG II (42%, P<0.001) (Fig. 2) and aldosterone levels (40%, P<0.001) (Fig. 3) only in 1-copy mice as compared with mice given a normal salt diet.
FIGURE 2.
Cardiac angiotensin II levels in Npr1 gene-targeted mice with a normal salt, a low-salt or a high-salt diet: Comparisons were made among mice having different Npr1 genotypes and fed the same salt diet: *P<0.05; ***P<0.001 and having the same Npr1 gene copy number with different salt diets: †††P<0.001. Bars indicate the mean ± SE values for the representative genotypes. n = number of mice; HS, high-salt diet; LS, low-salt diet; NS, normal salt diet.
FIGURE 3.
Cardiac aldosterone levels in Npr1 gene-targeted mice with a normal salt, a low-salt or a high-salt diet: Comparisons were made among mice having different Npr1 genotypes fed the same salt diet: **P<0.01; ***P<0.001. Similarly, comparisons were also made among mice having the same Npr1 gene copy number and fed the different salt diets: †††P<0.001. Bars indicate the mean ± SE values for the representative genotypes. n = number of mice; HS, high-salt diet; LS, low-salt diet; NS, normal salt diet.
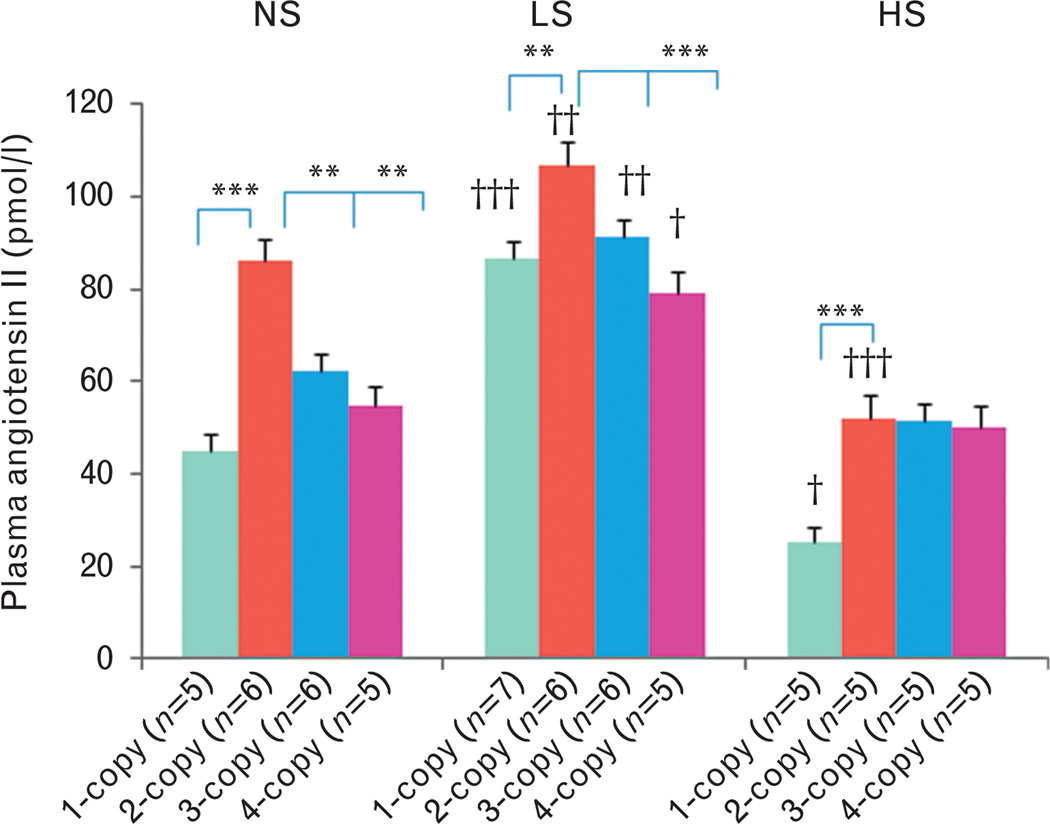
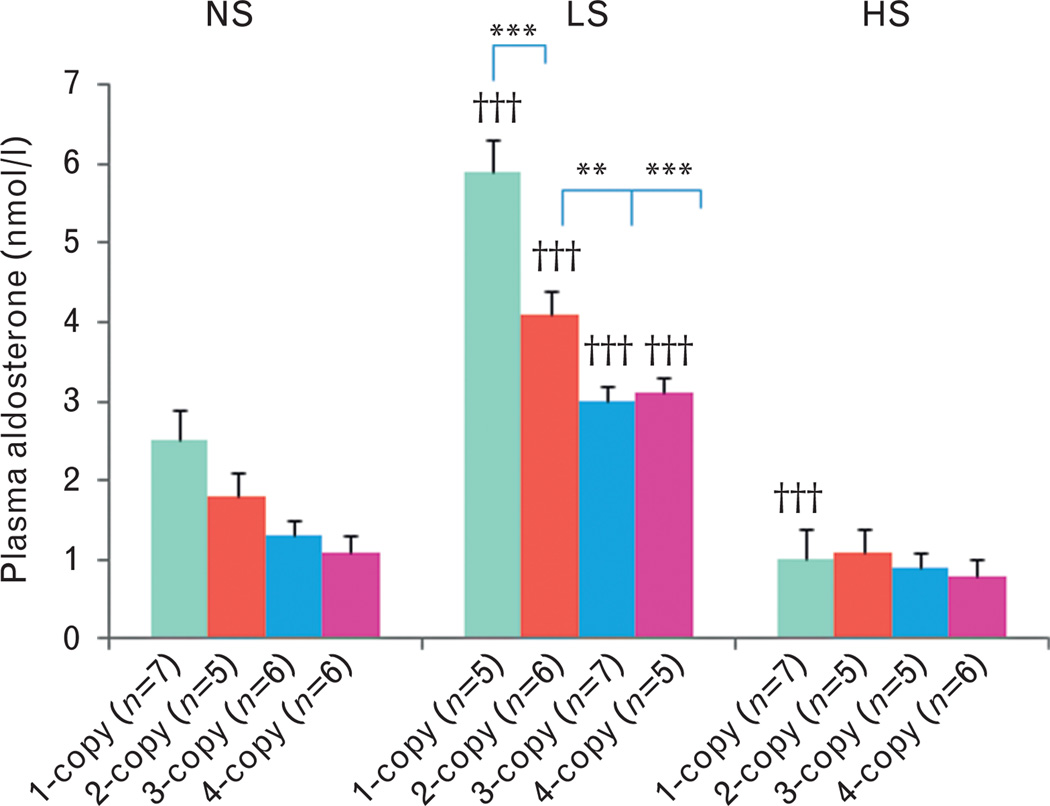
With a normal salt diet, plasma ANG II levels decreased (−) in 1-copy (45.1 ± 3.5, P<0.001), 3-copy (62.1 ± 3.8, P<0.01) and 4-copy mice (54.6 ± 3.2, P<0.01) compared with 2-copy mice (86.0 ± 3.5) (Fig. 4). In contrast, plasma aldosterone levels slightly increased (+) in 1-copy mice (2.5 ± 0.3) compared with 2-copy mice (1.8 ± 0.2), but slightly decreased (−) in 3-copy (1.3 ± 0.1) and 4-copy mice (1.1 ± 0.1) (Fig. 5). With a low-salt diet, plasma ANG II levels decreased (−) in 1-copy (86.8 ± 4.9, P<0.01), 3-copy (91.2 ± 4.8, P<0.05) and 4-copy mice (79.3 ± 5.3, P<0.001) compared with 2-copy mice (106.9 ± 5.0) (Fig. 4). On the contrary, plasma aldosterone levels increased (+) in 1-copy (5.9 ± 0.5, P<0.001) compared with 2-copy mice (4.1 ± 0.4), but decreased (−) in 3-copy (3.0 ± 0.2, P<0.01) and 4-copy mice (3.1 ± 0.3, P<0.001) (Fig. 5). With a high-salt diet, plasma ANG II levels decreased (−) in 1-copy (25.0 ± 3.9, P<0.001) compared with 2-copy mice (51.9 ± 5.3), but there were no statistical differences in 3-copy (51.4 ± 3.6) or 4-copy mice (50.0 ± 4.2) compared with 2-copy mice (Fig. 4). Similarly, there were no statistical differences among plasma aldosterone levels in 1-copy (1.0 ± 0.2), 3-copy (0.9 ± 0.1) or 4-copy mice (0.8.1) compared with 2-copy mice (1.1 ± 0.2) (Fig. 5). We also compared plasma ANG II and aldosterone levels in mice with the same Npr1 gene copy number fed the different diets. The low-salt diet increased (+) plasma ANG II levels in 1-copy (P<0.01), 2-copy (P<0.05), 3-copy (P<0.05) and 4-copy mice (P<0.05) compared with mice given the normal salt diet (Fig. 4). However, the high-salt diet decreased (−) plasma ANG II levels in 1-copy (P<0.05) and 2-copy mice (P<0.01) (Fig. 4). The low-salt diet significantly increased (+) plasma aldosterone levels in 1-copy (P<0.01), 2-copy (P<0.01), 3-copy (P<0.001) and 4-copy mice (P<0.001) compared with mice fed a normal salt diet (Fig. 5). However, the high-salt diet significantly decreased (−) plasma aldosterone levels in 1-copy (P<0.001) mice (Fig. 5).
FIGURE 4.
Plasma angiotensin II levels in Npr1 gene-targeted mice with a normal salt, a low-salt or a high-salt diet: Comparisons were made among mice having different Npr1 genotypes fed the same salt diet: *P<0.05; **P<0.01; ***P<0.001. Comparisons were also made among mice having the same Npr1 gene copy number and given the different salt diets: †P<0.05; ††P<0.01; †††P<0.001. Bars indicate the mean ± SE values for the representative genotypes. n = number of mice; HS, high-salt diet; LS, low-salt diet; NS, normal salt diet.
FIGURE 5.
Plasma aldosterone levels in Npr1 gene-targeted mice with a normal salt, a low-salt or a high-salt diet: Comparisons were made among mice having different Npr1 genotypes fed the same salt diet: **P<0.01; ***P<0.001. Comparisons were also made among mice having the same Npr1 gene copy number fed the different salt diets: †††P<0.001. Bars indicate the mean ± SE values for the representative genotypes. n = number of mice; HS, high-salt diet; LS, low-salt diet; NS, normal salt diet.
Effect of different salt diets on urine output and urinary sodium and potassium excretion in Npr1 mice
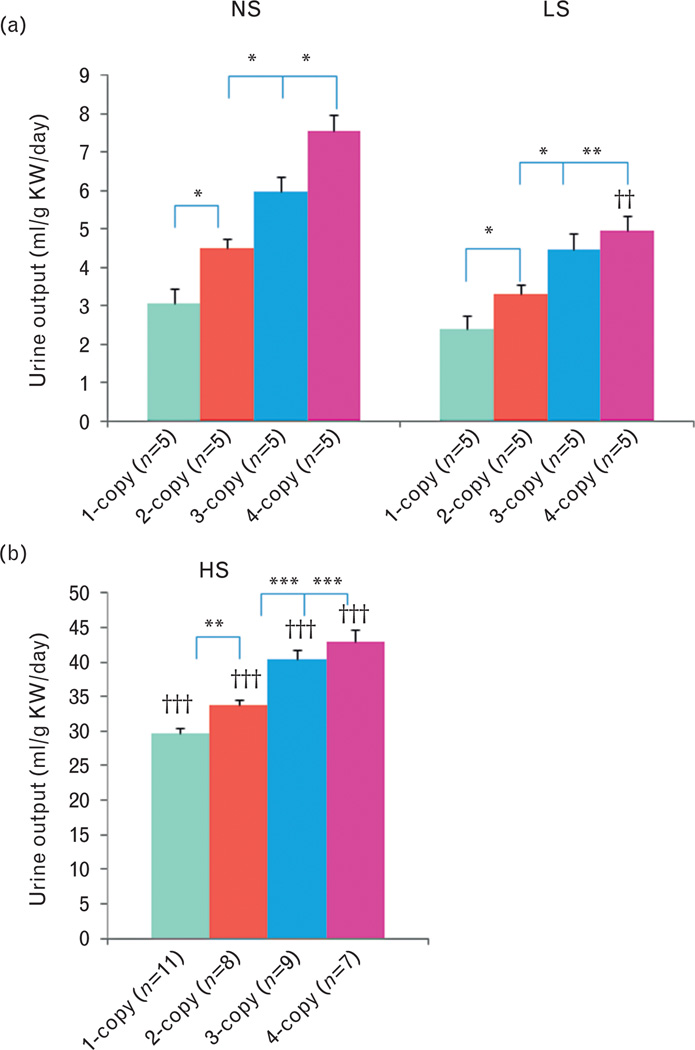
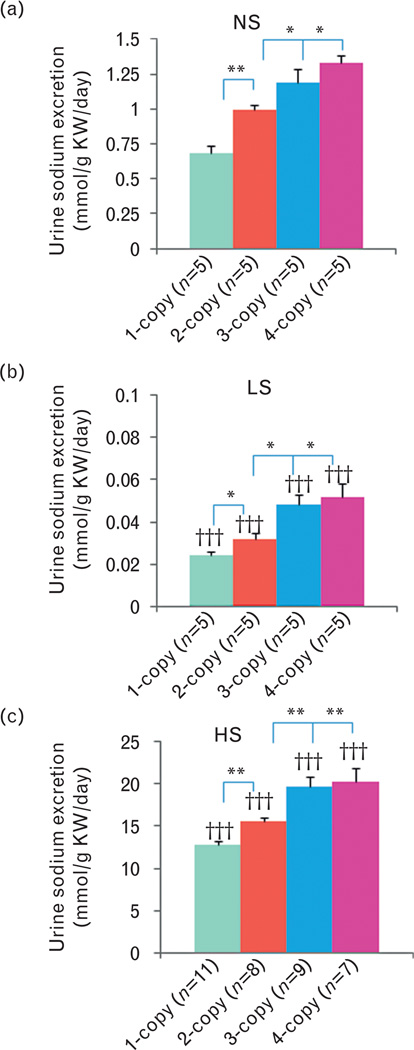
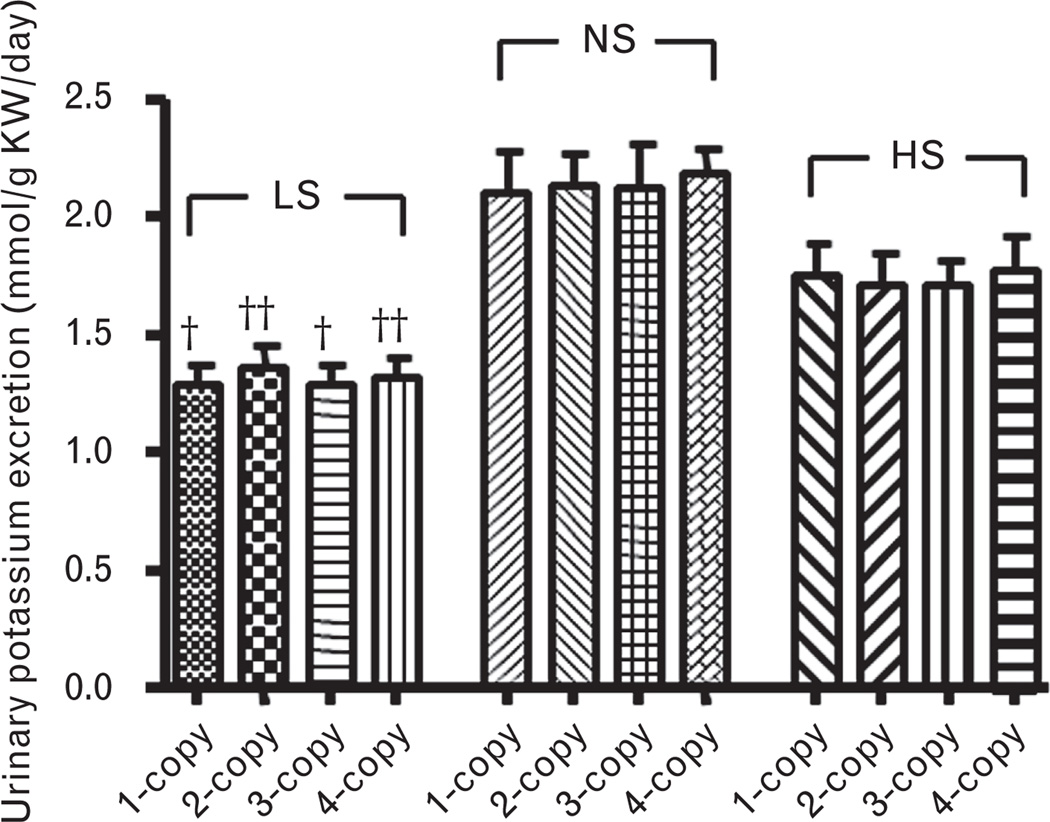
As shown in Fig. 6, with a normal salt diet, urine outputs decreased (−) in 1-copy mice (32%, 3.06 ± 0.38, P<0.05) compared with 2-copy mice (4.49 ± 0.35), but increased (+) in both 3-copy (33%, 5.97 ± 0.47, P<0.05) and 4-copy (68%, 7.56 ± 0.86, P<0.05) mice. Similarly, with a low-salt diet, urine outputs decreased (−) in 1-copy mice (28%, 2.38 ± 0.23, P<0.05) compared with 2-copy mice (3.29 ± 0.19), but increased (+) in 3-copy (36%, 4.48 ± 0.42, P<0.05) and 4-copy (51%, 4.96 ± 0.44, P<0.01) mice (Fig. 6a). Also, with a high-salt diet, urine outputs decreased (−) in 1-copy mice (12%, 29.78 ± 0.95, P<0.01) compared with 2-copy mice (33.79 ± 0.65), but slightly increased (+) in 3-copy (20%, 40.48 ± 1.38, P<0.001) and 4-copy (27%, 42.97 ± 1.74, P<0.001) mice (Fig. 6b). Normal salt diet decreased (−) urinary sodium excretions in 1-copy mice (32%, 0.68 ± 0.06, P<0.001) compared with 2-copy mice (0.99 ± 0.04), but increased (+) in 3-copy (20%, 1.19 ± 0.06, P<0.05) and 4-copy (35%, 1.33 ± 0.09, P<0.05) mice (Fig. 7a). At a low-salt diet, urinary sodium excretions decreased (−) in 1-copy mice (27%, 0.024 ± 0.002, P<0.05) compared with 2-copy mice (0.032 ± 0.003), but increased (+) in 3-copy (48%, 0.048 ± 0.005, P<0.05) and 4-copy (60%, 0.052 ± 0.006, P<0.05) mice (Fig. 7b). Also, with a high-salt diet, urinary sodium excretions decreased (−) in 1-copy mice (18%, 12.75 ± 0.48, P<0.01) compared with 2-copy mice (15.54 ± 0.54), but increased (+) in 3-copy (27%, 19.68 ± 1.18, P<0.01) and 4-copy mice (31%, 20.35 ± 1.55, P<0.01, Fig. 7c). There were no statistical differences for urinary potassium excretions in 1-copy, 3-copy and 4-copy mice compared with 2-copy mice with normal salt, low-salt or high-salt diets, respectively (Fig. 8).
FIGURE 6.
Urine outputs in Npr1 gene-targeted mice with (A) normal salt, low-salt or (B) high-salt diet: Comparisons were made among different Npr1 mice genotypes with same salt diet: *P<0.05; **P<0.01; ***P<0.001. Bars indicate the mean ± SE values for the representative genotypes. Comparisons were also made among mice having same Npr1 gene copy number fed the different salt diets: ††P<0.01; †††P<0.001. n = number of mice; HS, high-salt diet; KW, kidney weight; LS, low-salt diet; NS, normal salt diet.
FIGURE 7.
Urinary sodium execrations in Npr1 gene-targeted mice with (A) low-salt, (B) normal salt or (C) high-salt diet: Comparisons were made among different Npr1 mice genotypes with the same salt diet: *P<0.05; **P<0.01. Bars indicate the mean ± SE values for the representative genotypes. Comparisons were also made among mice having same Npr1 gene copy number fed the different salt diets: †††P<0.001. n=number of mice; HS, high-salt diet; KW, kidney weight; LS, low-salt diet; NS, normal salt diet.
FIGURE 8.
Urinary potassium execrations in Npr1 gene-targeted mice kept on a low-salt, a normal salt or a high-salt diet: Bars indicate the mean ± SE values for the representative genotypes. Comparisons were made among mice having same Npr1 gene copy number fed the different salt diets also Npr1 mice genotypes with same salt diet: †P<0.05; ††P<0.01. n = number of mice; HS, high-salt diet; KW, kidney weight; LS, low-salt diet; NS, normal salt diet.
Effect of different salt diets on proinflammatory cytokines levels in Npr1 mice
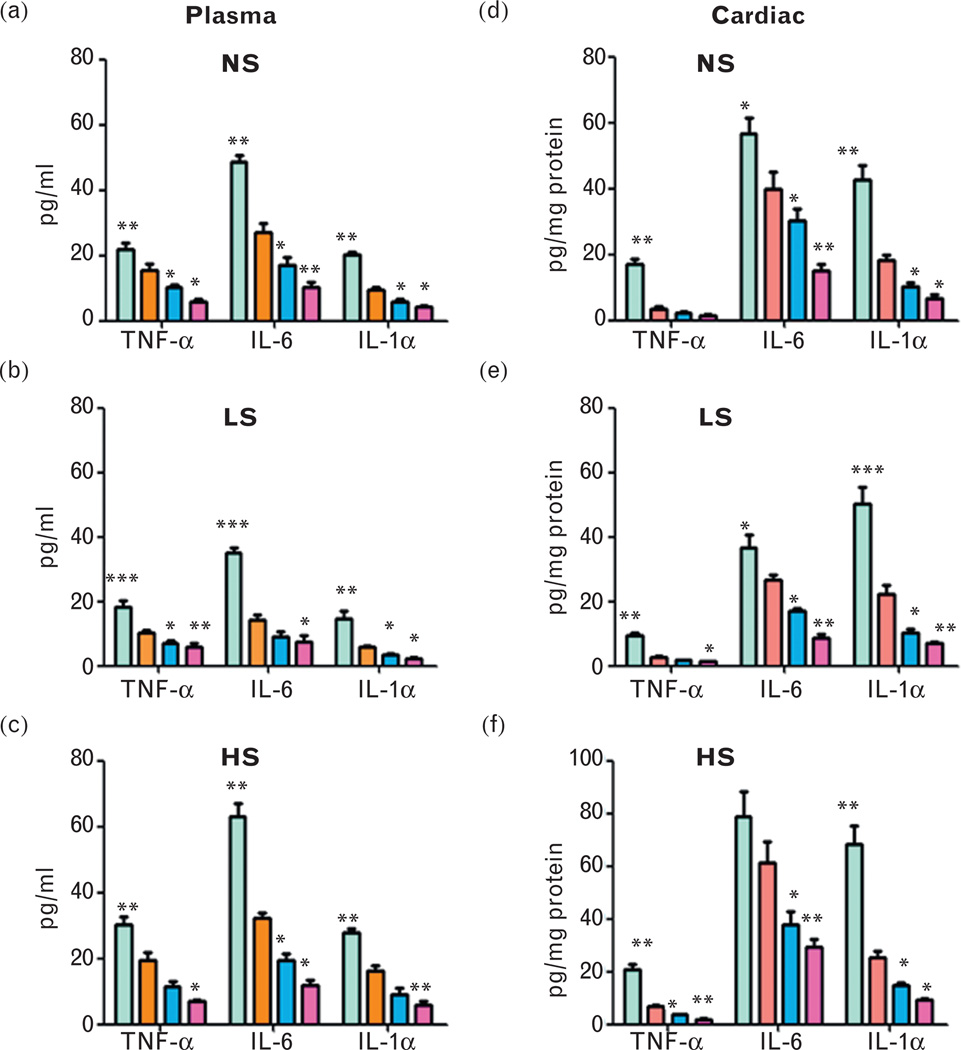
Plasma pro-inflammatory cytokines including TNF-α, IL-6 and IL-1α in salt-treated Npr1 mice are shown in Fig. 9a–c. TNF-α levels were increased (+) in low-salt treated 1-copy mice (80%, 18.25 ± 2.12, P<0.001) compared with 2-copy (10.14 ± 0.92) mice, but decreased (−) in 3-copy (30%, 7.08 ± 0.65, P<0.05) and 4-copy (43%, 5.78 ± 1.35, P<0.01) mice. Similarly, with a normal salt diet, TNF-α levels were increased (+) in 1-copy mice (40%, 21.98 ± 2.01, P<0.01) compared with 2-copy mice (15.66 ± 1.84), but decreased (−) in 3-copy (34%, 10.33 ± 0.71, P<0.05) and 4-copy (63%, 5.83 ± 0.72, P<0.05) mice. High-salt diet increased (+) TNF-α levels in 1-copy mice (56%, 30.27 ± 2.32, P<0.01) but decreased (−) in 3-copy (40%, 11.59 ± 1.51, P<0.05) and 4-copy (63%, 7.13 ± 0.52, P<0.05) mice compared with 2-copy mice (19.36 ± 2.49). Likewise, low-salt, normal salt and high-salt diets increased (+) plasma IL-6 levels in 1-copy mice (145%, 34.93 ± 1.73, P<0.01; 80%, 48.69 ± 1.99, P<0.01; 95%, 63.07 ± 4.02, P<0.01, respectively) but decreased (−) in 3-copy (37%, 8.92 ± 1.72, P<0.05; 36%, 17.22 ± 2.23, P<0.05; 39%, 19.57 ± 1.94, P<0.05) and 4-copy (47%, 7.59 ± 1.91, P<0.05; 62%, 10.32 ± 1.47, P<0.01; 63%, 11.87 ± 1.71, P<0.05) mice, respectively, compared with 2-copy controls (14.23 ± 1.77, 27.01 ± 3.02, 32.27 ± 1.50). Plasma IL-1α levels were also increased in low-salt treated 1-copy mice (152%, 14.84 ± 2.31), whereas 3-copy (43%, 3.37 ± 0.43) and 4-copy (62%, 2.26 ± 0.38) mice showed a decrease (−) compared with 2-copy mice. Normal and high-salt diets showed a significant increase (+) in IL-1α levels in 1-copy mice (115%, 20.21 ± 0.72; 70%, 27.83 ± 1.43) but decreased in 3-copy (36%, 6.04 ± 0.63; 44%, 9.10 ± 1.78) and 4-copy (56%, 4.12 ± 0.54; 63%, 6.01 ± 1.08) mice. Cardiac TNF-α, IL-6 and IL-1α levels were significantly increased (+) in 1-copy mice at low-salt (3.5-fold, 9.58 ± 0.78; 37%, 36.55 ± 3.93; two-fold, 50.25 ± 5.14, respectively), normal salt (five-fold, 17.08 ± 1.65; 43%, 56.69 ± 4.62; 2.3-fold, 42.82 ± 4.06, respectively) and high-salt diets (three-fold, 20.86 ± 2.03; 29%, 78.90 ± 9.62; 2.7-fold, 68.12 ± 7.04, respectively) compared with 2-copy mice (Fig. 9d and e). On the contrary, low-salt, normal salt and high-salt diets showed a reduction (−) in cardiac TNF-α levels in 3-copy (37%, 1.71 ± 0.27; 36%, 2.30 ± 0.39; 46%, 3.65 ± 0.26) and 4-copy (52%, 1.30 ± 0.21; 56%, 1.58 ± 0.32; 72%, 1.88 ± 0.35) mice. Further, cardiac IL-6 (36%, 17.06 ± 0.68; 24%, 30.40 ± 3.48; 38%, 37.95 ± 4.97) and IL-1α levels (53%, 10.32 ± 1.21; 44%, 10.40 ± 0.90; 41%, 14.76 ± 1.04) were also decreased (−) in 3-copy (67%, 8.78 ± 1.10; 62%, 15.08 ± 2.07; 52%, 29.36 ± 3.20) and 4-copy (68%, 6.97 ± 0.51; 63%, 6.83 ± 0.91; 63%, 9.28 ± 0.51) mice receiving low-salt, normal salt and high-salt diets (Fig. 9d and e).
FIGURE 9.
Quantitative analysis of plasma and cardiac pro-inflammatory cytokines in Npr1 mice fed with low-salt, normal salt and high-salt diets: Analysis in (a)–(c) shows plasma cytokine levels and the one in (d)–(f) shows the cardiac cytokine levels in 1-copy, 2-copy, 3-copy and 4-copy mice. Comparisons were made among different Npr1 mice genotypes with the same salt diet: *P<0.05; **P<0.01; ***P<0.001; n = 5 number of mice; HS, high-salt diet; IL-6, interleukin-6; IL-1α, interleukin-1 alpha; LS, low-salt diet; NS, normal salt diet; TNF-α, tumour necrosis factor alpha.
Effect of different salt diets on the heart weight to tibia length and heart weight to body weight ratios in Npr1 mice
On a high-salt diet, arterial pressures were increased (+) in 1-copy (11%, P<0.01) and 2-copy (10%, P<0.05,) mice, whereas a low-salt diet did not alter arterial pressures in 1-copy, 2-copy, 3-copy or 4-copy mice (Table 1). With a normal salt diet, the heart weight to tibia length ratio increased (+) in 1-copy mice (9.3%, 16.5 ± 0.2, P<0.05) compared with 2-copy mice (15.1 ± 0.1), but decreased (−) in 4-copy mice (8.6%, 13.8 ± 0.1, P<0.01) (Table 1). On a low-salt diet, the ratio of heart weight to tibia length decreased (−) in 4-copy mice (10.8%, 13.2 ± 0.4, P<0.05) compared with 2-copy mice (14.8 ± 0.2). However, on a high-salt diet, this ratio increased (+) in 1-copy mice (10.7%, 17.6 ± 0.6, P<0.01) compared with 2-copy mice (15.9 ± 0.4), but decreased (−) in 3-copy (11.3%, 14.1 ± 0.3, P<0.05) and 4-copy (14.5%, 13.6 ± 0.7, P<0.01) mice. As shown in Table 1, with a normal salt diet, the heart weight to body weight ratio decreased (−) in 4-copy mice (5.0 ± 0.1, P<0.01) compared with 2-copy mice (5.6 ± 0.2). Similarly on a low-salt diet, the heart weight to body weight ratio also decreased (−) in 4-copy mice (5.1 ± 0.1, P<0.05) compared with 2-copy mice (5.7 ± 0.1). With a high-salt diet, this ratio decreased (−) in both 3-copy (5.5 ± 0.2, P<0.01) and 4-copy mice (5.2 ± 0.1, P<0.001) mice compared with 2-copy mice (6.3 ± 0.1).
TABLE 1.
Comparisons of blood pressure and the heart weight/tibia length and heart weight/body weight ratios among Npr1 genotypes fed the different salt diets
| Npr1 genotype | ||||
|---|---|---|---|---|
| Parameters | 1-copy | 2-copy | 3-copy | 4-copy |
| Normal salt diet | ||||
| Blood pressure (mmHg) | 114 ± 1.9 | 102 ± 2.0 | 92 ± 1.8 | 86 ± 2.2 |
| Heart weight (mg) | 138 ± 2.9 | 126 ± 1.7 | 118 ± 2.5 | 114 ± 3.6 |
| Body weight (g) | 22 ± 0.8 | 21 ± 0.7 | 22 ± 0.5 | 22 ± 0.6 |
| Tibia length (mm) | 8.4 ± 0.2 | 8.4 ± 0.1 | 8.5 ± 0.2 | 8.3 ± 0.3 |
| HW/BW | 6.4 ± 0.1* | 5.6 ± 0.2 | 5.1 ± 0.1 | 5.0 ± 0.1† |
| HW/TL | 16.5 ± 0.2* | 15.1 ± 0.1 | 13.9 ± 0.3 | 13.8 ± 0.1† |
| Low-salt diet | ||||
| Blood pressure (mmHg) | 116 ± 4.4 | 104. ± 2.1 | 93 ± 1.8 | 85 ± 2.6 |
| Heart weight (mg) | 136 ± 3.0 | 127 ± 2.2 | 118 ± 3.2 | 114 ± 4.7 |
| Body weight (g) | 22.7 ± 0.4 | 22.4 ± 0.7 | 22.3 ± 0.4 | 22.1 ± 0.5 |
| Tibia length (mm) | 8.6 ± 0.2 | 8.6 ± 0.1 | 8.7 ± 0.1 | 8.7 ± 0.1 |
| HW/BW | 6.0 ± 0.1 | 5.7 ± 0.1 | 5.2 ± 0.1 | 5.1 ± 0.1* |
| HW/TL | 15.9 ± 0.3 | 14.8 ± 0.2 | 13.6 ± 0.2 | 13.2 ± 0.4* |
| High-salt diet | ||||
| Blood pressure (mmHg) | 126 ± 2.3 | 112 ± 3.2 | 94 ± 21.8 | 85 ± 2.4 |
| Heart weight (mg) | 149 ± 5.8 | 140 ± 3.8 | 122 ± 3.0 | 114 ± 6.6* |
| Body weight (g) | 22.6 ± 0.4 | 22.3 ± 0.3 | 22.2 ± 0.4 | 22.1 ± 0.5 |
| Tibia length (mm) | 8.5 ± 0.2 | 8.7 ± 0.1 | 8.7 ± 0.1 | 8.4 ± 0.1 |
| HW/BW | 6.7 ± 0.1* | 6.3 ± 0.1 | 5.5 ± 0.2† | 5.2 ± 0.1‡ |
| HW/TL | 17.6 ± 0.6† | 15.1 ± 0.4 | 14.1 ± 0.3* | 13.6 ± 0.7† |
Comparisons were made among mice having different Npr1 genotypes fed the same diet. n = 6 mice per group. BW, body weight; HW, heart weight; TL, tibia length.
P<0.05.
P<0.01.
P<0.001.
DISCUSSION
Increased cardiac angiotensin II levels in Npr1 mice with a high-salt diet
The present findings provide the evidence that cardiac ANG II levels are increased (+) in Npr1 gene-disrupted mice but decreased (−) in Npr1 gene-duplicated mice in a gene dose-dependent manner. As cardiac ANG II plays roles in cardiac remodelling and function [50,51], an increased cardiac ANG II level may participate in the process of cardiac hypertrophy and heart failure in Npr1 null mutant mice. Previous studies have suggested that most of the cardiac ANG II appears to be produced at tissue sites by the conversion of in-situ synthesized ANG I rather than blood-derived ANG I [52]. Factors such as the circulating renin levels and ANG II binding sites in the heart affect cardiac ANG II production [53]. Enzymatic degradation of ANG II and ANG II-type 1 (AT1) receptor-mediated endocytosis also affect the cardiac ANG II levels [53]. Earlier studies have shown that AT1 receptor signalling in cardiac myocytes and fibroblasts elicits growth and fibrosis [54]. It has been reported that ANP inhibits Ang II-stimulated proliferation in foetal cardiomyocytes, indicating the inhibitory role of ANP-NPRA signalling in cardiac hypertrophy [55]. In comparison with a normal salt diet, a high-salt diet increased (+) cardiac ANG II levels only in 1-copy mice, suggesting that an increased (+) cardiac ANG II may promote cardiac hypertrophy in Npr1 gene-disrupted mice. It has also been reported that a high-salt diet causes cardiac hypertrophy in Dahl salt-sensitive rats [56].
Cardiac aldosterone levels are elevated in Npr1 mice fed with a high-salt diet
It has been previously reported that a low-salt diet stimulates plasma aldosterone levels, whereas a high-salt diet suppresses its production [57]. In the present study, a low-salt diet increased (+) plasma aldosterone levels in 1-copy, 2-copy, 3-copy and 4-copy mice compared with mice given a normal salt diet. However, a high-salt diet suppressed (−) plasma aldosterone levels in 1-copy mice, but not in 3-copy and 4-copy mice. It is possible that an increased sodium excretion and urine output with a decreased arterial pressure in 3-copy and 4-copy mice attenuate the inhibitory effect of a high-salt diet on plasma aldosterone levels [58]. Our findings suggest that NPRA signalling exerts protective function with regard to blood volume homeostasis and arterial pressure regulation in Npr1 gene-duplicated mice as compared with Npr1 gene-disrupted mice. Interestingly, it has been reported that a high-salt diet did not affect plasma renin activity in ANP gene-knockout mice as compared with wild-type mice [59]. The authors considered that ANP gene-knockout mice develop a salt-sensitive component of hypertension in association with a failure to downregulate plasma renin activity adequately. There were interactions of salt with Npr1 gene copy numbers for both cardiac and plasma aldosterone levels. However, the data on cardiac ALDO synthesis are still controversial [52,53]. The present results suggest that ANP/NPRA/cGMP signalling reduces the cardiac aldosterone levels and protects the heart from cardiac hypertrophy and remodelling process in disease states.
Effect of salt diets on urine volume and urinary sodium, and potassium levels in Npr1 mice
Variations in dietary sodium chloride intake are closely associated with changes in renal renin and Ang II content [60]. Increased sodium excretion and urine output with relatively lower blood pressure in Npr1 gene-duplicated mice may attenuate the inhibitory effect of a high-salt diet on Ang II levels. ANP-NPRA signalling is critical in mediating the natriuresis and diuresis after acute volume expansion [61,62]. In the present study, urinary sodium excretion and urine output decreased (−) in Npr1 1-copy mice as compared with wild-type mice, but increased (+) in Npr1 gene-duplicated (3-copy and 4-copy) mice with a normal salt, a low-salt or a high-salt diet, respectively. Our result indicates that decreased ANP-NPRA signalling can lead to sodium retention that causes blood pressure elevation in Npr1 gene-disrupted mice. On the contrary, increased (+) ANP-NPRA signalling effectively attenuates sodium retention and blood pressure elevation in Npr1 gene-duplicated mice. These present results further support the concept that ANP-NPRA signalling plays a critical role in mediating natriuresis and diuresis in a gene dose-dependent manner.
Elevated levels of cardiac pro-inflammatory cytokines in Npr1 mice fed a high-salt diet
In the present study, the plasma and cardiac cytokine levels were decreased (−) in all the groups receiving a low-salt diet compared with mice receiving a normal salt diet, suggesting that salt restriction could reduce the pro-inflammatory cytokine levels. Similar results have also been reported in rats receiving ANG II for 10 days [63]. The present results showed that TNF-α, IL-6 and IL-1α levels were elevated (+) in both plasma and heart tissues of Npr1 mice on a high-salt diet compared with a normal salt diet. Our previous studies have shown that pro-inflammatory cytokines promote ventricular remodelling and contractile dysfunction in Npr1 mice [15]. Although a high-salt diet showed a significant baseline elevation (+) for all cytokines in 1-copy mice, yet only a small increase occurred in 3-copy and 4-copy mice. The data suggest that increasing Npr1 gene dosage may play a regulatory role in maintaining the pro-inflammatory cytokine levels in sodium-overloaded mice.
Role of a high-salt diet on heart weight/tibia length and heart weight/body weight ratios in Npr1 mice
In the present study, the ratios of heart weight/tibia length and heart weight/body weight increased (+) in Npr1 gene-disrupted 1-copy mice compared with wild-type mice, but decreased (−) in Npr1 gene-duplicated 4-copy mice, implicating that NPRA signalling protects the heart. The high-salt diet increased (+) arterial pressure only in 1-copy and 2-copy mice, but not in 3-copy and 4-copy mice. It has been reported that arterial pressure was decreased (−) in 4-copy mice fed a high-salt diet as compared with 4-copy mice kept on a low-salt diet [13]. Those previous findings suggested that the Npr1 gene, similar to the gene coding for ANP, may directly affect the sensitivity of arterial pressure to salt loading [13]. Although our data provide the evidence that NPRA signalling exerts a protective effect on arterial pressure regulation in mice fed a high-salt diet, in another Npr1 gene-knockout mouse model, a minimal or a high-salt diet did not affect systemic arterial pressure [62]. Both of these models focus on the Npr1 gene disruption, but they have used gene-targeting methods that differ in their details [8,13,62]. However, a similar degree of hypertension has been confirmed in both mouse models. The plasma cGMP levels were decreased (−) in 1-copy mice and increased (+) in 3-copy and 4-copy mice compared with 2-copy mice. The low-salt diet suppressed (−) plasma cGMP levels in all three genotypes of Npr1 mice, whereas the high-salt diet increased (+) plasma cGMP levels in all Npr1 mice. The present results suggest that reduced cGMP signalling increases the heart weight/body weight and heart weight/tibia length ratios impacting cardiac remodelling in Npr1 1-copy gene-disrupted mice.
In conclusion, the present results provide the evidence that cardiac ANG II and aldosterone concentrations are increased (+) inNpr1 gene-disrupted heterozygous (1-copy) mice fed a high-salt diet, however, greatly reduced (−) in Npr1 gene-duplicated (3-copy and 4-copy) mice. The urinary sodium excretion and urine output decreased (−) in Npr1 1-copy mice as compared with wild-type 2-copy mice, but increased (+) in Npr1 gene-duplicated mice. The pro-inflammatory cytokines levels are elevated (+) in both plasma and heart tissues of Npr1 mice kept on a high-salt diet. Furthermore, the high-salt diet showed a significant baseline elevation (+) of pro-inflammatory cytokines in 1-copy and 2-copy mice; yet, the magnitudes of elevation (+) were only small in 3-copy and 4-copy mice. The present results demonstrate that a high-salt diet elevated (+) cardiac ANG II, aldosterone and pro-inflammatory cytokines in 1-copy mice; however, Npr1 gene-duplicated mice did not render such elevated (+) effect indicating the potential role of NPRA against salt-loading and remodelling process in a Npr1 gene dose-dependent manner. The low-salt diet suppressed (−) plasma cGMP levels in all three genotypes of Npr1 mice, whereas the high-salt diet increased (+) plasma cGMP levels in these Npr1 gene-targeted mice. The present results suggest that ANP/NPRA/cGMP signalling decreases (−) the cardiac ANG II, aldosterone and pro-inflammatory cytokine levels and protects the heart from salt-loading and cardiac remodelling process in the disease state.
ACKNOWLEDGEMENTS
We thank Ms Gevoni Bolden and Ms Vickie Nguyen for technical assistance and Mrs Kamala Pandey for assistance during the preparation of this manuscript. We gratefully acknowledge the assistance of Dr Sudesh Srivastav, Department of Biostatistics and Bioinformatics, during the statistical analyses of the data. We are indebted to Professor Oliver Smithies for providing us with the initial breeding pairs of Npr1 gene-targeted mice. Our thanks are due to Dr Bharat B. Aggarwal, Department of Experimental Therapeutics and Cytokine Research Laboratory, MD Anderson Cancer Center, and Dr Susan L. Hamilton, Department of Molecular Physiology and Biophysics at Baylor College of Medicine for providing their facilities during our displacement due to Hurricane Katrina.
This study was funded by a grant from the National Institutes of Health (grant no. HL-62147).
Abbreviations
- ACE
angiotensin-converting enzyme
- ANG II
angiotensin II
- ANP
atrial natriuretic peptide
- BSA
bovine serum albumin
- GC-A/NPRA
guanylyl cyclase/natriuretic peptide receptor-A
- HW/BW
heart weight/body weight
- HW/TL
heart weight/tibia length
- IL-1α
interleukin-1 alpha
- IL-1β
interleukin-1 beta
- IL-6
interleukin-6
- TFA
trifluoroacetic acid
- TNF-α
tumour necrosis factor-alpha
Footnotes
Conflicts of interest
The authors have no conflicts of interest.
REFERENCES
- 1.de Bold AJ, Borenstein HB, Veress AT, Sonnenberg H. A rapid and potent natriuretic response to intravenous injection of atrial myocardial extract in rats. Life Sci. 1981;28:89–94. doi: 10.1016/0024-3205(81)90370-2. [DOI] [PubMed] [Google Scholar]
- 2.Levin ER, Gardner DG, Samson WK. Natriuretic peptides. N Engl J Med. 1998;339:321–328. doi: 10.1056/NEJM199807303390507. [DOI] [PubMed] [Google Scholar]
- 3.Sugawara A, Nakao K, Morii N, Yamada T, Itoh H, Shiono S, et al. Synthesis of atrial natriuretic polypeptide in human failing hearts. Evidence for altered processing of atrial natriuretic polypeptide precursor and augmented synthesis of beta-human ANP. J Clin Invest. 1988;81:1962–1970. doi: 10.1172/JCI113544. [DOI] [PMC free article] [PubMed] [Google Scholar]
- 4.Pandey KN. Biology of natriuretic peptides and their receptors. Peptides. 2005;26:901–932. doi: 10.1016/j.peptides.2004.09.024. [DOI] [PubMed] [Google Scholar]
- 5.Garbers DL. Guanylyl cyclase receptors and their endocrine, paracrine, and autocrine ligands. Cell. 1992;71:1–4. doi: 10.1016/0092-8674(92)90258-e. [DOI] [PubMed] [Google Scholar]
- 6.Pandey KN, Singh S. Molecular cloning and expression of murine guanylate cyclase/atrial natriuretic factor receptor cDNA. J Biol Chem. 1990;265:12342–12348. [PubMed] [Google Scholar]
- 7.Schulz S, Singh S, Bellet RA, Singh G, Tubb DJ, Chin H, Garbers DL. The primary structure of a plasma membrane guanylate cyclase demonstrates diversity within this new receptor family. Cell. 1989;58:1155–1162. doi: 10.1016/0092-8674(89)90513-8. [DOI] [PubMed] [Google Scholar]
- 8.Oliver PM, Fox JE, Kim R, Rockman HA, Kim HS, Reddick RL, et al. Hypertension, cardiac hypertrophy, and sudden death in mice lacking natriuretic peptide receptor A. Proc Natl Acad Sci USA. 1997;94:14730–14735. doi: 10.1073/pnas.94.26.14730. [DOI] [PMC free article] [PubMed] [Google Scholar]
- 9.Pandey KN. Emerging roles of natriuretic peptides and their receptors in pathophysiology of hypertension and cardiovascular regulation. J Am Soc Hypertension. 2008;2:210–226. doi: 10.1016/j.jash.2008.02.001. [DOI] [PMC free article] [PubMed] [Google Scholar]
- 10.Lucas KA, Pitari GM, Kazerounian S, Ruiz-Stewart I, Park J, Schulz S, et al. Guanylyl cyclases and signaling by cyclic GMP. Pharmacol Rev. 2000;52:375–414. [PubMed] [Google Scholar]
- 11.Sharma RK. Evolution of the membrane guanylate cyclase transduction system. Mol Cell Biochem. 2002;230:3–30. [PubMed] [Google Scholar]
- 12.Pandey KN, Kumar R, Li M, Nguyen H. Functional domains and expression of truncated atrial natriuretic peptide receptor-A: the carboxyl-terminal regions direct the receptor internalization and sequestration in COS-7 cells. Mol Pharmacol. 2000;57:259–267. [PubMed] [Google Scholar]
- 13.Oliver PM, John SW, Purdy KE, Kim R, Maeda N, Goy MF, Smithies O. Natriuretic peptide receptor 1 expression influences blood pressures of mice in a dose-dependent manner. Proc Natl Acad Sci U S A. 1998;95:2547–2551. doi: 10.1073/pnas.95.5.2547. [DOI] [PMC free article] [PubMed] [Google Scholar]
- 14.de Bold AJ. Atrial natriuretic factor: a hormone produced by the heart. Science. 1985;230:767–770. doi: 10.1126/science.2932797. [DOI] [PubMed] [Google Scholar]
- 15.Vellaichamy E, Khurana ML, Fink J, Pandey KN. Involvement of the NF-kappa B/matrix metalloproteinase pathway in cardiac fibrosis of mice lacking guanylyl cyclase/natriuretic peptide receptor A. J Biol Chem. 2005;280:19230–19242. doi: 10.1074/jbc.M411373200. [DOI] [PubMed] [Google Scholar]
- 16.Li P, Wang D, Lucas J, Oparil S, Xing D, Cao X, et al. Atrial natriuretic peptide inhibits transforming growth factor beta-induced Smad signaling and myofibroblast transformation in mouse cardiac fibroblasts. Circ Res. 2008;102:185–192. doi: 10.1161/CIRCRESAHA.107.157677. [DOI] [PubMed] [Google Scholar]
- 17.Das S, Au E, Krazit ST, Pandey KN. Targeted disruption of guanylyl cyclase-A/natriuretic peptide receptor-A gene provokes renal fibrosis and remodeling in null mutant mice: role of proinflammatory cytokines. Endocrinology. 2010;151:5841–5850. doi: 10.1210/en.2010-0655. [DOI] [PMC free article] [PubMed] [Google Scholar]
- 18.Pandey KN, Oliver PM, Maeda N, Smithies O. Hypertension associated with decreased testosterone levels in natriuretic peptide receptor-A gene-knockout and gene-duplicated mutant mouse models. Endocrinology. 1999;140:5112–5119. doi: 10.1210/endo.140.11.7121. [DOI] [PubMed] [Google Scholar]
- 19.Ellmers LJ, Scott NJ, Piuhola J, Maeda N, Smithies O, Frampton CM, et al. Npr1-regulated gene pathways contributing to cardiac hypertrophy and fibrosis. J Mol Endocrinol. 2007;38:245–257. doi: 10.1677/jme.1.02138. [DOI] [PubMed] [Google Scholar]
- 20.Sangaralingham SJ, Tse MY, Pang SC. Estrogen protects against the development of salt-induced cardiac hypertrophy in heterozygous proANP gene-disrupted mice. J Endocrinol. 2007;194:143–152. doi: 10.1677/JOE-07-0130. [DOI] [PubMed] [Google Scholar]
- 21.Shi SJ, Nguyen HT, Sharma GD, Navar LG, Pandey KN. Genetic disruption of atrial natriuretic peptide receptor-A alters renin and angiotensin II levels. Am J Physiol Renal Physiol. 2001;281:F665–F673. doi: 10.1152/ajprenal.2001.281.4.F665. [DOI] [PubMed] [Google Scholar]
- 22.Vellaichamy E, Kaur K, Pandey KN. Enhanced activation of proinflammatory cytokines in mice lacking natriuretic peptide receptor-A. Peptides. 2007;28:893–899. doi: 10.1016/j.peptides.2006.12.009. [DOI] [PMC free article] [PubMed] [Google Scholar]
- 23.Garg R, Oliver PM, Maeda N, Pandey KN. Genomic structure, organization, and promoter region analysis of murine guanylyl cyclase/atrial natriuretic peptide receptor-A gene. Gene. 2002;291:123–133. doi: 10.1016/s0378-1119(02)00589-9. [DOI] [PubMed] [Google Scholar]
- 24.Garg R, Pandey KN. Regulation of guanylyl cyclase/natriuretic peptide receptor-A gene expression. Peptides. 2005;26:1009–1023. doi: 10.1016/j.peptides.2004.09.022. [DOI] [PubMed] [Google Scholar]
- 25.Aviv A. Salt and hypertension: the debate that begs the bigger question. Arch Intern Med. 2001;161:507–510. doi: 10.1001/archinte.161.4.507. [DOI] [PubMed] [Google Scholar]
- 26.Campese VM. Salt sensitivity in hypertension. Renal and cardiovascular implications. Hypertension. 1994;23:531–550. doi: 10.1161/01.hyp.23.4.531. [DOI] [PubMed] [Google Scholar]
- 27.Frohlich ED, Varagic J. Sodium directly impairs target organ function in hypertension. Curr Opin Cardiol. 2005;20:424–429. doi: 10.1097/01.hco.0000175519.34933.a5. [DOI] [PubMed] [Google Scholar]
- 28.Sacks FM, Svetkey LP, Vollmer WM, Appel LJ, Bray GA, Harsha D, et al. Effects on blood pressure of reduced dietary sodium and the Dietary Approaches to Stop Hypertension (DASH) diet. DASH-Sodium Collaborative Research Group. N Engl J Med. 2001;344:3–10. doi: 10.1056/NEJM200101043440101. [DOI] [PubMed] [Google Scholar]
- 29.Endemann DH, Touyz RM, Iglarz M, Savoia C, Schiffrin EL. Eplerenone prevents salt-induced vascular remodeling and cardiac fibrosis in stroke-prone spontaneously hypertensive rats. Hypertension. 2004;43:1252–1257. doi: 10.1161/01.HYP.0000128031.31572.a3. [DOI] [PubMed] [Google Scholar]
- 30.Shi PP, Cao XR, Sweezer EM, Kinney TS, Williams NR, Husted RF, et al. Salt-sensitive hypertension and cardiac hypertrophy in mice deficient in the ubiquitin ligase Nedd4-2. Am J Physiol Renal Physiol. 2008;295:F462–F470. doi: 10.1152/ajprenal.90300.2008. [DOI] [PMC free article] [PubMed] [Google Scholar]
- 31.Yu HC, Burrell LM, Black MJ, Wu LL, Dilley RJ, Cooper ME, Johnston CI. Salt induces myocardial and renal fibrosis in normotensive and hypertensive rats. Circulation. 1998;98:2621–2628. doi: 10.1161/01.cir.98.23.2621. [DOI] [PubMed] [Google Scholar]
- 32.Wang Y, Wang DH. Aggravated renal inflammatory responses in TRPV1 gene knockout mice subjected to DOCA-salt hypertension. Am J Physiol Renal Physiol. 2009;297:F1550–F1559. doi: 10.1152/ajprenal.00012.2009. [DOI] [PMC free article] [PubMed] [Google Scholar]
- 33.Sato A, Saruta T. Aldosterone-induced organ damage: plasma aldosterone level and inappropriate salt status. Hypertension Res. 2004;27:303–310. doi: 10.1291/hypres.27.303. [DOI] [PubMed] [Google Scholar]
- 34.Silvestre JS, Robert V, Heymes C, Aupetit-Faisant B, Mouas C, Moalic JM, et al. Myocardial production of aldosterone and corticosterone in the rat. J Biol Chem. 1998;273:4883–4891. doi: 10.1074/jbc.273.9.4883. [DOI] [PubMed] [Google Scholar]
- 35.Takeda Y, Miyamori I, Yoneda T, Iki K, Hatakeyama H, Blair IA, et al. Production of aldosterone in isolated rat blood vessels. Hypertension. 1995;25:170–173. doi: 10.1161/01.hyp.25.2.170. [DOI] [PubMed] [Google Scholar]
- 36.Benetos A, Lacolley P, Safar ME. Prevention of aortic fibrosis by spironolactone in spontaneously hypertensive rats. Arterioscler Thromb Vasc Biol. 1997;17:1152–1156. doi: 10.1161/01.atv.17.6.1152. [DOI] [PubMed] [Google Scholar]
- 37.Robert MC, Helmy MS. Newly recognized components of the rennin-angiotensin system: potential roles in cardiovascular and renal regulation. Endocr Rev. 2003;24:261–271. doi: 10.1210/er.2003-0001. [DOI] [PubMed] [Google Scholar]
- 38.White PC. Aldosterone: direct effects on and production by the heart. J Clin Endocrinol Metab. 2003;88:2376–2383. doi: 10.1210/jc.2003-030373. [DOI] [PubMed] [Google Scholar]
- 39.Ito T, Yoshimura M, Nakamura S, Nakayama M, Shimasaki Y, Harada E, et al. Inhibitory effect of natriuretic peptides on aldosterone synthase gene expression in cultured neonatal rat cardiocytes. Circulation. 2003;107:807–810. doi: 10.1161/01.cir.0000057794.29667.08. [DOI] [PubMed] [Google Scholar]
- 40.Maack T. Role of atrial natriuretic factor in volume control. Kidney Int. 1996;49:1732–1737. doi: 10.1038/ki.1996.257. [DOI] [PubMed] [Google Scholar]
- 41.Ganguly A. Atrial natriuretic peptide-induced inhibition of aldosterone secretion: a quest for mediatoRs) Am J Physiol. 1992;263:E181–E194. doi: 10.1152/ajpendo.1992.263.2.E181. [DOI] [PubMed] [Google Scholar]
- 42.Olson LJ, Lowe DG, Drewett JG. Novel natriuretic peptide receptor/guanylyl cyclase A-selective agonist inhibits angiotensin II- and forskolin-evoked aldosterone synthesis in a human zona glomerulosa cell line. Mol Pharmacol. 1996;50:430–435. [PubMed] [Google Scholar]
- 43.Zhao D, Vellaichamy E, Somanna NK, Pandey KN. Guanylyl cyclase/natriuretic peptide receptor-A gene disruption causes increased adrenal angiotensin II and aldosterone levels. Am J Physiol Renal Physiol. 2007;293:F121–F127. doi: 10.1152/ajprenal.00478.2006. [DOI] [PubMed] [Google Scholar]
- 44.Shi SJ, Vellaichamy E, Chin SY, Smithies O, Navar LG, Pandey KN. Natriuretic peptide receptor A mediates renal sodium excretory responses to blood volume expansion. Am J Physiol Renal Physiol. 2003;285:F694–F702. doi: 10.1152/ajprenal.00097.2003. [DOI] [PubMed] [Google Scholar]
- 45.Kilic A, Bubikat A, Gassner B, Baba HA, Kuhn M. Local actions of atrial natriuretic peptide counteract angiotensin II stimulated cardiac remodeling. Endocrinology. 2007;148:4162–4169. doi: 10.1210/en.2007-0182. [DOI] [PubMed] [Google Scholar]
- 46.Smithies O, Kim HS. Targeted gene duplication and disruption for analyzing quantitative genetic traits in mice. Proc Natl Acad Sci U S A. 1994;91:3612–3615. doi: 10.1073/pnas.91.9.3612. [DOI] [PMC free article] [PubMed] [Google Scholar]
- 47.Dietrich WF, Miller J, Steen R, Merchant MA, Damron-Boles D, Husain Z, et al. A comprehensive genetic map of the mouse genome. Nature. 1996;380:149–152. doi: 10.1038/380149a0. [DOI] [PubMed] [Google Scholar]
- 48.Krege JH, Hodgin JB, Hagaman JR, Smithies O. A noninvasive computerized tail-cuff system for measuring blood pressure in mice. Hypertension. 1995;25:1111–1115. doi: 10.1161/01.hyp.25.5.1111. [DOI] [PubMed] [Google Scholar]
- 49.Pandey KN, Inagami T. Regulation of renin angiotensins by gonadotropic hormones in cultured murine Leydig tumor cells. Release of angiotensin but not renin. J Biol Chem. 1986;261:3934–3938. [PubMed] [Google Scholar]
- 50.Huggins CE, Domenighetti AA, Pedrazzini T, Pepe S, Delbridge LM. Elevated intracardiac angiotensin II leads to cardiac hypertrophy and mechanical dysfunction in normotensive mice. J Renin Angiotensin Aldosterone Syst. 2003;4:186–190. doi: 10.3317/jraas.2003.030. [DOI] [PubMed] [Google Scholar]
- 51.Paradis P, Dali-Youcef N, Paradis FW, Thibault G, Nemer M. Overexpression of angiotensin II type I receptor in cardiomyocyte induces cardiac hypertrophy and remodeling. Proc Natl Acad Sci U S A. 2000;97:931–936. doi: 10.1073/pnas.97.2.931. [DOI] [PMC free article] [PubMed] [Google Scholar]
- 52.van Kats JP, Danser AHJ, van Meegen JR, Sassen LMA, Verdouw PD, Schalekamp MADH. Angiotensin production by the heart a quantitative study in pigs with the use of radiolabeled angiotensin infusions. Circulation. 1998;98:73–81. doi: 10.1161/01.cir.98.1.73. [DOI] [PubMed] [Google Scholar]
- 53.Danser AHJ, Saris JJ, Schuijt MP, van Kats JP. Is there a local rennin-angiotensin system in the heart? Cardiovasc Res. 1999;44:250–265. doi: 10.1016/s0008-6363(99)00202-3. [DOI] [PubMed] [Google Scholar]
- 54.Bader M. Role of the local renin-angiotensin system in cardiac damage: a minireview focussing on transgenic animal models. J Mol Cell Cardiol. 2002;34:1455–1462. doi: 10.1006/jmcc.2002.2077. [DOI] [PubMed] [Google Scholar]
- 55.O’Tierney PF, Chattergoon NN, Louey S, Giraud GD, Thornburg KL. Atrial natriuretic peptide inhibits angiotensin II-stimulated proliferation in fetal cardiomyocytes. J Physiol. 2010;588(15):2879–2889. doi: 10.1113/jphysiol.2010.191098. [DOI] [PMC free article] [PubMed] [Google Scholar]
- 56.Zhao X, White R, Van Huysse V, Leenen FH. Cardiac hypertrophy and cardiac renin-angiotensin system in Dahl rats on high salt intake. J Hypertens. 2000;18:1319–1326. doi: 10.1097/00004872-200018090-00018. [DOI] [PubMed] [Google Scholar]
- 57.Morgan T. Interactions between sodium and angiotensin. Clin Experiment Pharmacol Physiol. 2001;28:1070–1073. doi: 10.1046/j.1440-1681.2001.03577.x. [DOI] [PubMed] [Google Scholar]
- 58.Zhao D, Vellaichamy E, Somanna NK, Pandey KN. Guanylyl cyclase/natriuretic peptide receptor-A gene disruption causes increased adrenal angiotensin II and aldosterone levels. Am J Physiol Renal Physiol. 2007;293:F121–F127. doi: 10.1152/ajprenal.00478.2006. [DOI] [PubMed] [Google Scholar]
- 59.Melo LG, Steinhelper ME, Pang SC, Tse Y, Ackermann U. ANP in regulation of arterial pressure and fluid-electrolyte balance: lessons from genetic mouse models. Physiol Genomics. 2000;3:45–58. doi: 10.1152/physiolgenomics.2000.3.1.45. [DOI] [PubMed] [Google Scholar]
- 60.Navar LG. The intrarenal renin-angiotensin system in hypertension. Kidney Int. 2004;65:1522–1532. doi: 10.1111/j.1523-1755.2004.00539.x. [DOI] [PubMed] [Google Scholar]
- 61.Mazzocchi G, Malendowicz LK, Markowska A, Albertin G, Nussdorfer GG. Role of adrenal renin-angiotensin system in the control of aldosterone secretion in sodium-restricted rats. Am J Physiol Endocrinal Metab. 2000;278:E1027–E1030. doi: 10.1152/ajpendo.2000.278.6.E1027. [DOI] [PubMed] [Google Scholar]
- 62.Lopez MJ, Wong SK, Kishimoto I, Dubois S, Mach V, Friesen J, et al. Salt-resistant hypertension in mice lacking the guanylyl cyclase-A receptor for atrial natriuretic peptide. Nature. 1995;378:65–68. doi: 10.1038/378065a0. [DOI] [PubMed] [Google Scholar]
- 63.Rugale C, Delbosc S, Cristol JP, Mimran A, Jover B. Sodium restriction prevents cardiac hypertrophy and oxidative stress in angiotensin II hypertension. Am J Physiol Heart Circ Physiol. 2003;284:H1744–H1750. doi: 10.1152/ajpheart.00864.2002. [DOI] [PubMed] [Google Scholar]


