

Abstract
To fully understand skeletal muscle at the cellular level, it is essential to evaluate single muscle fibers. Accordingly, the major goals of this study were to determine if there are fiber type-related differences in single fibers from rat skeletal muscle for: 1) contraction-stimulated glucose uptake and/or 2) the abundance of GLUT4 and other metabolically relevant proteins. Paired epitrochlearis muscles isolated from Wistar rats were either electrically stimulated to contract (E-Stim) or remained resting (No E-Stim). Single fibers isolated from muscles incubated with 2-deoxy-d-[3H]glucose (2-DG) were used to determine fiber type [myosin heavy chain (MHC) isoform protein expression], 2-DG uptake, and abundance of metabolically relevant proteins, including the GLUT4 glucose transporter. E-Stim, relative to No E-Stim, fibers had greater (P < 0.05) 2-DG uptake for each of the isolated fiber types (MHC-IIa, MHC-IIax, MHC-IIx, MHC-IIxb, and MHC-IIb). However, 2-DG uptake for E-Stim fibers was not significantly different among these five fiber types. GLUT4, tethering protein containing a UBX domain for GLUT4 (TUG), cytochrome c oxidase IV (COX IV), and filamin C protein levels were significantly greater (P < 0.05) in MHC-IIa vs. MHC-IIx, MHC-IIxb, or MHC-IIb fibers. TUG and COX IV in either MHC-IIax or MHC-IIx fibers exceeded values for MHC-IIxb or MHC-IIb fibers. GLUT4 levels for MHC-IIax fibers exceeded MHC-IIxb fibers. GLUT4, COX IV, filamin C, and TUG abundance in single fibers was significantly (P < 0.05) correlated with each other. Differences in GLUT4 abundance among the fiber types were not accompanied by significant differences in contraction-stimulated glucose uptake.
Keywords: glucose transport, glucose transporter, exercise, myofiber, myosin heavy chain
skeletal muscle is a heterogeneous tissue, and the magnitude of the exercise-induced increase in glucose uptake is not uniform across all muscles (29, 50). Although the diversity among muscles in their glucose uptake during in vivo exercise is greatly influenced by the levels of muscle recruitment and blood flow, the muscle's intrinsic metabolic characteristics may also modulate contraction-stimulated glucose uptake. Supporting this idea, Henriksen et al. (25) evaluated four different isolated rat skeletal muscles with varying fiber type compositions and found that the greatest contraction-stimulated glucose uptake was in the flexor digitorum brevis [FDB; 92% type IIa fibers (1, 9)], and the lowest values were in the epitrochlearis [51% type IIb fibers (12)]. These results suggest that the capacity for contraction-stimulated glucose uptake of type IIa fibers exceeds that of type IIb fibers in rat muscles.
However, analysis of muscle tissue has limitations for elucidating differences among fiber types at the cellular level because: 1) no rat muscles have been found to exclusively express a single myosin heavy chain (MHC) isoform; 2) no rat muscle has been recognized to be predominantly composed of MHC-IIx fibers; 3) whole tissue analysis cannot determine the glucose uptake of hybrid fibers that express multiple MHC isoforms, and hybrid fibers are common in rat skeletal muscle (7, 8, 42, 56); 4) multiple cell types (including vascular, neural, and adipose cells) contribute to glucose uptake by skeletal muscle tissue; and 5) it cannot be assumed that every functional difference between two muscles with disparate fiber type profiles is necessarily a direct consequence of their fiber type differences.
We recently developed a novel method to determine both glucose uptake and fiber type in a single rat skeletal muscle fiber, making it possible to compare glucose uptake by single fibers of different fiber types from the same muscle. Insulin-stimulated glucose uptake was much greater for single fibers expressing type IIa MHC vs. fibers expressing IIb, IIx, or IIxb MHC (42). However, insulin and contractile activity use distinct mechanisms to increase glucose uptake (10, 11, 15, 21, 23, 45, 46), and muscle fiber type may not have identical relationships with glucose uptake stimulated by insulin vs. contraction. Our overarching goal was to gain insights at a cellular level on the relationships among muscle fiber type, contraction-stimulated glucose uptake, and the expression of key proteins implicated in the regulation of glucose uptake. The first specific aim of this study was to measure contraction-stimulated glucose uptake in single fibers of differing fiber types from epitrochlearis muscles that were electrically stimulated to contract.
Rather than MHC expression directly controlling glucose uptake capacity, it seems more likely that fiber type composition is coregulated with other proteins that regulate glucose uptake. Contraction-stimulated glucose uptake is ultimately dependent on the GLUT4 glucose transporter, and earlier studies have demonstrated a relationship between fiber type composition and muscle GLUT4 protein abundance in muscle tissue (12, 25, 31, 44, 48). Furthermore, Henriksen et al. (25) and Brozinick et al. (6) reported that contraction-stimulated glucose uptake by several muscles was positively related to their GLUT4 abundance. Our second specific aim was to determine if GLUT4 abundance differed according to MHC isoform expression in single fibers.
Based on analysis of multiple muscles with diverse fiber type profiles, we recently found that the relative protein levels of the GLUT4 glucose transporter and tether containing a UBX domain for GLUT4 (TUG) were highly correlated to each other, and each was related to fiber type composition in muscle tissue (12). Our final specific aim was to investigate protein coexpression patterns in single fibers for GLUT4 and TUG, as well as several other proteins with potential metabolic relevance.
MATERIALS AND METHODS
Materials.
The reagents and apparatus for SDS-PAGE, nonfat dry milk (no. 170-6404XTU), and Coomassie Brilliant Blue (no. 161-0436) were from Bio-Rad (Hercules, CA). Bicinchoninic acid protein assay reagent (no. 23227) was from Pierce Biotechnology (Rockford, IL). Anti-cytochrome c oxidase IV (COX IV; no. 4850) and anti-glyceraldehyde-3-phosphate dehydrogenase (GAPDH; no. 2118) were from Cell Signaling Technologies (Danvers, MA). Luminata Forte Western Horseradish Peroxidase Substrate (no. WBLUF0100) was from Millipore (Billerica, MA). Anti-filamin C (no. sc-48496) was from Santa Cruz Biotechnology (Dallas, TX). Anti-GLUT4 and anti-TUG antibodies (provided by Bogan) were raised in rabbits using peptide immunogens corresponding to the COOH-termini of these proteins, as previously described (5, 57). Collagenase type 2 (305 U/mg) was purchased from Worthington Biochemical (no. LS004177, Lakewood, NJ).
Animal treatment.
Procedures for animal care were approved by the University of Michigan Committee on Use and Care of Animals. Male Wistar rats (250–300 g; Harlan, Indianapolis, IN) were provided with standard rodent chow and water ad libitum. Rats were fasted the night before the experiment at ∼1900. On the morning after the overnight fast (between 0700 and 0900), rats were given an intraperitoneal injection of pentobarbital sodium (50 mg/kg wt). While rats were under deep anesthesia, both epitrochlearis muscles were dissected out, rapidly rinsed in warm (35°C) Krebs-Henseleit buffer (KHB), and transferred to vials for subsequent ex vivo incubations.
Muscle incubations and electrical stimulation.
Isolated muscles were incubated in vials containing the appropriate media that was gassed from above (95% O2-5% CO2) in a water bath (35°C for steps 1-3 and 5; and step 4 was on ice) throughout all of the incubation steps. For step 1 (30 min), both epitrochlearis muscles from each rat were placed in vials containing 2 ml of media 1 (KHB supplemented with 8 mM glucose). For step 2 (10 min), one of the paired muscles was suspended in a 5-ml bath containing two platinum electrodes with one end of the muscle attached to a glass rod and the other end attached to a force transducer (Radnoti, Litchfield, CT). The mounted muscle was incubated in media 1 and electrically stimulated to contract [E-Stim: 0.1 ms twitch, 100 Hz train for 10 s, 1 train/min for 10 min; Grass S48 Stimulator; Grass Instruments, Quincy, MA (19, 22)]. The contralateral muscle, serving as a rested/nonelectrically stimulated control (No E-Stim), was transferred to a vial containing media 1. For step 3 (30 min), each muscle was transferred to a vial containing 2 ml of step 3 media [KHB supplemented with 0.1% BSA, 0.1 mM 2-deoxyglucose (2-DG); final specific activity of 13.5 mCi/mmol 2-[3H]DG], and 9.9 mM mannitol]. For step 4 (15 min), muscles underwent three washes (5 min/wash with shaking at 115 revolutions/min) in ice-cold wash media [Ca2+-free KHB supplemented with 0.1% BSA and 8 mM glucose, to clear the extracellular space of 2-[3H]DG (55)]. For step 5 (60–70 min), muscles were incubated in vials containing collagenase media [wash media + 1.5% type II collagenase] for enzymatic digestion of muscle collagen (collagenase-treated muscles are hereafter referred to as fiber bundles).
Isolation and processing of single fibers for glucose uptake and immunoblotting.
After incubation step 5, fiber bundles were removed from collagenase media, washed with wash media at room temperature, and placed in a petri dish containing isolation media [wash media supplemented with 0.25% Trypan blue (TB)] (42). Under a dissecting microscope (EZ4D; Leica, Buffalo Grove, IL), intact single fibers were gently teased away from the fiber bundle using forceps. Only fibers that were not permeable to TB (TB-permeable fibers were very rare) were isolated. Each fiber was imaged using a camera-enabled microscope with Leica Application Suite EZ software after isolation. Fiber dimensions were measured using Image J software (National Institutes of Health). Width (mean value for width measured at 3 locations on each fiber: near the fiber midpoint and approximately halfway between the midpoint and each end of the fiber) and length of each fiber were used to calculate an estimated volume (V = πr2l, where r is radius as determined by half of the width measurement and l is length). After imaging, each fiber was transferred by pipette with 10 μl of isolation media to a microcentrifuge tube containing 10 μl of lysis buffer (1 ml/muscle; 20 mM Tris·HCl, 150 mM NaCl, 1% Triton X-100, 1 mM Na3VO4, 1 mM EDTA, 1 mM EGTA, 2.5 mM sodium pyrophosphate tetrabasic decahydrate, 1 mM β-glycerophosphate, 1 μg/ml leupeptin, and 1 mM phenylmethylsulfonyl fluoride), for a total volume of 20 μl. Lysis buffer (30 μl) and 2× Laemmli buffer (50 μl) were added to each isolated fiber tube and also to each fiber's corresponding background media tube. The tubes were then vortexed and heated to 95–100°C for 5 min. Samples were then cooled and stored at −20°C until 2-DG uptake and MHC isoform expression were determined.
Fiber bundle homogenization and 2-DG uptake.
After isolation of single fibers (∼20–40 fibers/fiber bundle), the remainder of each fiber bundle was homogenized in 1 ml ice-cold lysis buffer using a glass-on-glass pestle and grinding tubes (Kontes, Vineland, NJ) chilled on ice. Aliquots of fiber bundle homogenates were added to vials containing scintillation cocktail (Research Products International, Mount Prospect, IL) for scintillation counting, and 2-DG accumulation was determined (42). A portion of the homogenate was used to determine protein concentration according to the manufacturer's protocol (no. 23227; Pierce Biotechnology), and 2-DG uptake was normalized to protein content (μmol/μg protein for fiber bundles) (42).
Single fiber 2-DG uptake.
An aliquot of each lysed single fiber was pipetted into separate vials with each containing 10 ml of scintillation cocktail. The single fiber counts were then used to determine the single fiber 2-[3H]DG accumulation, which was calculated and normalized to the calculated fiber volume and expressed as nanomoles per microliter (42).
MHC isoform expression.
MHC isoforms from aliquots of single fiber lysates were separated and identified by SDS-PAGE essentially as previously described (41, 42, 54), with the following minor modifications made to the resolving gel (final reagent concentrations): 6.5% acrylamide-bis (50:1), 30% glycerol gel, 210 mM Tris·HCl (pH 7.4), 105 mM glycine, 0.4% SDS, 19% H2O, 0.1% ammonium persulfate, and 0.05% tetraethylethylenediamine. Samples and a MHC isoform standard (6 μg protein of a 3:2 mixture of homogenized rat soleus and extensor digitorum longus muscles containing all four MHC isoforms: I, IIa, IIb, and IIx) were run at a constant voltage (40 V) for 1 h (during electrophoresis that was performed in a refrigerator cooled to 4°C, the gel box was placed in a secondary container that was packed with ice) with continuous mixing by a magnetic stir bar inside the electrophoresis apparatus (Mini-PROTEAN Tetra cell no. 165–8004, Hercules, CA). After 1 h, the power supply was switched from constant voltage mode to constant current mode, with the current setting at the end of the first hour of electrophoresis maintained for the subsequent 23–25 h (with the gel box packed on ice in a refrigerator at 4°C). Gels were subsequently removed and stained with Coomassie Brilliant Blue overnight at room temperature while gently rotating on an orbital shaker. The gels were then destained in 20% methanol and 10% acetic acid solution for 4–6 h while rotating (destaining solution was replaced with fresh solution every 45–60 min). MHC isoform expression was determined by comparing the migration of MHC protein bands from each fiber with a standard prepared from rat soleus and extensor digitorum longus that included all MHC isoforms.
Immunoblotting.
Aliquots of single fiber lysates were heated to 90°C for 5–10 min, separated via SDS-PAGE using 4–20% TGX gradient gels (no. 456–1095; Bio-Rad), and then electrophoretically transferred to nitrocellulose membranes. After transfer, gels were stained in Coomassie Brilliant Blue overnight and then destained the following morning as described above. The Coomassie-stained MHC bands in the gels were quantified by densitometry with these posttransfer MHC band densities serving as the loading controls for the subsequently immunoblotted proteins (Alpha Innotech, San Leandro, CA) (32, 41, 42). Membranes were then rinsed with Tris-buffered saline (TBS: 140 mM NaCl and 20 mM Tris base, pH 7.6), blocked with 5% nonfat dry milk in TBS plus Tween (TBST: 0.1% Tween 20) for 1 h at room temperature, washed 3 × 5 min at room temperature, incubated with the appropriate primary antibody diluted 1:1,000 with 5% BSA-TBST (anti-TUG was the only exception; diluted 1:1,000 with 5% nonfat dry milk-TBST), and rotated on orbital shaker overnight at 4°C. On the following morning membranes were washed 3 × 5 min with TBST and then incubated with the appropriate IgG horseradish peroxidase-conjugated secondary antibody (1:20,000 in 5% milk-TBST) for 3 h at room temperature. Membranes were then washed again 3 × 5 min with TBST, 3 × 5 min with TBS, and subjected to enhanced chemiluminescence to visualize protein bands. Protein bands from the membranes were quantified by densitometry (Alpha Innotech). The individual values for samples were normalized to the mean value for all of the samples on the blot and then divided by the loading control (posttransfer MHC density determined for the respective sample on Coomassie-stained gels) (32).
Statistics.
A two-tailed t-test was used to compare the No E-Stim and E-Stim groups for glucose uptake by muscle bundles. One-way ANOVA was used to determine the effect of fiber type (as determined by MHC expression) on protein abundance, and the Bonferroni correction was used to identify the source of significant variance for data when appropriate. Two-way ANOVA with Bonferroni post hoc analysis was used to determine the effects of fiber type and contraction on glucose uptake. Spearman correlation analysis was used to assess the relationships between abundance of each pair of the proteins studied. Data that were not normally distributed were mathematically transformed to achieve normality before running the appropriate statistical analysis using Sigma Plot version 11.0 (San Rafael, CA). Data were expressed as means ± SE. A P value <0.05 was considered statistically significant.
RESULTS
MHC isoforms.
Single muscle fibers isolated from the epitrochlearis muscle expressed five distinct fiber types: MHC-IIa, MHC-IIax, MHC-IIx, MHC-IIxb, and MHC-IIb (Fig. 1). The respective percentages of total isolated single fibers from these fiber types were: MHC-IIxb (∼44%), MHC-IIb (∼28%), MHC-IIx (∼17%), MHC-IIa (∼6%), and MHC-IIax (∼5%). Consistent with earlier research using the collagenase method to isolate single fibers from rat epitrochlearis muscles (41, 42), no MHC-I fibers were found among any of the single fibers that were isolated in the current study.
Fig. 1.
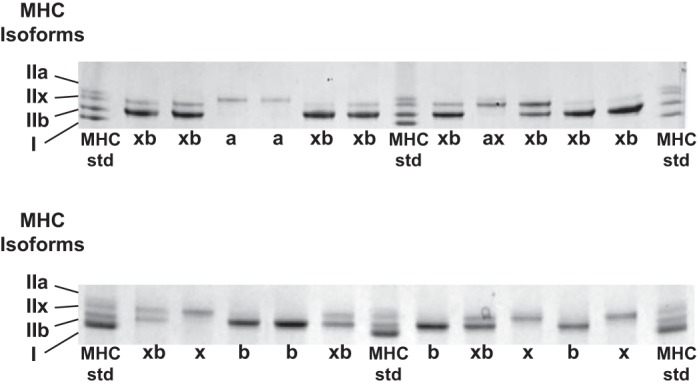
Representative Coomassie-stained gels showing the fiber types expressed by single fibers isolated from rat epitrochlearis muscles. MHC, myosin heavy chain.
2-DG uptake.
E-Stim fiber bundles vs. No E-Stim fiber bundles had significantly greater (P < 0.01) contraction-stimulated 2-DG uptake (Fig. 2). For 2-DG uptake of single fibers (Fig. 3), there were significant main effects of E-Stim (P < 0.01) and fiber type (P < 0.01). Within the No E-Stim group, 2-DG uptake was significantly greater (P < 0.01) for MHC-IIa fibers vs. MHC-IIx and MHC-IIxb fibers. For each fiber type, 2-DG uptake was significantly greater (P < 0.01) for E-Stim fibers vs. the corresponding No E-Stim fibers. However, within the E-Stim group, 2-DG uptake was not statistically different among the fiber types.
Fig. 2.
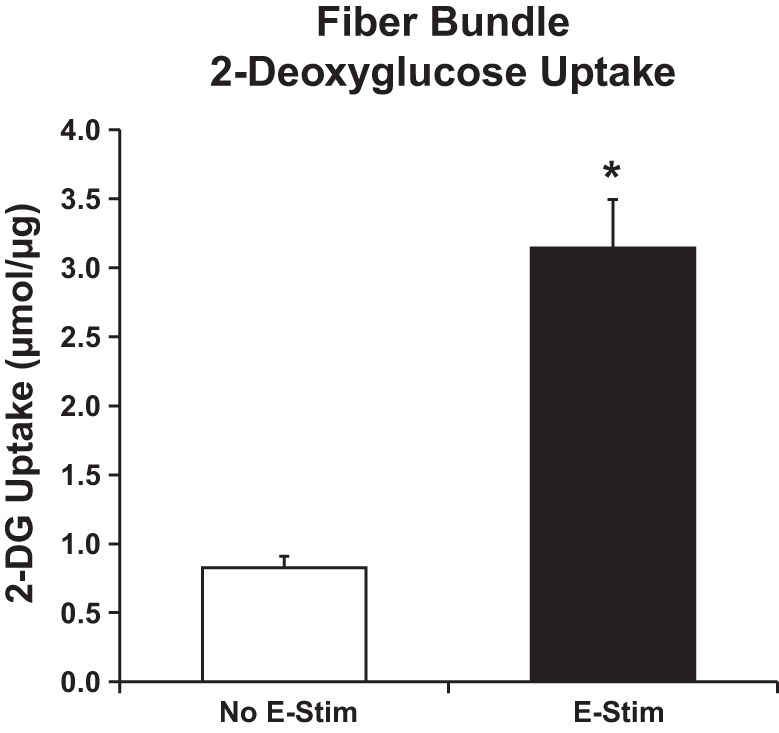
Contraction-stimulated 2-deoxy-d-glucose (2-DG) uptake by fiber bundles. *Significant difference between muscles electrically stimulated to contract (E-Stim) or resting muscles (No E-Stim) (P < 0.01). Values are means ± SE, n = 11 experiments.
Fig. 3.
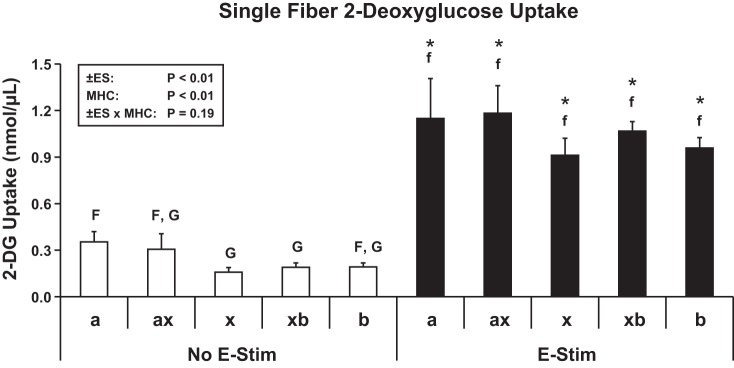
Contraction-stimulated 2-DG uptake by single fibers. Box in top left shows 2-way ANOVA [No E-Stim vs. E-Stim (±ES), fiber type (FT), interaction (±ES × FT)]. For post hoc analysis, statistical significance (P < 0.05) within the No E-Stim fibers (open bars) is indicated by uppercase letters, and significance (P < 0.05) within the E-Stim fibers (filled bars) is indicated by lowercase letters. *Difference (P < 0.05) for No E-Stim vs. E-Stim within a given fiber type. Values are means ± SE (No E-Stim fiber no./E-Stim fiber no.): MHC-IIa (25/21), MHC-IIax (15/27), MHC-IIx (59/72), MHC-IIxb (157/193), and MHC-IIb (84/136).
Relative protein abundance.
GLUT4 protein abundance differed among the fiber types as follows: MHC-IIa was significantly (P < 0.05) greater than MHC-IIx, MHC-IIxb, and MHC-IIb; and MHC-IIax was significantly (P < 0.05) greater than MHC-IIxb and MHC-IIb (Fig. 4A).
Fig. 4.

A: relative GLUT 4 protein abundance for single fibers. *Significance for MHC-IIa vs. MHC-IIx, MHC-IIxb, and MHC-IIb (P < 0.05). †Significance for MHC-IIax vs. MHC-IIxb and MHC-IIb (P < 0.05). B: relative tethering protein containing a UBX domain for GLUT4 (TUG) protein abundance for single fibers. *Significance for MHC-IIa vs. MHC-IIxb and MHC-IIb (P < 0.05). †Significance for MHC-IIax and MHC-IIx vs. MHC-IIxb (P < 0.05). C: relative cytochrome c oxidase IV (COX IV) protein abundance for single fibers. *Significance for MHC-IIa vs. MHC-IIx, MHC-IIxb, and MHC-IIb (P < 0.05). †Significance for MHC-IIax and MHC-IIx vs. MHC-IIxb and MCH-IIb (P < 0.05). D: relative filamin C protein abundance for single fibers. *Significance for MHC-IIa vs. MHC-IIx, MHC-IIxb, and MHC-IIb (P < 0.05). E: relative GAPDH protein abundance for single fibers. Values are means ± SE; n = 10–14 for each fiber type.
TUG protein abundance differed among the fiber types as follows: MHC-IIa was significantly (P < 0.05) greater than MHC-IIxb and MHC-IIb; and MHC-IIax and MHC-IIx were significantly (P < 0.05) greater than MHC-IIxb (Fig. 4B).
COX IV protein abundance differed among the fiber types as follows: MHC-IIa was significantly (P < 0.05) greater than MHC-IIx, MHC-IIxb, and MHC-IIb; and MHC-IIax and MHC-IIx were significantly (P < 0.05) greater than MHC-IIxb and MHC-IIb (Fig. 4C).
Filamin C protein abundance in MHC-IIa fibers was significantly (P < 0.05) greater than in MHC-IIx, MHC-IIxb, and MHC-IIb fibers (Fig. 4D).
The relative protein abundance values for GAPDH did not significantly differ among the fiber types (Fig. 4E).
Correlations.
Significant correlations were identified between the following pairs of proteins: GLUT4 vs. TUG (P < 0.05; Fig. 5A), GLUT4 vs. COX IV (P < 0.01; Fig. 5B), GLUT4 vs. filamin C (P < 0.01; Fig. 5C), filamin C vs. COX IV (P < 0.01; Fig. 6A), TUG vs. COX IV (P < 0.01; Fig. 6B), TUG vs. filamin C (P < 0.01; Fig. 6C), and GAPDH vs. filamin C (P < 0.01; Fig. 6D).
Fig. 5.
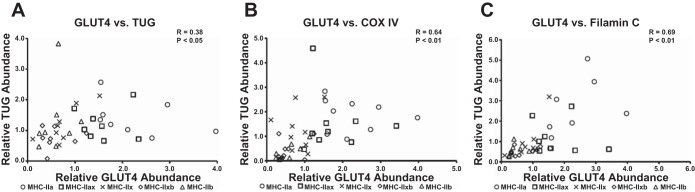
Spearman correlations for abundance of GLUT4 vs. TUG, COX IV, and filamin C in single muscle fibers. A: GLUT4 vs. TUG. B: GLUT4 vs. COX IV. C: GLUT4 vs. filamin C. Each fiber is denoted by an individual symbol, n = 10 for each fiber type (GLUT4 blots were the limiting factor). MHC isoforms are specified by the following symbols: ○, MHC-IIa; □, MHC-IIax; ×, MHC-IIx; ◇, MHC-IIxb; and △, MHC-IIb.
Fig. 6.

Spearman correlations for abundance of COX IV, filamin C, TUG, and GAPDH in single muscle fibers. A: COX IV vs. filamin C. B: TUG vs. COX IV. C: TUG vs. filamin C. D: GAPDH vs. filamin C. Each fiber is denoted by an individual symbol, n = 13–14 for each fiber type. MHC isoforms are specified by the following symbols: ○, MHC-IIa; □, MHC-IIax; ×, MHC-IIx; ◇, MHC-IIxb; and △, MHC-IIb.
DISCUSSION
Single muscle fibers have been extensively studied with regard to their contractile characteristics, but their metabolic properties have received less attention. The current study revealed no significant differences in contraction-stimulated glucose uptake among the five fiber types that were studied (MHC-IIa, MHC-IIax, MHC-IIx, MHC-IIxb, and MHC-IIb) even though these fiber types differed substantially in their abundance of several proteins, including GLUT4. Previous studies (1, 2, 25, 27, 28) have demonstrated that, in whole skeletal muscles studied ex vivo, contraction-stimulated glucose uptake is substantially greater in the FDB (enriched in type IIa fibers) compared with the epitrochlearis (enriched in type IIb fibers) muscles from rats. However, the current results revealed that expression of these MHC isoforms does not predict contraction-stimulated glucose uptake of single fibers from the same muscle. In this context, it seems likely that the differences in contraction-stimulated glucose uptake in the FDB and epitrochlearis are secondary to differences between these muscles other than their MHC isoform profiles.
In contrast to the lack of fiber type differences for glucose uptake by single fibers from muscles after contraction, we previously used the same single fiber glucose uptake method and found substantial fiber type-related differences for insulin-stimulated glucose uptake by single fibers from rat epitrochlearis (41, 42). Insulin-stimulated glucose uptake was more than twofold greater for MHC-IIa fibers vs. fibers expressing each of the other MHC isoforms that were studied, and insulin-stimulated glucose uptake was also greater for MHC-IIxb vs. MHC-IIb fibers (42). The results for insulin-stimulated single fibers were consistent with the greater insulin-stimulated glucose uptake that has been found in the whole FDB vs. the whole epitrochlearis (25). We also previously reported a significantly greater 5-aminoimidazole-4-carboxamide 1-β-d-ribofuranoside (AICAR)-stimulated glucose uptake by single MHC-IIb fibers vs. MHC-IIa fibers (42), which corresponded to the greater AICAR-stimulated glucose uptake that had been observed for the whole epitrochlearis vs. the whole FDB (1). AICAR leads to activation of adenosine monophosphate-activated protein kinase (AMPK), and contraction-stimulation of AMPK is widely believed to be only one of several contraction-induced events that cumulatively account for greater glucose transport in muscle (49). The lack of a difference between MHC-IIa and MHC-IIb fibers for contraction-stimulated glucose uptake in the current study together with the greater AICAR-stimulated glucose uptake in MHC-IIb compared with MHC-IIa fibers in earlier research (42) suggest the possibility that the contraction-stimulated glucose uptake that was caused by non-AMPK-mediated mechanisms may have been greater for MHC-IIa vs. MHC-IIb fibers in the current study. The current results for contraction together with our earlier research for insulin or AICAR have revealed a wider range of responses to these different stimuli in MHC-IIa fibers compared with the other fiber types studied. The stimulus-specific differences in glucose uptake by single fibers may be related, at least in part, to differences in the expression patterns of key proteins that play stimulus-specific roles in the activation of glucose transport.
The contraction protocol used in the current study is very demanding, as evidenced by the tension developed during the tenth and final tetanus being equal to only ∼10% of the peak tension during the initial tetanus (51), and this protocol would be expected to recruit all fiber types, consistent with a substantial increase in glucose uptake in each of the fiber types that were assessed. However, because there are infinite possible variations of the contraction protocol (e.g., by changing the duration of the period of contraction, the number of contractions, the duration of the rest interval between contractions, etc.), it remains possible that the contraction protocol used in this experiment was not maximally effective for increasing glucose uptake in some or all fiber types. Regardless, it is notable that prior research indicated that glucose uptake by the isolated rat epitrochlearis after completing 10 tetanic contractions (as in the current study) was not significantly less than the glucose uptake measured in muscles that performed 20 tetani (30).
GLUT4 is the glucose transporter protein that is redistributed to the cell surface membranes in response to each of these stimuli, i.e., contraction (37, 40, 46), insulin (17, 18, 36, 43, 46), and AICAR (33, 38, 39). The greater values for GLUT4 abundance in MHC-IIa vs. MHC-IIb fibers may be linked to the greater insulin-stimulated glucose uptake in MHC-IIa fibers (41, 42), but this begs the question, why does GLUT4 expression not also track with the capacity for glucose uptake in response to contraction? Several lines of evidence support the idea that muscle has distinct subcellular pools of GLUT4 that vary in their susceptibility to recruitment by different stimuli (14, 18, 35, 46). If this scenario is true, the capacity for contraction-stimulated glucose transport in a given fiber type may be constrained by the amount of GLUT4 that is allocated to the contraction-susceptible pools of GLUT4. It is also possible that there may be fiber type-related differences in the signaling pathways that recruit GLUT4 in response to contraction.
The greater GLUT4 abundance in MHC-IIa vs. MHC-IIb fibers compares well with the greater GLUT4 abundance of the FDB vs. the epitrochlearis reported by Henriksen et al. (25). Based on analysis of multiple muscles, we previously found that the mean values for GLUT4 abundance varied by 2.5-fold, the percent MHC-IIa fibers was positively correlated with GLUT4 levels, and the percent MHC-IIb fibers was negatively correlated with GLUT4 levels (12). The current study was apparently the first to assess single rat fibers for both MHC isoform expression and GLUT4 abundance by immunoblotting. However, Hashimoto et al. (24) studied rat plantaris and performed immunohistochemical analysis of GLUT4 content along with determination of fiber type profiles based on histochemical analysis (myosin ATPase, succinate dehydrogenase, and α-glycerophosphate dehydrogenase). They reported that the rank order for GLUT4 content was: slow oxidative (SO) fibers exceeded fast-oxidative glycolytic (FOG) which, in turn, exceeded fast glycolytic (FG) fibers, but only the SO vs. FG difference achieved statistical significance. Kong et al. (34) studied single fibers from rabbit tibialis anterior and found GLUT4 protein measured by immunoblotting was roughly two- to threefold greater on average in FOG fibers [identified by having high enzymatic activities of both malate dehydrogenase (MDH) and lactate dehydrogenase (LDH)] compared with FG fibers (identified by low MDH activity and high LDH activity). Daugaard et al. (16) dissected single fibers from human vastus lateralis biopsies and determined MHC isoform expression (I, IIa, and IIx are the MHC isoforms expressed in human muscle). After pooling fibers that expressed the same MHC isoform, they determined GLUT4 abundance by immunoblotting. GLUT4 abundance was ∼20% greater for type I compared with MHC-IIa or MHC-IIx fibers, and GLUT4 in the latter fiber types did not differ from each other. When both fiber type and GLUT4 were determined in single fibers of human vastus muscles by immunohistochemical analysis, GLUT4 levels were ∼13% greater for type I vs. type II fibers (types IIa and IIx were not differentiated). The relative magnitude of differences between fiber types may vary among species, but the use of different methods complicates the comparisons across experiments. A unique aspect of the current study was that GLUT4 abundance was determined for hybrid fibers. The results indicated greater GLUT4 content of MHC-IIax fibers compared with either MHC-IIxb or MHC-IIb fibers (but not vs. MHC-IIa or MHC-IIx fibers), and MHC-IIxb fibers were not significantly different from either MHC-IIx or MHC-IIb fibers.
GLUT4 and TUG are binding partners, and their interaction appears to play a role in the subcellular localization of GLUT4 (3, 5). Based on the analysis of multiple rat muscles of varying fiber type, we previously found that the relative levels of GLUT4 and TUG expression were significantly correlated (12). Our current analysis of these same proteins in single fibers extends the earlier research for whole muscle by demonstrating an association between the relative levels of GLUT4 and TUG at the cellular level.
The current results confirmed our previously reported finding that COX IV abundance differed markedly in single fibers with the highest values in IIa fibers and the lowest values in IIb fibers (41). Earlier studies have provided evidence for coregulation of GLUT4 and COX IV in muscle (4, 26), so the positive correlation between GLUT4 and COX IV was not surprising. Both GLUT4 and COX IV abundance are increased by chronic electrical stimulation of muscle or endurance exercise training (26, 34), and denervation lowers GLUT4 and COX IV abundance (13, 44). It seems possible that TUG abundance is also responsive to the level of neuromuscular activity, but this idea has not yet been experimentally tested.
Filamin C is an actin-binding protein and Akt substrate that is selectively expressed in skeletal muscle (20, 47, 53). Filamin C is largely found near the sarcolemma in association with the dystrophin-glycoprotein complex and also near the Z-line (47). Filamin C's functions are unknown, but remodeling of actin filaments is implicated in the spatial localization of signaling proteins and translocation of GLUT4 glucose transporter vesicles (58). Furthermore, insulin leads to increased serine-2213 phosphorylation of filamin C in skeletal muscle (52, 53). The causes and consequences of the fiber type-related expression pattern of filamin C remain to be determined.
With regard to our overarching goal of gaining insights at the cellular level of the relationship among muscle fiber type, contraction-stimulated glucose uptake, and the expression of proteins that might regulate glucose uptake, the most important new finding was that contraction-stimulated glucose uptake did not differ significantly among the five MHC-II fiber types that were studied. It remains possible that fiber type-related differences in glucose uptake occur in MHC-II fibers with voluntary exercise in vivo, but such differences would likely be primarily dependent factors such as extent of recruitment or blood flow rather than the fibers' intrinsic capacity for contraction-stimulated glucose uptake. There were several compelling fiber type-related differences in protein abundance that were expected based on earlier research (GLUT4, TUG, and COX IV), as well as striking and unanticipated fiber type differences for filamin C abundance. The analysis of single fibers offers unique information, and the usefulness of this knowledge is optimized when interpreted in the context of results from studying both isolated skeletal muscle preparations and the intact organism.
GRANTS
This research was supported by grants from the National Institute of Diabetes and Digestive and Kidney Diseases (DK-071771 to G. D. Cartee and DK-092661 to J. S. Bogan).
DISCLOSURES
No conflicts of interest, financial or otherwise, are declared by the authors.
AUTHOR CONTRIBUTIONS
Author contributions: C.M.C. and G.D.C. conception and design of research; C.M.C., E.B.A., and N.S. performed experiments; C.M.C. analyzed data; C.M.C. and G.D.C. interpreted results of experiments; C.M.C. prepared figures; C.M.C. and G.D.C. drafted manuscript; C.M.C., E.B.A., N.S., J.S.B., and G.D.C. edited and revised manuscript; C.M.C., E.B.A., N.S., J.S.B., and G.D.C. approved final version of manuscript.
ACKNOWLEDGMENTS
Current addresses: C. Castorena, Internal Medicine, Division of Hypothalamic Research, University of Texas Southwestern Medical Center, Dallas, TX; and N. Sharma, School of Health Sciences, Central Michigan University, Mount Pleasant, MI.
REFERENCES
- 1.Ai H, Ihlemann J, Hellsten Y, Lauritzen HP, Hardie DG, Galbo H, Ploug T. Effect of fiber type and nutritional state on AICAR- and contraction-stimulated glucose transport in rat muscle. Am J Physiol Endocrinol Metab 282: E1291–E1300, 2002. [DOI] [PubMed] [Google Scholar]
- 2.Ai H, Ralston E, Lauritzen HP, Galbo H, Ploug T. Disruption of microtubules in rat skeletal muscle does not inhibit insulin- or contraction-stimulated glucose transport. Am J Physiol Endocrinol Metab 285: E836–E844, 2003. [DOI] [PubMed] [Google Scholar]
- 3.Belman JP, Habtemichael EN, Bogan JS. A proteolytic pathway that controls glucose uptake in fat and muscle. Rev Endocr Metab Disord 15: 55–66, 2014. [DOI] [PMC free article] [PubMed] [Google Scholar]
- 4.Benton CR, Nickerson JG, Lally J, Han XX, Holloway GP, Glatz JF, Luiken JJ, Graham TE, Heikkila JJ, Bonen A. Modest PGC-1alpha overexpression in muscle in vivo is sufficient to increase insulin sensitivity and palmitate oxidation in subsarcolemmal, not intermyofibrillar, mitochondria. J Biol Chem 283: 4228–4240, 2008. [DOI] [PubMed] [Google Scholar]
- 5.Bogan JS, Hendon N, McKee AE, Tsao TS, Lodish HF. Functional cloning of TUG as a regulator of GLUT4 glucose transporter trafficking. Nature 425: 727–733, 2003. [DOI] [PubMed] [Google Scholar]
- 6.Brozinick JT Jr, Etgen GJ Jr, Yaspelkis BB 3rd, Kang HY, Ivy JL. Effects of exercise training on muscle GLUT-4 protein content and translocation in obese Zucker rats. Am J Physiol Endocrinol Metab 265: E419–E427, 1993. [DOI] [PubMed] [Google Scholar]
- 7.Caiozzo VJ, Baker MJ, Huang K, Chou H, Wu YZ, Baldwin KM. Single-fiber myosin heavy chain polymorphism: how many patterns and what proportions? Am J Physiol Regul Integr Comp Physiol 285: R570–R580, 2003. [DOI] [PubMed] [Google Scholar]
- 8.Caiozzo VJ, Haddad F, Baker M, McCue S, Baldwin KM. MHC polymorphism in rodent plantaris muscle: effects of mechanical overload and hypothyroidism. Am J Physiol Cell Physiol 278: C709–C717, 2000. [DOI] [PubMed] [Google Scholar]
- 9.Carlsen RC, Larson DB, Walsh DA. A fast-twitch oxidative-glycolytic muscle with a robust inward calcium current. Can J Physiol Pharmacol 63: 958–965, 1985. [DOI] [PubMed] [Google Scholar]
- 10.Cartee GD, Funai K. Exercise and insulin: convergence or divergence at AS160 and TBC1D1? Exercise Sport Sci Rev 37: 188–195, 2009. [DOI] [PMC free article] [PubMed] [Google Scholar]
- 11.Cartee GD, Wojtaszewski JF. Role of Akt substrate of 160 kDa in insulin-stimulated and contraction-stimulated glucose transport. Appl Physiol Nutr Metab 32: 557–566, 2007. [DOI] [PubMed] [Google Scholar]
- 12.Castorena CM, Mackrell JG, Bogan JS, Kanzaki M, Cartee GD. Clustering of GLUT4, TUG, and RUVBL2 protein levels correlate with myosin heavy chain isoform pattern in skeletal muscles, but AS160 and TBC1D1 levels do not. J Appl Physiol 111: 1106–1117, 2011. [DOI] [PMC free article] [PubMed] [Google Scholar]
- 13.Chabi B, Adhihetty PJ, O'Leary MF, Menzies KJ, Hood DA. Relationship between Sirt1 expression and mitochondrial proteins during conditions of chronic muscle use and disuse. J Appl Physiol 107: 1730–1735, 2009. [DOI] [PubMed] [Google Scholar]
- 14.Coderre L, Kandror KV, Vallega G, Pilch PF. Identification and characterization of an exercise-sensitive pool of glucose transporters in skeletal muscle. J Biol Chem 270: 27584–27588, 1995. [DOI] [PubMed] [Google Scholar]
- 15.Constable SH, Favier RJ, Cartee GD, Young DA, Holloszy JO. Muscle glucose transport: interactions of in vitro contractions, insulin, and exercise. J Appl Physiol 64: 2329–2332, 1988. [DOI] [PubMed] [Google Scholar]
- 16.Daugaard JR, Nielsen JN, Kristiansen S, Andersen JL, Hargreaves M, Richter EA. Fiber type-specific expression of GLUT4 in human skeletal muscle: influence of exercise training. Diabetes 49: 1092–1095, 2000. [DOI] [PubMed] [Google Scholar]
- 17.Douen AG, Ramlal T, Klip A, Young DA, Cartee GD, Holloszy JO. Exercise-induced increase in glucose transporters in plasma membranes of rat skeletal muscle. Endocrinology 124: 449–454, 1989. [DOI] [PubMed] [Google Scholar]
- 18.Douen AG, Ramlal T, Rastogi S, Bilan PJ, Cartee GD, Vranic M, Holloszy JO, Klip A. Exercise induces recruitment of the “insulin-responsive glucose transporter”. Evidence for distinct intracellular insulin- and exercise-recruitable transporter pools in skeletal muscle. J Biol Chem 265: 13427–13430, 1990. [PubMed] [Google Scholar]
- 19.Dumke CL, Kim J, Arias EB, Cartee GD. Role of kallikrein-kininogen system in insulin-stimulated glucose transport after muscle contractions. J Appl Physiol 92: 657–664, 2002. [DOI] [PubMed] [Google Scholar]
- 20.Fujita M, Mitsuhashi H, Isogai S, Nakata T, Kawakami A, Nonaka I, Noguchi S, Hayashi YK, Nishino I, Kudo A. Filamin C plays an essential role in the maintenance of the structural integrity of cardiac and skeletal muscles, revealed by the medaka mutant zacro. Dev Biol 361: 79–89, 2012. [DOI] [PubMed] [Google Scholar]
- 21.Funai K, Cartee GD. Inhibition of contraction-stimulated AMP-activated protein kinase inhibits contraction-stimulated increases in PAS-TBC1D1 and glucose transport without altering PAS-AS160 in rat skeletal muscle. Diabetes 58: 1096–1104, 2009. [DOI] [PMC free article] [PubMed] [Google Scholar]
- 22.Funai K, Schweitzer GG, Castorena CM, Kanzaki M, Cartee GD. In vivo exercise followed by in vitro contraction additively elevates subsequent insulin-stimulated glucose transport by rat skeletal muscle. Am J Physiol Endocrinol Metab 298: E999–E1010, 2010. [DOI] [PMC free article] [PubMed] [Google Scholar]
- 23.Gao J, Ren J, Gulve EA, Holloszy JO. Additive effect of contractions and insulin on GLUT-4 translocation into the sarcolemma. J Appl Physiol 77: 1597–1601, 1994. [DOI] [PubMed] [Google Scholar]
- 24.Hashimoto T, Masuda S, Taguchi S, Brooks GA. Immunohistochemical analysis of MCT1, MCT2 and MCT4 expression in rat plantaris muscle. J Physiol 567: 121–129, 2005. [DOI] [PMC free article] [PubMed] [Google Scholar]
- 25.Henriksen EJ, Bourey RE, Rodnick KJ, Koranyi L, Permutt MA, Holloszy JO. Glucose transporter protein content and glucose transport capacity in rat skeletal muscles. Am J Physiol Endocrinol Metab 259: E593–E598, 1990. [DOI] [PubMed] [Google Scholar]
- 26.Holloszy JO. Regulation by exercise of skeletal muscle content of mitochondria and GLUT4. J Physiol Pharmacol 59, Suppl 7: 5–18, 2008. [PubMed] [Google Scholar]
- 27.Ihlemann J, Ploug T, Galbo H. Effect of force development on contraction induced glucose transport in fast twitch rat muscle. Acta Physiol Scand 171: 439–444, 2001. [DOI] [PubMed] [Google Scholar]
- 28.Ihlemann J, Ploug T, Hellsten Y, Galbo H. Effect of stimulation frequency on contraction-induced glucose transport in rat skeletal muscle. Am J Physiol Endocrinol Metab 279: E862–E867, 2000. [DOI] [PubMed] [Google Scholar]
- 29.James DE, Kraegen EW, Chisholm DJ. Muscle glucose metabolism in exercising rats: comparison with insulin stimulation. Am J Physiol Endocrinol Metab 248: E575–E580, 1985. [DOI] [PubMed] [Google Scholar]
- 30.Kawanaka K, Tabata I, Higuchi M. More tetanic contractions are required for activating glucose transport maximally in trained muscle. J Appl Physiol 83: 429–433, 1997. [DOI] [PubMed] [Google Scholar]
- 31.Kern M, Wells JA, Stephens JM, Elton CW, Friedman JE, Tapscott EB, Pekala PH, Dohm GL. Insulin responsiveness in skeletal muscle is determined by glucose transporter (Glut4) protein level. Biochem J 270: 397–400, 1990. [DOI] [PMC free article] [PubMed] [Google Scholar]
- 32.Koh HJ, Toyoda T, Fujii N, Jung MM, Rathod A, Middelbeek RJ, Lessard SJ, Treebak JT, Tsuchihara K, Esumi H, Richter EA, Wojtaszewski JF, Hirshman MF, Goodyear LJ. Sucrose nonfermenting AMPK-related kinase (SNARK) mediates contraction-stimulated glucose transport in mouse skeletal muscle. Proc Natl Acad Sci USA 107: 15541–15546, 2010. [DOI] [PMC free article] [PubMed] [Google Scholar]
- 33.Koistinen HA, Galuska D, Chibalin AV, Yang J, Zierath JR, Holman GD, Wallberg-Henriksson H. 5-Amino-imidazole carboxamide riboside increases glucose transport and cell-surface GLUT4 content in skeletal muscle from subjects with type 2 diabetes. Diabetes 52: 1066–1072, 2003. [DOI] [PubMed] [Google Scholar]
- 34.Kong X, Manchester J, Salmons S, Lawrence JC Jr. Glucose transporters in single skeletal muscle fibers. Relationship to hexokinase and regulation by contractile activity. J Biol Chem 269: 12963–12967, 1994. [PubMed] [Google Scholar]
- 35.Lauritzen HP. Insulin- and contraction-induced glucose transporter 4 traffic in muscle: insights from a novel imaging approach. Exerc Sport Sci Rev 41: 77–86, 2013. [DOI] [PMC free article] [PubMed] [Google Scholar]
- 36.Lauritzen HP, Galbo H, Brandauer J, Goodyear LJ, Ploug T. Large GLUT4 vesicles are stationary while locally and reversibly depleted during transient insulin stimulation of skeletal muscle of living mice: imaging analysis of GLUT4-enhanced green fluorescent protein vesicle dynamics. Diabetes 57: 315–324, 2008. [DOI] [PubMed] [Google Scholar]
- 37.Lauritzen HP, Galbo H, Toyoda T, Goodyear LJ. Kinetics of contraction-induced GLUT4 translocation in skeletal muscle fibers from living mice. Diabetes 59: 2134–2144, 2010. [DOI] [PMC free article] [PubMed] [Google Scholar]
- 38.Lemieux K, Konrad D, Klip A, Marette A. The AMP-activated protein kinase activator AICAR does not induce GLUT4 translocation to transverse tubules but stimulates glucose uptake and p38 mitogen-activated protein kinases alpha and beta in skeletal muscle. FASEB J 17: 1658–1665, 2003. [DOI] [PubMed] [Google Scholar]
- 39.Li J, Hu X, Selvakumar P, Russell IR, Cushman SW, Holman GD, Young LH. Role of the nitric oxide pathway in AMPK-mediated glucose uptake and GLUT4 translocation in heart muscle. Am J Physiol Endocrinol Metab 287: E834–E841, 2004. [DOI] [PubMed] [Google Scholar]
- 40.Lund S, Holman GD, Schmitz O, Pedersen O. Contraction stimulates translocation of glucose transporter GLUT4 in skeletal muscle through a mechanism distinct from that of insulin. Proc Natl Acad Sci USA 92: 5817–5821, 1995. [DOI] [PMC free article] [PubMed] [Google Scholar]
- 41.Mackrell JG, Arias EB, Cartee GD. Fiber type-specific differences in glucose uptake by single fibers from skeletal muscles of 9- and 25-month-old rats. J Gerontol A Biol Sci Med Sci 67: 1286–1294, 2012. [DOI] [PMC free article] [PubMed] [Google Scholar]
- 42.Mackrell JG, Cartee GD. A novel method to measure glucose uptake and myosin heavy chain isoform expression of single fibers from rat skeletal muscle. Diabetes 61: 995–1003, 2012. [DOI] [PMC free article] [PubMed] [Google Scholar]
- 43.Marette A, Burdett E, Douen A, Vranic M, Klip A. Insulin induces the translocation of GLUT4 from a unique intracellular organelle to transverse tubules in rat skeletal muscle. Diabetes 41: 1562–1569, 1992. [DOI] [PubMed] [Google Scholar]
- 44.Megeney LA, Neufer PD, Dohm GL, Tan MH, Blewett CA, Elder GC, Bonen A. Effects of muscle activity and fiber composition on glucose transport and GLUT-4. Am J Physiol Endocrinol Metab 264: E583–E593, 1993. [DOI] [PubMed] [Google Scholar]
- 45.Nesher R, Karl IE, Kipnis DM. Dissociation of effects of insulin and contraction on glucose transport in rat epitrochlearis muscle. Am J Physiol Cell Physiol 249: C226–C232, 1985. [DOI] [PubMed] [Google Scholar]
- 46.Ploug T, van Deurs B, Ai H, Cushman SW, Ralston E. Analysis of GLUT4 distribution in whole skeletal muscle fibers: identification of distinct storage compartments that are recruited by insulin and muscle contractions. J Cell Biol 142: 1429–1446, 1998. [DOI] [PMC free article] [PubMed] [Google Scholar]
- 47.Razinia Z, Makela T, Ylanne J, Calderwood DA. Filamins in mechanosensing and signaling. Annu Rev Biophys 41: 227–246, 2012. [DOI] [PMC free article] [PubMed] [Google Scholar]
- 48.Richardson JM, Balon TW, Treadway JL, Pessin JE. Differential regulation of glucose transporter activity and expression in red and white skeletal muscle. J Biol Chem 266: 12690–12694, 1991. [PubMed] [Google Scholar]
- 49.Richter EA, Hargreaves M. Exercise, GLUT4, and skeletal muscle glucose uptake. Physiol Rev 93: 993–1017, 2013. [DOI] [PubMed] [Google Scholar]
- 50.Richter EA, Ploug T, Galbo H. Increased muscle glucose uptake after exercise. No need for insulin during exercise. Diabetes 34: 1041–1048, 1985. [DOI] [PubMed] [Google Scholar]
- 51.Sancho R, Kim J, Cartee GD. Decreased contraction-stimulated glucose transport in isolated epitrochlearis muscles of pregnant rats. J Appl Physiol 98: 1021–1027, 2005. [DOI] [PubMed] [Google Scholar]
- 52.Sequea DA, Sharma N, Arias EB, Cartee GD. Greater filamin C, GSK3alpha, and GSK3beta serine phosphorylation in insulin-stimulated isolated skeletal muscles of calorie restricted 24 month-old rats. Mech Ageing Dev 134: 60–63, 2013. [DOI] [PMC free article] [PubMed] [Google Scholar]
- 53.Sharma N, Arias EB, Sequea DA, Cartee GD. Preventing the calorie restriction-induced increase in insulin-stimulated Akt2 phosphorylation eliminates calorie restriction's effect on glucose uptake in skeletal muscle. Biochim Biophys Acta 1822: 1735–1740, 2012. [DOI] [PMC free article] [PubMed] [Google Scholar]
- 54.Talmadge RJ, Roy RR. Electrophoretic separation of rat skeletal muscle myosin heavy-chain isoforms. J Appl Physiol 75: 2337–2340, 1993. [DOI] [PubMed] [Google Scholar]
- 55.Wang C. Insulin-stimulated glucose uptake in rat diaphragm during postnatal development: lack of correlation with the number of insulin receptors and of intracellular glucose transporters. Proc Natl Acad Sci USA 82: 3621–3625, 1985. [DOI] [PMC free article] [PubMed] [Google Scholar]
- 56.Wu YZ, Baker MJ, Crumley RL, Caiozzo VJ. Single-fiber myosin heavy-chain isoform composition of rodent laryngeal muscle: modulation by thyroid hormone. Arch Otolaryngol Head Neck Surg 126: 874–880, 2000. [DOI] [PubMed] [Google Scholar]
- 57.Yu CF, Cresswell J, Loffler MG, Bogan JS. The glucose transporter 4-regulating protein TUG is essential for highly insulin-responsive glucose uptake in 3T3–L1 adipocytes. J Biol Chem 282: 7710–7722, 2007. [DOI] [PMC free article] [PubMed] [Google Scholar]
- 58.Zaid H, Antonescu CN, Randhawa VK, Klip A. Insulin action on glucose transporters through molecular switches, tracks and tethers. Biochem J 413: 201–215, 2008. [DOI] [PubMed] [Google Scholar]