

Abstract
The cortical control of forelimb motor function has been studied extensively, especially in the primate. In contrast, cortical control of the hindlimb has been relatively neglected. This study assessed the output properties of the primary motor cortex (M1) hindlimb representation in terms of the sign, latency, magnitude, and distribution of effects in stimulus-triggered averages (StTAs) of electromyography (EMG) activity recorded from 19 muscles, including hip, knee, ankle, digit, and intrinsic foot muscles, during a push-pull task compared with data reported previously on the forelimb. StTAs (15, 30, and 60 μA at 15 Hz) of EMG activity were computed at 317 putative layer V sites in two rhesus macaques. Poststimulus facilitation (PStF) was distributed equally between distal and proximal muscles, whereas poststimulus suppression (PStS) was more common in distal muscles than proximal muscles (51/49%, respectively, for PStF; 72/28%, respectively, for PStS) at 30 μA. Mean PStF and PStS onset latency generally increased the more distal the joint of a muscle's action. Most significantly, the average magnitude of hindlimb poststimulus effects was considerably weaker than the average magnitude of effects from forelimb M1. In addition, forelimb PStF magnitude increased consistently from proximal to distal joints, whereas hindlimb PStF magnitude was similar at all joints except the intrinsic foot muscles, which had a magnitude of approximately double that of all of the other muscles. The results suggest a greater monosynaptic input to forelimb compared with hindlimb motoneurons, as well as a more direct synaptic linkage for the intrinsic foot muscles compared with the other hindlimb muscles.
Keywords: motor cortex, hindlimb, EMG, stimulus-triggered averaging
the cortical control of the hindlimb in primates has been relatively neglected compared with the extensive studies of the forelimb. Forelimb motor cortex has been investigated using a variety of anatomical and electrophysiological techniques, including unit recording, spike- and stimulus-triggered averaging (StTA) of electromyography (EMG) activity, high-frequency intracortical microstimulation (ICMS), intracellular recording, and retrograde tracing (Asanuma et al. 1978; Asanuma and Rosén 1972; Baker et al. 1998; Churchland et al. 2012; Dancause et al. 2005; Graziano et al. 2005; Luppino et al. 1991; McKiernan et al. 1998; Park et al. 2001, 2004; Plautz et al. 2000; Schieber and Rivlis 2005). These studies have demonstrated important findings concerning the somatotopic organization of forelimb primary motor cortex (M1), anatomical projections to and from forelimb M1, neuron density, output effects of M1 on forelimb muscles, activity relationships of neurons to various parameters of movement, and map reorganization in response to use and injury.
By comparison, there have been far fewer studies of the cortical control of the hindlimb in nonhuman primates. Monosynaptic linkages have been observed between corticospinal neurons and motoneurons in both the forelimb and the hindlimb (Asanuma et al. 1979; Clough et al. 1968; Edgley et al. 1997; He et al. 1993, 1995; Jankowska et al. 1975; Lemon 1990; Muir and Porter 1973; Phillips and Porter 1964; Preston et al. 1967; Preston and Whitlock 1961, 1963; Shapovalov 1975; Shapovalov and Kurchavyi 1974). In fact, physiological evidence establishing the existence of monosynaptic linkages from cortex to motoneurons actually came from work on the hindlimb by Bernhard et al. (1953). Bernhard and Bohm (1954) then introduced the term “corticomotoneuronal system” to refer to the fast-conducting corticospinal neurons that make monosynaptic connections with motoneurons. Nevertheless, in contrast to the numerous single-unit and electrode-array recording studies of forelimb cortex, there have been only three unit-recording studies of hindlimb M1 neurons in nonhuman primates (Ma and He 2010; Neafsey 1980; Sahrmann et al. 1984). Retrograde tracer and ICMS studies in macaque monkeys have confirmed the location of hindlimb M1 medial to forelimb M1 in the precentral gyrus and extending into the bank of the central sulcus (CS) and the bank of the medial wall of the hemisphere (Hatanaka et al. 2001; He et al. 1993; Luppino et al. 1991; Wise and Tanji 1981). Hindlimb studies in the cat have shown modulation of cortical neurons during treadmill locomotion and intense cortical activity related to trajectory modification (Drew et al. 2002; Widajewicz et al. 1994). In humans, facilitation and suppression effects in leg muscles have been demonstrated using transcranial magnetic stimulation to evoke EMG potentials (Bawa et al. 2002; Brouwer and Ashby 1990, 1992; Perez et al. 2004; Thomas and Gorassini 2005).
Recently, we developed a method for chronically implanting EMG electrodes in large numbers of hindlimb muscles (Hudson et al. 2010). In the present study, we applied this method, together with StTA of EMG activity recorded from 19 muscles of the hindlimb while the monkey performed a push-pull task, to investigate the sign, latency, and magnitude of poststimulus output effects based on a systematic exploration of hindlimb M1 cortex. The methods that we used are very similar to those of a previous study from our laboratory on the forelimb (Park et al. 2004), allowing direct comparison of hindlimb and forelimb M1 output properties. Our results show that short latency facilitation of hindlimb EMG activity is present in StTAs; however, the magnitude of effects is substantially weaker than forelimb effects, suggesting a much weaker synaptic linkage.
MATERIALS AND METHODS
Behavioral task.
Data were collected from the left M1 of two male rhesus macaques (Macaca mulatta; ∼10 kg, 6–7 yr old). Both monkeys were trained to perform a hindlimb push-pull task, engaging both proximal and distal muscles in reliable and stereotyped patterns of activation (Hudson et al. 2010). Within a sound-attenuating chamber, the monkey was seated in a custom primate chair with both arms and the left leg restrained. With the right foot, the monkey gripped a manipulandum (horizontal post) and extended the leg until the target zone was achieved. After a hold period of 500 ms in the target zone, the monkey flexed the leg pulling the manipulandum to a second target zone. An applesauce reward was given following a second hold period of 500 ms, and the monkey repeated this cycle. Visual and auditory cues guided the behavioral task.
Magnetic resonance imaging.
The monkey's head was placed in an MRI-compatible stereotaxic apparatus, and structural MRIs in the sagittal, coronal, and horizontal planes were obtained using an Allegra 3T system (Siemens, Muenchen, Germany). A three-dimensional (3D) reconstruction of each monkey's brain was produced using Computerized Anatomical Reconstruction and Editing Tool Kit software, and this was used to confirm placement of the cortical chamber.
Surgical procedures.
Upon completion of training, each monkey was implanted with a titanium cortical recording chamber (30 mm inside diameter), centered at anterior 13.5 mm, lateral 0 mm, and 0° angle to the sagittal plane (Paxinos et al. 2000). Pairs of insulated, multistranded stainless-steel wires (AS 632; Cooner Wire, Chatsworth, CA) were implanted during an aseptic surgical procedure (Hudson et al. 2010) to record EMG activity simultaneously from 19 muscles of the hindlimb. Briefly, pairs of wires were tunneled subcutaneously to their target muscles from either four external connector modules (ITT Canon, White Plains, NY) affixed to the upper arm with elastic medical adhesive tape (arm-mounted subcutaneous implant; monkey F) or an external, circular connector (Amphenol, Wallingford, CT) affixed to the skull using dental acrylic (cranial-mounted subcutaneous implant; monkey C). Each muscle was tested for proper placement of electrode pairs by stimulating through the electrodes with brief stimulus trains (biphasic pulse, 0.2 ms/phase, ∼50 Hz) while observing the evoked movements. Wires were removed and reinserted if proper placement was not confirmed.
EMGs were recorded from four hip muscles: gluteus maximus (GMAX), adductor brevis (ADB), gracilis, and tensor fascia latae (TFL); six knee muscles: rectus femoris (RF), vastus lateralis (VL), vastus medialis (VM), biceps femoris (BFL), semimembranosus, and semitendonosus (SET); five ankle muscles: peroneus longus (PERL), medial gastrocnemius, lateral gastrocnemius, soleus (SOL), and tibialis anterior (TA); two digit muscles: extensor digitorum longus and flexor digitorum longus; and two intrinsic foot muscles: extensor digitorum brevis (EDB) and flexor hallucis brevis (FHB). In monkey C, the EMG leads to PERL were compromised shortly after the implant. As a result, PERL was not included in the data set for monkey C.
All procedures were in accordance with the standards outlined by the Guide for the Care and Use of Laboratory Animals published by the U.S. National Institutes of Health and the U.S. Department of Health and Human Services and approved by the University Animal Care and Use Committee. All surgeries were performed in an Association for Assessment and Accreditation of Laboratory Animal Care-accredited facility using full aseptic procedures. Postoperative analgesics (buprenorphine, 0.01 mg/kg) were administered for 5 days. Wound edges were inspected daily and treated with topical antibiotic and Betadine (10% povidone-iodine) when necessary.
Data collection.
EMG activity, cortical activity, and task-related signals were simultaneously monitored and recorded. Glass and mylar-insulated, platinum-iridium electrodes (0.5–1.5 MΩ impedances; Frederick Haer, Bowdoin, ME) were used to record cortical unit activity and for microstimulation. The electrode was positioned in the recording chamber using a custom-built x–y positioner and advanced using a manual hydraulic microdrive (Frederick Haer). Electrode penetrations were systematically made at 1-mm intervals in the precentral cortex of the left hemisphere. Data were collected from putative layer V sites in the cortex. All corticospinal neurons reside in layer V (He et al. 1993, 1995), which is located ∼1.5 mm below the surface of the cortex. We used first activity as an indicator of the cortical surface and applied stimulation 1.5 mm below first activity. In the convexity of the precentral gyrus, this was the only site stimulated, because the electrode entered white matter with further advancement beyond the 1.5-mm site. For penetrations down the bank of the precentral gyrus and the medial wall of the hemisphere, stimulation continued at intervals of 0.5 mm below the first site at 1.5 mm. Besides depth, additional criteria for identifying layer V sites included the nature and size of neuronal spikes, as well as the strength of effects in relation to nearby electrode tracks. For example, two sites adjacent to one another and at the same depth in the bank of the precentral gyrus were evaluated in terms of spike characteristics and strength of effects to identify which one was layer V. Identification of layer V was aided by the fact that layer V pyramidal cells in hindlimb cortex produce particularly large extracellular spikes.
In rhesus monkeys, the posterior border of supplementary motor area (SMA) is located ∼7 mm posterior to the posterior limit of the arcuate sulcus (Luppino et al. 1991; Mitz and Wise 1987). The most anterior points from which we obtained poststimulus effects (PStEs) were all posterior to this boundary (see Fig. 2), so we are confident that all of our stimulation sites were in M1, not SMA. To support this conclusion is the fact that the representation of the hindlimb in SMA is limited using short-train ICMS to evoke movements, and what does exist tends to be in the medial wall of the hemisphere (Macpherson et al. 1982; Mitz and Wise 1987). In contrast, most of the hindlimb representation from M1 that we have found is on the dorsal surface rather than the medial wall of the hemisphere.
Fig. 2.

Maps of hindlimb M1 organization in 2 monkeys (F and C), represented in 2 dimensions after unfolding the medial wall and central sulcus (CS). Maps of hindlimb muscles were based on PStF effects at 15, 30, and 60 μA. If no effects were obtained with StTA at 60 μA, then high-frequency, long-duration intracortical microstimulation (HFLD-ICMS) was used to evoke movements at joints whose muscles were not implanted with electromyography electrodes. HFLD-ICMS was performed at 15, 30, and 60 μA. For clarity, evoked movements from HFLD-ICMS are represented only in the 60-μA maps. Cutaneous responses of cortical neurons were used to identify boundaries with sensory areas. Cortical areas producing hindlimb muscle facilitation are represented in blue. Black dots are sites that produced a poststimulus effect (PStE); open circles are sites that did not produce PStEs in the hindlimb muscles tested but were tested with HFLD-ICMS. For mapping, an effect in only 1 muscle was considered sufficient to identify the site as hindlimb. Light blue line is the midline. Above the light blue line represents the bank of the medial wall of the hemisphere. Solid black, curved line is the CS. Dotted black, curved line is the fundus of the CS. Solid purple line is the superior pre-CS (sprs). Solid red line is the arcuate sulcus (arc). Solid orange line represents the posterior border of the supplementary motor area (SMA). Intersection of the grid lines represents the center of the recording chamber. ANT, anterior; POST, posterior; MED, medial; LAT, lateral.
At each cortical site, StTAs of EMG activity were collected at 15, 30, and 60 μA (15 Hz) for 19 muscles of the hindlimb as the monkey performed the push-pull task. Individual stimuli were symmetrical, biphasic pulses—0.2-ms negative pulse, followed by a 0.2-ms positive pulse—applied throughout all phases of the task. EMGs were generally filtered at 30 Hz–1 kHz, digitized at 4 kHz, and full-wave rectified. StTAs consisted of at least 500 trigger events and were compiled over an 80-ms epoch, 20-ms pretrigger, and 60-ms post-trigger. To prevent averaging periods where EMG activity was minimal or nonexistent, segments of EMG activity associated with each stimulus were accepted for averaging, only if the average of all EMG data points over the entire 80-ms epoch was ≥5% of full-scale input (McKiernan et al. 1998). If PStEs were not detected at 60 μA, then high-frequency, long-duration ICMS (HFLD-ICMS; 15–60 μA, 200 Hz, 500 ms) was applied to identify M1 regions representing muscles not implanted with EMG electrodes (e.g., trunk, tail, and forelimb). Sensory cortex was identified by the presence of distinctive spike activity in response to cutaneous stimulation.
EMG-triggered averages were computed to evaluate cross-talk between muscles (Cheney and Fetz 1980). Averages of EMG activity were compiled for all 19 muscles using each muscle as the source of triggers. This yielded a “crosstalk peak” for each muscle as a trigger paired with all other muscles. If the ratio of the cortically triggered effect for a pair of muscles was less than twice their cross-talk peak, then it was interpreted as an indication that much of the cortical effect may have been due to crosstalk, and the effect was eliminated (Buys et al. 1986). No poststimulus facilitation (PStF) or poststimulus suppression (PStS) had to be eliminated based on this criterion.
Data analysis.
PStF and PStS effects were computer measured, as described by Mewes and Cheney (1991). Each average was compiled over an 80-ms epoch, 20-ms pretrigger, and 60-ms post-trigger. A PStE was defined as a peak or trough of EMG activity that rose or fell from baseline EMG activity and maintained a level of activity exceeding 2.25 SD of baseline for a period ≥0.75 ms. Baseline EMG activity was measured as the 12-ms period preceding the onset of the effect, initially determined by visual inspection. In cases where the baseline was rising or declining, a shorter baseline, close to the onset of the PStE, was used. Baseline statistics were then used to determine the onset of the effect as the point where the envelope of the record exceeded 2 SD of baseline. The magnitude of PStE was expressed as the peak percentage increase (ppi) or decrease in EMG activity above (PStF) or below (PStS) baseline. Figure 1 illustrates the application of these criteria to StTAs, obtained from one cortical site at 15, 30, and 60 μA. Stimulation at 15 μA produced clear PStF in VL and RF, as well as marginal effects in two other muscles (SET and BFL). Thirty microamps yielded clear PStF in six muscles, all proximal. At 60 μA, these effects became stronger, and clear PStF appeared in three additional proximal muscles (VM, GMAX, and ADB), as well as two distal muscles (FHB and TA).
Fig. 1.

Stimulus-triggered averages (StTAs) of 19 muscles of the hindlimb at 15, 30, and 60 μA from 1 site in hindlimb primary motor cortex (M1). Stimulus occurs at time 0. Range of trigger events listed at the bottom of each stimulus column. Numbers on the right side of records give the magnitude of poststimulus facilitation (PStF) expressed as peak percentage increase (ppi; over baseline), including some that fell below the criterion of activity, exceeding 2.25 SD of baseline. Asterisks mark records with clear PStF that were included in the database. FHB, flexor hallucis brevis; EDB, extensor digitorum brevis; FDL, flexor digitorum longus; EDL, extensor digitorum longus; TA, tibialis anterior; SOL, soleus; LG, lateral gastrocnemius; MG, medial gastrocnemius; PERL, peroneus longus; SET, semitendonosus; SEM, semimembranosus; BFL, biceps femoris; VM, vastus medialis; VL, vastus lateralis; RF, rectus femoris; TFL, tensor fascia latae; GRA, gracilis; ADB, adductor brevis; GMAX, gluteus maximus.
Unfolding the cortex.
A 2D representation of layer V of the cortex in the medial wall of the hemisphere and the anterior bank of the CS required flattening and unfolding the curvature of the cortex. This process has been described in detail by Park et al. (2001). Briefly, the cortex was unfolded, and 2D maps were generated, based on known architectural landmarks, MRI images, observations during the cortical chamber implant surgery, electrode track x–y coordinates, electrode penetration depth, and properties of recorded neurons (Fig. 2).
RESULTS
Data set.
Table 1 summarizes the data collected from the left M1 in two male rhesus macaques. Three hundred twelve electrode tracks were made (monkey F, 170; monkey C, 142). StTAs (15, 30, and 60 μA at 15 Hz) of rectified EMG activity were collected from 19 hindlimb muscles of the hip, knee, ankle, digit, and intrinsic foot. Only data from putative layer V sites were analyzed. HFLD-ICMS (15–60 μA, 200 Hz, 500 ms) was performed at 133 sites to identify output effects (movements or EMG responses) when no PStEs were obtained. The presence or absence of sensory responses, typical of primary somatosensory cortex (S1), was tested at 65 sites, primarily to aid in identifying the M1–S1 border. Figure 1 shows typical results for one cortical site where effects were obtained at 15, 30, and 60 μA, as discussed in materials and methods.
Table 1.
Summary of data collected
|
Monkey F |
Monkey C |
Total |
|||||||
|---|---|---|---|---|---|---|---|---|---|
| Electrode tracks | 170 | 142 | 312 | ||||||
| HFLD-ICMS sites* | 83 | 50 | 133 | ||||||
| Sensory test | 24 |
41 |
65 |
||||||
| Stimulus-triggered averaging | 15 μA | 30 μA | 60 μA | 15 μA | 30 μA | 60 μA | 15 μA | 30 μA | 60 μA |
| Sites stimulated, all | 130 | 163 | 180 | 152 | 152 | 164 | 282 | 315 | 344 |
| StTA records, all | 2,470 | 3,097 | 3,420 | 2,692 | 2,692 | 2,908 | 5,162 | 5,789 | 6,328 |
| Layer V sites† | 117 | 150 | 167 | 142 | 142 | 150 | 259 | 292 | 317 |
| StTA records† | 2,223 | 2,850 | 3,173 | 2,524 | 2,524 | 2,670 | 4,747 | 5,374 | 5,843 |
| Sites yielding PStEs† | 31 | 59 | 107 | 66 | 96 | 118 | 90 | 153 | 222 |
| Sites yielding PStF† | 24 | 52 | 96 | 57 | 92 | 115 | 81 | 144 | 211 |
| Sites yielding PStS† | 8 | 19 | 61 | 25 | 47 | 74 | 33 | 66 | 135 |
| PStEs obtained† | 47 | 168 | 594 | 212 | 513 | 939 | 259 | 681 | 1,533 |
| PStF effects | 38 | 142 | 501 | 171 | 433 | 796 | 209 | 575 | 1,297 |
| PStS effects | 9 | 26 | 93 | 41 | 79 | 143 | 50 | 105 | 236 |
HFLD-ICMS, high-frequency, long-duration intracortical microstimulation; StTA, stimulus-triggered average; PStEs, poststimulus effects; PStF, poststimulus facilitation; PStS, poststimulus suppression. (PStS was only counted if it was the 1st effect; suppression preceded by facilitation was not counted as PStS.)
Train (500 ms, 200 Hz, 15–60 μA); for testing sites outside of the hindlimb representation. †Putative layer V sites, identified based on criteria given in the text.
Table 2 summarizes the mean onset latencies and magnitudes of PStEs for muscles at different joints. Not all sites with PStEs at 30 and 60 μA had PStEs at 15 μA. Only the data from sites with PStEs at all three stimulus intensities were used to analyze the relationship between stimulus intensity and the latency and magnitude of effects, and data from all sites were used to analyze the distribution of effects.
Table 2.
Latency and magnitude of PStEs
| Effects Present Across All 3 Stimulus Intensities, 15, 30, and 60 μA | ||||||||||||
|---|---|---|---|---|---|---|---|---|---|---|---|---|
| Onset Latency, ms |
Magnitude, % |
|||||||||||
| PStF |
15 μA |
30 μA |
60 μA |
15 μA |
30 μA |
60 μA |
||||||
| Muscle | n | Mean | n | Mean | n | Mean | n | Mean | n | Mean | n | Mean |
| Hip | 24 | 12.6 ± 1.8 | 24 | 12.7 ± 1.9 | 24 | 12.7 ± 2.2 | 24 | 20.9 ± 8.0 | 24 | 32.3 ± 15.2 | 24 | 51.6 ± 24.4 |
| Knee | 54 | 13.8 ± 1.4 | 54 | 13.7 ± 1.4 | 54 | 13.5 ± 1.4 | 54 | 18.1 ± 11.2 | 54 | 32.6 ± 20.0 | 54 | 55.7 ± 33.4 |
| Ankle | 34 | 16.8 ± 2.1 | 34 | 16.4 ± 2.0 | 34 | 16.0 ± 2.3 | 34 | 18.5 ± 14.3 | 34 | 28.7 ± 17.8 | 34 | 46.5 ± 35.2 |
| Digit | 8 | 16.1 ± 1.0 | 8 | 15.3 ± 0.9 | 8 | 15.3 ± 0.7 | 8 | 16.2 ± 5.6 | 8 | 26.6 ± 10.9 | 8 | 39.5 ± 13.3 |
| Intrinsic | 58 | 17.1 ± 0.9 | 58 | 17.2 ± 1.0 | 58 | 16.9 ± 0.6 | 58 | 37.8 ± 30.6 | 58 | 69.6 ± 37.7 | 58 | 130.8 ± 70.2 |
| Total | 178 | 15.4 ± 2.3 | 178 | 15.3 ± 2.3 | 178 | 15.1 ± 2.3 | 178 | 24.9 ± 21.6 | 178 | 43.6 ± 31.6 | 178 | 77.1 ± 60.4 |
| Onset Latency, ms |
Magnitude, % |
|||||||||||
| PStS |
15 μA |
30 μA |
60 μA |
15 μA |
30 μA |
60 μA |
||||||
| Muscle | n | Mean | n | Mean | n | Mean | n | Mean | n | Mean | n | Mean |
| Hip | 1 | 15.0 | 1 | 15.0 | 1 | 15.0 | 1 | −23.8 | 1 | −22.1 | 1 | −21.0 |
| Knee | 0 | 0 | 0 | 0 | 0 | 0 | ||||||
| Ankle | 9 | 17.6 ± 1.2 | 9 | 17.8 ± 1.1 | 9 | 17.8 ± 1.1 | 9 | −15.8 ± 3.2 | 9 | −22.3 ± 7.0 | 9 | −30.2 ± 8.4 |
| Digit | 0 | 0 | 0 | 0 | 0 | 0 | ||||||
| Intrinsic | 2 | 19.0 ± 0.7 | 2 | 18.5 ± 0.7 | 2 | 18.8 ± 1.1 | 2 | −12.8 ± 1.8 | 2 | −18.7 ± 1.1 | 2 | −21.3 ± 0.6 |
| Total | 12 | 17.6 ± 1.4 | 12 | 17.7 ± 1.3 | 12 | 17.7 ± 1.4 | 12 | −15.9 ± 3.9 | 12 | −21.7 ± 6.2 | 12 | −28.0 ± 8.2 |
| All Effects | ||||||||||||
| Onset Latency, ms |
Magnitude, % |
|||||||||||
| PStF | 15 μA |
30 μA |
60 μA |
15 μA |
30 μA |
60 μA |
||||||
| Muscle | n | Mean | n | Mean | n | Mean | n | Mean | n | Mean | n | Mean |
| Hip | 30 | 12.9 ± 1.8 | 77 | 13.2 ± 2.4 | 205 | 13.3 ± 2.0 | 30 | 19.6 ± 7.9 | 77 | 22.9 ± 11.9 | 205 | 28.6 ± 20.0 |
| Knee | 64 | 14.0 ± 1.6 | 203 | 13.9 ± 1.5 | 454 | 14.1 ± 1.8 | 64 | 17.3 ± 10.6 | 203 | 21.6 ± 13.5 | 454 | 31.3 ± 21.7 |
| Ankle | 44 | 17.2 ± 2.6 | 119 | 16.3 ± 2.3 | 284 | 16.0 ± 2.5 | 44 | 20.3 ± 13.9 | 119 | 23.7 ± 13.9 | 284 | 30.7 ± 20.1 |
| Digit | 11 | 16.2 ± 1.1 | 60 | 15.6 ± 1.4 | 139 | 15.5 ± 1.7 | 11 | 14.3 ± 5.9 | 60 | 18.4 ± 6.7 | 139 | 26.8 ± 12.6 |
| Intrinsic | 60 | 17.1 ± 0.9 | 116 | 17.3 ± 1.5 | 215 | 17.1 ± 1.2 | 60 | 37.0 ± 30.4 | 116 | 49.6 ± 35.4 | 215 | 67.0 ± 60.4 |
| Total | 209 | 15.5 ± 2.5 | 575 | 15.2 ± 2.4 | 1,297 | 15.0 ± 2.3 | 209 | 23.8 ± 20.5 | 575 | 27.6 ± 22.4 | 1,297 | 36.2 ± 33.6 |
| Onset Latency, ms |
Magnitude, % |
|||||||||||
| PStS |
15 μA |
30 μA |
60 μA |
15 μA |
30 μA |
60 μA |
||||||
| Muscle | n | Mean | n | Mean | n | Mean | n | Mean | n | Mean | n | Mean |
| Hip | 6 | 18.1 ± 3.8 | 18 | 18.4 ± 3.5 | 70 | 15.3 ± 3.2 | 6 | −15.5 ± 5.1 | 18 | −15.5 ± 4.2 | 70 | −17.5 ± 6.0 |
| Knee | 10 | 17.2 ± 1.5 | 11 | 17.4 ± 3.8 | 23 | 17.6 ± 3.1 | 10 | −16.3 ± 8.9 | 11 | −19.0 ± 4.6 | 23 | −19.9 ± 9.8 |
| Ankle | 22 | 20.1 ± 3.6 | 38 | 18.8 ± 2.6 | 69 | 19.9 ± 2.8 | 22 | −16.4 ± 4.1 | 38 | −19.4 ± 6.7 | 69 | −21.1 ± 6.9 |
| Digit | 1 | 20.0 | 6 | 20.5 ± 3.9 | 29 | 18.4 ± 2.3 | 1 | −7.6 | 6 | −16.0 ± 6.9 | 29 | −16.7 ± 4.6 |
| Intrinsic | 11 | 20.8 ± 1.5 | 32 | 20.8 ± 1.9 | 45 | 21.3 ± 2.5 | 11 | −14.9 ± 2.7 | 32 | −17.4 ± 5.1 | 45 | −17.9 ± 5.6 |
| Total | 50 | 19.4 ± 3.1 | 105 | 19.3 ± 3.0 | 236 | 18.4 ± 3.6 | 50 | −15.8 ± 5.2 | 105 | −17.8 ± 5.8 | 236 | −18.8 ± 6.7 |
Values are mean ± SD. %, peak percent change from baseline.
Figure 2 shows the location of electrode penetrations and the complete hindlimb representation maps for each monkey at 15, 30, and 60 μA. Sites with effects in StTAs of hindlimb muscles are represented. If an effect were not present in StTAs at 60 μA, then we applied high-frequency ICMS to define the representation as no effect, trunk, tail, or forelimb. For simplicity, these representations are only shown in the 60-μA maps. Additionally, cutaneous sensory responses, judged to be from S1, are indicated. As expected, the size of the hindlimb representation expanded with stimulus intensity in both monkeys. There was also a clear difference in the size of the representations between the two monkeys at 15 and 30 μA, with monkey F showing a more limited representation at the lower intensities but expanding at 60 μA to match more closely the size of the representation in monkey C. This difference can be attributed to the fact that the effects in monkey C were considerably stronger than those in monkey F. At 60 μA, the total size of the representation occupied an area of ∼8 × 10 mm. The representation was largely on the medial convexity of the precentral gyrus, with only a small extension over the midline, down the medial wall of the hemisphere. The hindlimb representation was bounded anteriorly, laterally, and medially by a trunk representation. Tail representation was located on the medial wall, extending onto the convexity of the medial hemisphere. The hindlimb representation extended 12–13 mm anterior to the extrapolated intersection of the CS and the midline.
Latency of effects.
At 15 μA, the overall mean PStF onset latency was 15.5 ± 2.5 ms compared with a mean PStS onset latency of 19.4 ± 3.1 ms (Table 2, see All Effects). These latencies were similar in both monkeys. Changes in onset latency of effects with stimulus intensity are best appreciated from a subset of cortical sites in which effects were present at each of the three stimulus intensities. As stimulus intensity was increased (15 to 30 to 60 μA), there was a slight decrease in the mean PStF onset latency (Table 2, see Effects Present Across All 3 Stimulus Intensities), although these changes did not achieve statistical significance. Overall, mean PStF onset latency increased the more distal the joint of a muscle's action (Table 2, see All Effects). At 15 μA, the PStF onset latencies of the proximal muscles (hip and knee) were significantly different from all other muscles (P < 0.05–0.001, one-way ANOVA), whereas there were no significant differences among the latencies of the distal muscles (ankle, digit, and intrinsic foot). At 30 and 60 μA, all PStF onset latency differences between joints were significant (P < 0.05–0.001, one-way ANOVA), except ankle vs. digit at 30 μA. Overall, the mean PStS onset latency increased the more distal the joint of a muscle's action (Table 2, see All Effects). At 30 μA, the PStS onset latency of the intrinsic muscles was significantly greater than that of the hip, knee, and ankle muscles (P < 0.05-0.01, one-way ANOVA). At 60 μA, all PStS onset latency differences among joints were significant (P < 0.01-0.001, one-way ANOVA), except digit vs. knee, digit vs. ankle, and intrinsic vs. ankle. The data set for mean onset latency of PStS effects at different intensities was too small for meaningful statistical comparisons of effects across stimulus intensities (Table 2, see Effects Present Across All 3 Stimulus Intensities).
Figure 3 shows the distribution of PStF onset latencies for muscles acting at different joints of the hindlimb at 15, 30, and 60 μA. The distributions at each joint are mostly unimodal, although the hip, knee, and ankle latencies do have a suggestion of bimodality at some stimulus intensities that is also evident in the overall results for all muscles. The intrinsic muscles have the narrowest distribution at all stimulus intensities with no tendency toward bimodality. Also noteworthy is the fact that the latency distributions, especially for ankle, knee, and hip muscles, extend into the longer latency range. Although slower conduction velocity corticospinal neurons may contribute to these longer latency effects, the results also serve to emphasize the potential contribution of nonmonosynaptic linkages. Potential nonmonosynaptic linkages to hindlimb motoneurons include spinal interneurons; cortico-bulbar projections, for example, the cortico-reticulospinal system (Lemon 2008); as well as propriospinal pathways, although evidence for a lumbar propriospinal system is much more limited compared with the cervical propriospinal system (Pierrot-Deseilligny and Burke 2005).
Fig. 3.

Distribution of PStF onset latencies for muscles at the hip, knee, ankle, digit, intrinsic foot joints, and all muscles at 15, 30, and 60 μA stimuli. The values given in parentheses for each graph represent the means ± SD of the onset latency of the PStF.
Magnitude of effects.
At 15 μA, the mean PStF magnitude, expressed as ppi above baseline, was 23.8 ± 20.5 compared with −15.8 ± 5.2 for PStS (Table 2, see All Effects). The mean PStF magnitude increased significantly as stimulus intensity increased (Table 2, see Effects Present Across All 3 Stimulus Intensities; P < 0.001, one-way ANOVA). Between 15 and 60 μA, PStF magnitude increased linearly with stimulus intensity at a rate of 1.16 ppi/μA. Magnitudes based on all effects (Table 2) are not appropriate for examining relationships between magnitude and intensity, because higher intensity stimulation recruits new muscles with weak effects that dilute the mean magnitude. At all stimulus intensities, the magnitude of PStF was strongest in intrinsic muscles (approximately double) compared with all other muscle groups, and the differences were statistically significant in all cases (Table 2, see All Effects; P < 0.01-0.001, one-way ANOVA). The magnitudes of PStF in the digit, ankle, knee, and hip muscles were very similar, and the small differences observed were not statistically significant. The magnitudes of PStS were very similar in all muscles (Table 2, All Effects). Only at 60 μA did any differences become statistically significant, with the magnitude of PStS stronger in the ankle muscles compared with the hip, digit, and intrinsic muscles (P < 0.05, one-way ANOVA). The data set for magnitude of PStS effects at different intensities was too small for meaningful statistical comparisons of effects across stimulus intensities (Table 2).
Figure 4 shows the distribution of PStF magnitude at 15, 30, and 60 μA for muscles acting at different joints of the hindlimb. Similar trends are seen at all stimulus intensities. At all joints, the weakest effects are the most common, as evidenced by the skewed distributions. Muscles at all joints, except the intrinsic muscles, have a narrow range of magnitudes, focused heavily toward weak effects. At 60 μA, the vast majority of effects in all muscles, except intrinsic foot muscles, had magnitudes <50 ppi. In contrast, 46% of effects in intrinsic foot muscles had a magnitude of 50 ppi or greater. Moreover, the maximum PStF magnitude observed at each stimulus intensity was from one of the intrinsic foot muscles (149 ppi, FHB, 15 μA; 188 ppi, EDB, 30 μA; 353 ppi, EDB, 60 μA).
Fig. 4.

Distribution of PStF magnitudes for muscles at the hip, knee, ankle, digit, intrinsic foot joints, and all muscles at 15, 30, and 60 μA stimuli. The magnitudes are expressed as ppi above baseline. The values given in parentheses for each group represent the means ± SD of the magnitude of the PStF.
There was a consistent trend among muscles at all joints for shorter PStF onset latencies to be associated with stronger magnitudes. This correlation was statistically significant at the hip, knee, and ankle joints at 60 μA (P < 0.05-0.01, one-way ANOVA).
Distribution of PStEs.
Figure 5, A and B, shows the distributions of PStF and PStS effects in hip, knee, ankle, digit, and intrinsic foot muscles at 15, 30, and 60 μA. Of 209 PStF effects at 15 μA, 55% were in distal muscles, including 21% in ankle, 5% in digit, and 29% in intrinsic foot muscles. Forty-five percent of PStF effects were in proximal muscles, including 14% in hip and 31% in knee muscles (Table 2, see All Effects). At 30 and 60 μA, the number of PStF effects in distal and proximal muscles was nearly equal (51/49%, respectively, at 30 μA and 49/51% at 60 μA). In contrast, inhibitory effects showed a clear preference favoring distal muscles. Of 50 PStS effects at 15 μA, 68% were in distal muscles, including 44% in ankle, 2% in digit, and 22% in intrinsic foot muscles. Thirty-two percent of PStS effects were in proximal muscles, including 12% in hip and 20% in knee muscles. Similar trends were observed at 30 and 60 μA. The numbers of recorded distal and proximal muscles were nearly equal (9 vs. 10, respectively) and cannot account for these differences. Furthermore, electrode tracks were placed systematically throughout the entire hindlimb cortical representation so there was no bias to sample preferentially one part of the representation over another part.
Fig. 5.

Distribution of PStF (A) and poststimulus suppression (PStS; B) in hip, knee, ankle, digit, and intrinsic foot muscles at 15, 30, and 60 μA stimuli. Distribution of PStF (C) and PStS (D) after normalizing for the number of recorded muscles at each joint (dividing the total number of effects obtained by the number of muscles recorded at each joint).
Different numbers of muscles were recorded at each joint (four hip, six knee, five ankle, two digit, and two intrinsic foot muscles). Figure 5, C and D, shows the distributions of PStF and PStS effects at each joint after normalizing for the number of muscles sampled. After normalizing, it becomes clear that PStF effects are most common in intrinsic muscles at all stimulus intensities. The number of PStF effects was similar across all other muscles groups. Suppression effects were more variable than facilitation effects; however, it is clear that there tended to be fewer suppression effects in the knee muscles than other muscle groups at 30 and 60 μA. These differences were consistent in the data collected from each of the two monkeys.
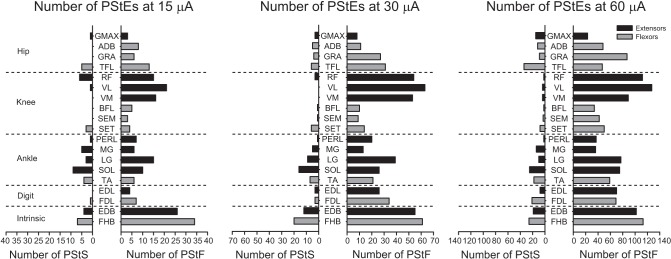
Differences in the distribution of effects to flexor and extensor muscles were also evident both in the summed effects for each muscle group after normalizing for number of muscles tested (Fig. 6) and in the individual muscle data (Fig. 7). At the knee joint, facilitation of the extensors dominated, whereas at the hip joint, the flexors were more commonly facilitated. This was true at all stimulus intensities. By taking into account all stimulus intensities, PStF was similarly distributed between flexor and extensor muscles at distal joints. PStF was much more common in all muscle groups and all intensities than PStS (Fig. 7). However, it should be noted that we only counted PStS effects if the effect was a pure suppression and not preceded by PStF. In many cases, a clear dip followed the PStF effect. These biphasic effects were not included for suppression because of uncertainty about the underlying mechanism (real inhibition vs. postexcitatory suppression) and uncertainties in measuring latency and magnitude. The prominence of facilitation effects in the intrinsic muscles is also evident (Figs. 6 and 7), rivaled only by effects in knee extensor muscles at higher intensities. The smaller number of PStS effects limited interpretation of suppression effects in flexors and extensors. Nevertheless, whereas suppression was, overall, approximately equally common in flexors and extensors at 15 μA (and other intensities), the distribution was variable when categorized by joint. It is noteworthy that suppression was more common in SOL at 15 μA than any other muscle (Fig. 7) (Hudson et al. 2013). At higher intensities, only two additional muscles (FHB and TFL) had inhibitory effects in the same range as SOL.
Fig. 6.

Distribution of PStF (A, C, and E) and PStS (B, D, and F) in extensor and flexor muscles of the hip, knee, ankle, digit, and intrinsic foot joints at 15, 30, and 60 μA stimuli. Distributions have been normalized for the number of recorded muscles at each joint. Extensors, dark bars; flexors, light bars.
Fig. 7.
Distribution of PStF (right) and PStS (left) obtained from 19 muscles of the hindlimb. Dotted lines separate muscles belonging to different muscle groups (joints). Muscle abbreviations are the same as in Fig. 1 legend. Data show the total number of effects obtained and are not normalized for the number of muscles of each group recorded. Extensors, dark bars; flexors, light bars.
DISCUSSION
This study analyzes the cortical output from M1 to 19 muscles of the hindlimb in terms of the latency, magnitude, and distribution of PStF and PStS effects. A similar study of the forelimb from our laboratory was based on StTA, done in a very similar way, except only one intensity (15 μA) was used (Park et al. 2004). It was evident early in our data collection that 15 μA stimuli were substantially less effective in hindlimb cortex than in forelimb cortex. We had far fewer effects, and the effects overall were weaker. Consequently, we performed StTA using three stimulus intensities (15, 30, and 60 μA). Our results are significant in presenting a comprehensive data set on the properties of cortical output to hindlimb muscles at each joint from the hip to intrinsic foot muscles. The results show that a clear, short-latency PStF can be elicited using StTA of EMG activity, and this effect can be used to define the borders of the hindlimb representation in M1. An important aspect of this study is that the data can be compared directly with data from forelimb M1, obtained using very similar methods.
Comparison of hindlimb and forelimb M1 properties.
Table 3 compares the key properties of hindlimb and forelimb M1 output based on StTA data at 15 μA. Systematic StTA data on forelimb M1 cortex (Park et al. 2004) are not available at the other stimulus intensities. Whereas clear PStEs were obtained from hindlimb cortex, their magnitude overall was substantially weaker than effects from forelimb cortex for most muscle groups. However, it is interesting that there was considerable variability by joint in the extent to which forelimb and hindlimb PStF differed. The greatest difference was in digit muscles located in the forearm or lower leg where forelimb PStF was more than five times greater than hindlimb PStF. The difference in PStF magnitude at all other joints was considerably smaller. PStF, in muscles acting at the wrist, was approximately three and one-half times greater than that of muscles acting at the ankle. The difference for muscles acting at the knee/elbow was smaller yet (twofold), and muscles at the hip and shoulder were essentially equal in magnitude. The intrinsic foot/hand muscles are an interesting case, where the difference in magnitude of PStF for hand muscles is 2.2 times greater than foot muscles—less than the difference for nonintrinsic digit muscles.
Table 3.
Comparison of M1 hindlimb with forelimb StTA (15 μA) data
| Hindlimb | Forelimb* | |
|---|---|---|
| Magnitude of PStF (ppi) | ||
| Hip/shoulder | 19.6 ± 7.9 (30) | 24.1 ± 10.5 (159) |
| Knee/elbow | 17.3 ± 10.6 (64) | 34.6 ± 22.5 (405) |
| Ankle/wrist | 20.3 ± 13.9 (44) | 70.4 ± 79.6 (349) |
| Digit | 14.3 ± 5.9 (11) | 77.0 ± 96.4 (350) |
| Intrinsic foot/hand | 37.0 ± 30.4 (60) | 82.1 ± 69.8 (135) |
| Onset latency of PStF (ms) | ||
| Hip/shoulder | 12.9 ± 1.8 (30) | 9.5 ± 2.3 (159) |
| Knee/elbow | 14.0 ± 1.6 (64) | 9.6 ± 1.8 (405) |
| Ankle/wrist | 17.2 ± 2.6 (44) | 8.8 ± 1.4 (349) |
| Digit | 16.2 ± 1.1 (11) | 8.9 ± 1.3 (350) |
| Intrinsic foot/hand | 17.1 ± 0.9 (60) | 10.1 ± 0.9 (135) |
| Distribution of PStF by joint (%)† | ||
| Hip/shoulder | 12 (30) | 11 (159) |
| Knee/elbow | 17 (64) | 19 (405) |
| Ankle/wrist | 15 (44) | 24 (349) |
| Digit | 9 (11) | 24 (350) |
| Intrinsic foot/hand | 47 (60) | 23 (135) |
| Distribution of PStS by joint (%)† | ||
| Hip/shoulder | 11 (6) | 15 (109) |
| Knee/elbow | 12 (10) | 20 (199) |
| Ankle/wrist | 35 (22) | 24 (166) |
| Digit | 4 (1) | 21 (147) |
| Intrinsic foot/hand | 40 (11) | 20 (58) |
M1, primary motor cortex. Parentheses give number of observations. Magnitude expressed as mean peak percentage increase (ppi) ± SD.
Data adapted from Park et al. 2004.
Data normalized by number of recorded muscles.
There were additional differences in forelimb and hindlimb PStF. The magnitude of forelimb PStF increased consistently at each joint in going from the most proximal muscles (shoulder muscles) to the most distal muscles (intrinsic hand muscles). PStF in hindlimb muscles did not show this consistent increase. Rather, PStF magnitude was similar at all joints except the intrinsic foot muscles, which had a magnitude approximately double that of all of the other muscles.
How can the differences in magnitude of PStF effects in hindlimb muscles compared with forelimb muscles be interpreted? Using 0.5 mA surface anodal stimulation, Jankowska et al. (1975) reported that cortically evoked excitatory postsynaptic potentials (EPSPs) in distal hindlimb motoneurons ranged from 0.2 to 2 mV in amplitude, with mean values for different motoneurons groups of 0.15–0.6 mV. Motoneurons belonging to different muscle groups were identified by stimulating peripheral nerves. Although directly comparable data do not exist for the forelimb, Clough et al. (1968) reported EPSP amplitudes ranging from 0.2 to 9.5 mV for distal muscles of the forelimb. However, it was noted that only five motoneurons had EPSPs >5 mV. Mean values for different motoneuron groups ranged from 1.6 to 3.4 mV, with motoneurons of the extensor digitorum communis and intrinsic hand muscles showing the largest EPSPs. However, these data were based on maximal EPSPs obtained by increasing stimulus intensity until amplitude plateaued, making direct comparison with the hindlimb data difficult. Intensities up to 11.8 mA were used, although it was noted that EPSPs generally became maximal at much lower intensities. Given the difference in methods of the forelimb and hindlimb EPSP studies, comparisons are tenuous at best. Nevertheless, comparing the mean EPSP amplitudes suggests that hindlimb EPSPs are weaker than forelimb EPSPs. Our data provide a direct comparison of the strength of PStF across a wide range of muscles in the forelimb and hindlimb. The results show that the synaptic linkage to forelimb motoneurons from M1 cortex, compared with hindlimb, is stronger for muscles at all joints except the hip/shoulder joints. Stronger PStF could result from a greater density of corticospinal neurons in the cortex, greater connectivity among cortical neurons, and/or a more robust synaptic linkage in the spinal cord. Based on the work of Strick and colleagues (Dum and Strick 1991; He et al. 1993, 1995), the density of corticospinal neurons in forelimb and hindlimb cortex is similar [see also Cheney et al. (2004); Table 1]. Another potential contributing factor might be differences in cortical connectivity within forelimb and hindlimb cortex. If cortical connectivity were greater in forelimb cortex, then physiological spread of activation from stimulation might result in excitation of a greater number of neurons for the same stimulus intensity. Although it is known that ICMS activates some cortical cells at a distance from the site of stimulation through physiological spread (Histed et al. 2009; Tehovnik et al. 2006), the extent to which this occurs should be reduced substantially with the single-pulse ICMS method (StTA) used in this study compared with high-frequency ICMS. Of the factors that could influence the strength of the synaptic linkage, it seems mostly likely that the greater amplitude of forelimb PStF is due, in large part, to a greater monosynaptic input to forelimb compared with hindlimb motoneurons.
Distribution of PStF to hindlimb compared with forelimb muscles.
The distribution of output effects from M1 cortex to different muscle groups of the hindlimb and forelimb provides another interesting contrast (Table 3). After normalizing for the number of muscles recorded at each joint, the percent of forelimb PStF effects in wrist, digit, and intrinsic hand muscles was essentially equal. The number of effects dropped off slightly for elbow muscles and quite drastically for shoulder muscles. In contrast, the percent of hindlimb PStF effects was similar across hip, knee, and ankle muscles but was three and one-half times greater for intrinsic foot muscles. The low number for nonintrinsic digit muscles at 15 μA is puzzling (Table 3). At 30 and 60 μA, the relative number of PStF effects in nonintrinsic digit muscles was nearly the same as the ankle, knee, and hip (Fig. 5C).
What stands out about the data in Table 3 is that unlike the forelimb, hindlimb intrinsic foot muscles had a disproportionately large percentage (47%) of the total number of effects obtained (Table 3). The number of effects obtained for each muscle group will be dependent on the size of the representation of the muscles in M1 cortex—the greater the territory devoted to a particular muscle group, the larger the number of effects that will be observed. Of course, this assumes that the strength of the linkage is above a minimum threshold for detection.
Interpretation of differences in effects at forelimb and hindlimb.
With the assumption that monosynaptic linkages will produce the strongest PStF effects compared with polysynaptic linkages, just as they produce the strongest effects in spike-triggered averages of EMG activity, the differences in magnitude of PStF for hindlimb muscles compared with forelimb muscles might be explained as differences in the strength of the monosynaptic component of the synaptic linkage to motoneurons. The data would then suggest a clear gradation in the contribution of the monosynaptic linkage to forelimb motoneurons in going from the most proximal to the most distal muscles, with the most distal muscles receiving the strongest monosynaptic input. Based on the magnitude of PStF across muscles, this gradation of magnitude does not exist for the hindlimb. The results suggest that the strength of the synaptic linkage is similar for motoneurons at all joints except those of the intrinsic foot muscles, which have a much stronger linkage, possibly related to a much more prominent monosynaptic component.
GRANTS
Support for this work was provided by the National Institute of Neurological Disorders and Stroke (Grant NS064054) and National Institute of Child Health and Human Development (Grant HD02528), the Kathleen M. Osborn Endowment (to P. D. Cheney), and the University of Kansas Medical Center Biomedical Research Training Program (to D. M. Griffin).
DISCLOSURES
The authors declare that there are no conflicts of interest.
AUTHOR CONTRIBUTIONS
Author contributions: P.D.C. conception and design of research; H.M.H. and A.B-S. performed experiments; H.M.H., D.M.G., A.B-S., and P.D.C. analyzed data; H.M.H., D.M.G., A.B-S., and P.D.C. interpreted results of experiments; H.M.H. prepared figures; H.M.H. drafted manuscript; H.M.H., D.M.G., and P.D.C. edited and revised manuscript; H.M.H., D.M.G., A.B-S., and P.D.C. approved final version of manuscript.
ACKNOWLEDGMENTS
The authors thank Ian Edwards for his expert electronics, computer, and instrumentation assistance.
Present address of H. M. Hudson: Univ. of Minnesota, Dept. of Neurology, 2001 6th St., SE, LRB 419, Minneapolis, MN 55455.
Present address of D. M. Griffin: Univ. of Pittsburgh School of Medicine, Systems Neuroscience Institute, 3501 Fifth Ave., BST3 4074, Pittsburgh, PA 15260.
REFERENCES
- Asanuma H, Hongo T, Jankowska E, Marcus S, Shinoda Y, Zarzecki P. Pattern of projections of individual pyramidal tract neurons to the spinal cord of the monkey. J Physiol (Paris) 74: 235–236, 1978. [PubMed] [Google Scholar]
- Asanuma H, Rosén I. Topographical organization of cortical efferent zones projecting to distal forelimb muscles in the monkey. Exp Brain Res 14: 243–256, 1972. [DOI] [PubMed] [Google Scholar]
- Asanuma H, Zarzecki P, Jankowska E, Hongo T, Marcus S. Projection of individual pyramidal tract neurons to lumbar motor nuclei of the monkey. Exp Brain Res 34: 73–89, 1979. [DOI] [PubMed] [Google Scholar]
- Baker SN, Oliver E, Lemon RN. An investigation of the intrinsic circuitry of the motor cortex of the monkey using intra-cortical microstimulation. Exp Brain Res 123: 397–411, 1998. [DOI] [PubMed] [Google Scholar]
- Bawa P, Chalmers GR, Stewart H, Eisen AA. Responses of ankle extensor and flexor motoneurons to transcranial magnetic stimulation. J Neurophysiol 88: 124–132, 2002. [DOI] [PubMed] [Google Scholar]
- Bernhard CG, Bohm E. Cortical representation and functional significance of the cortico-motoneuronal system. AMA Arch Neurol Psychiatry 72: 473–502, 1954. [DOI] [PubMed] [Google Scholar]
- Bernhard CG, Bohm E, Petersen I. Investigations on the organization of the corticospinal system in monkeys (Macaca mulatta). Acta Physiol Scand 29: 79–105, 1953. [Google Scholar]
- Brouwer B, Ashby P. Corticospinal projections to the lower limb motoneurons of man. Exp Brain Res 89: 649–654, 1992. [DOI] [PubMed] [Google Scholar]
- Brouwer B, Ashby P. Corticospinal projections to upper and lower limb spinal motoneurons in man. Electroencephalogr Clin Neurophysiol 76: 509–519, 1990. [DOI] [PubMed] [Google Scholar]
- Buys EJ, Lemon RN, Mantel GW, Muir RB. Selective facilitation of different hand muscles by single corticospinal neurons in the conscious monkey. J Physiol 381: 529–549, 1986. [DOI] [PMC free article] [PubMed] [Google Scholar]
- Cheney PD, Belhaj-Saïf A, Boudrias MH. Principles of corticospinal system organization and function. In: Clinical Neurophysiology of Motor Neuron Diseases: Handbook of Clinical Neurophysiology Series, edited by Eisen A. New York: Elsevier Science, 2004, vol. 4, p. 59–96. [Google Scholar]
- Cheney PD, Fetz EE. Functional classes of primate corticomotoneuronal cells and their relation to active force. J Neurophysiol 44: 773–791, 1980. [DOI] [PubMed] [Google Scholar]
- Churchland MM, Cunningham JP, Kaufman MT, Foster JD, Nuyujukian P, Ryu SI, Shenoy KV. Neural population dynamics during reaching. Nature 487: 51–56, 2012. [DOI] [PMC free article] [PubMed] [Google Scholar]
- Clough JF, Kernell D, Phillips CG. The distribution of monosynaptic excitation from the pyramidal tract and from primary spindle afferents to motoneurones of the baboon's hand and forearm. J Physiol 198: 145–166, 1968. [DOI] [PMC free article] [PubMed] [Google Scholar]
- Dancause N, Barbay S, Frost SB, Plautz EJ, Chen D, Zoubina EV, Stowe AM, Nudo RJ. Extensive cortical rewiring after brain injury. J Neurosci 24: 10167–10179, 2005. [DOI] [PMC free article] [PubMed] [Google Scholar]
- Drew T, Jiang W, Widajewicz W. Contributions of the motor cortex to the control of the hindlimbs during locomotion in the cat. Brain Res Brain Res Rev 40: 178–191, 2002. [DOI] [PubMed] [Google Scholar]
- Dum RP, Strick PL. The origin of corticospinal projections from the premotor areas in the frontal lobe. J Neurosci 11: 667–689, 1991. [DOI] [PMC free article] [PubMed] [Google Scholar]
- Edgley SA, Eyre JA, Lemon RN, Miller S. Comparison of activation of corticospinal neurons and spinal motor neurons by magnetic and electrical transcranial stimulation in the lumbosacral cord of the anaesthetized monkey. Brain 120: 839–853, 1997. [DOI] [PubMed] [Google Scholar]
- Graziano MS, Aflalo TN, Cooke DF. Arm movements evoked by electrical stimulation in the motor cortex of monkeys. J Neurophysiol 94: 4209–4023, 2005. [DOI] [PubMed] [Google Scholar]
- Hatanaka N, Nambu A, Yamashita A, Takada M, Tokuno H. Somatotopic arrangement and corticocortical inputs of the hindlimb region of the primary motor cortex in the macaque monkey. Neurosci Res 40: 9–22, 2001. [DOI] [PubMed] [Google Scholar]
- He SQ, Dum RP, Strick PL. Topographic organization of corticospinal projections from the frontal lobe: motor areas on the lateral surface of the hemisphere. J Neurosci 13: 952–980, 1993. [DOI] [PMC free article] [PubMed] [Google Scholar]
- He SQ, Dum RP, Strick PL. Topographic organization of corticospinal projections from the frontal lobe: motor areas on the medial surface of the hemisphere. J Neurosci 15: 3284–3306, 1995. [DOI] [PMC free article] [PubMed] [Google Scholar]
- Histed MH, Bonin V, Reid RC. Direct activation of sparse, distributed populations of cortical neurons by electrical microstimulation. Neuron 63: 508–522, 2009. [DOI] [PMC free article] [PubMed] [Google Scholar]
- Hudson HM, Griffin DM, Belhaj-Saïf A, Lee SP, Cheney PD. Cortical output to fast and slow muscles of the ankle in the rhesus macaque. Front Neural Circuits 7: 33, 2013. [DOI] [PMC free article] [PubMed] [Google Scholar]
- Hudson HM, Griffin DM, Belhaj-Saïf A, Lee SP, Cheney PD. Methods for chronic recording of EMG activity from large numbers of hindlimb muscles in awake rhesus macaques. J Neurosci Methods 189: 153–161, 2010. [DOI] [PMC free article] [PubMed] [Google Scholar]
- Jankowska E, Padel Y, Tanaka R. Projections of pyramidal tract cells to α-motoneurons innervating hind-limb muscles in the monkey. J Physiol 249: 637–667, 1975. [DOI] [PMC free article] [PubMed] [Google Scholar]
- Lemon RN. Descending pathways in motor control. Annu Rev Neurosci 31: 195–218, 2008. [DOI] [PubMed] [Google Scholar]
- Lemon RN. Mapping the output functions of motor cortex. In: Signal and Sense, edited by Edelman GM, Gall WE, Cowan WM. New York: Wiley-Liss, 1990, p. 315–355. [Google Scholar]
- Luppino G, Matelli M, Camarda RM, Gallese V, Rizzolatti G. Multiple representations of body movements in mesial area 6 and the adjacent cingulate cortex: an intracortical microstimulation study in the macaque monkey. J Comp Neurol 311: 463–482, 1991. [DOI] [PubMed] [Google Scholar]
- Ma C, He J. A method for investigating cortical control of stand and squat in conscious behavioral monkeys. J Neurosci Methods 192: 1–6, 2010. [DOI] [PubMed] [Google Scholar]
- Macpherson JM, Marangoz C, Miles TS, Wiesendanger M. Microstimulation of the supplementary motor area (SMA) in the awake monkey. Exp Brain Res 45: 410–416, 1982. [DOI] [PubMed] [Google Scholar]
- McKiernan BJ, Marcario JK, Karrer JH, Cheney PD. Corticomotoneuronal postspike effects in shoulder, elbow, wrist, digit, and intrinsic hand muscles during a reach and prehension task. J Neurophysiol 80: 1961–1980, 1998. [DOI] [PubMed] [Google Scholar]
- Mewes K, Cheney PD. Facilitation and suppression of wrist and digit muscles from single rubromotoneuronal cells in the awake monkey. J Neurophysiol 66: 1965–1977, 1991. [DOI] [PubMed] [Google Scholar]
- Mitz AR, Wise SP. The somatotopic organization of the supplementary motor area: intracortical microstimulation mapping. J Neurosci 7: 1010–1021, 1987. [DOI] [PMC free article] [PubMed] [Google Scholar]
- Muir RB, Porter R. The effect of a preceding stimulus on temporal facilitation at corticomotoneuronal synapses. J Physiol 228: 749–763, 1973. [DOI] [PMC free article] [PubMed] [Google Scholar]
- Neafsey EJ. Precentral cortical zones related to flexion and extension in two hindlimb movements in the monkey. Brain Res 198: 453–459, 1980. [DOI] [PubMed] [Google Scholar]
- Park MC, Belhaj-Saïf A, Cheney PD. Properties of primary motor cortex output to forelimb muscles in rhesus macaques. J Neurophysiol 92: 2968–2984, 2004. [DOI] [PubMed] [Google Scholar]
- Park MC, Belhaj-Saïf A, Gordon M, Cheney PD. Consistent features in the forelimb representation of primary motor cortex in rhesus macaques. J Neurosci 21: 2784–2792, 2001. [DOI] [PMC free article] [PubMed] [Google Scholar]
- Paxinos G, Huang XF, Toga AW. The Rhesus Monkey Brain in Stereotaxic Coordinates. San Diego, CA: Academic, 2000. [Google Scholar]
- Perez MA, Lungholt BA, Nyborg K, Nielsen JB. Motor skill training induces changes in the excitability of the leg cortical area in healthy humans. Exp Brain Res 159: 197–205, 2004. [DOI] [PubMed] [Google Scholar]
- Phillips CG, Porter R. The pyramidal projection to motoneurones of some muscle groups of the baboon's forelimb. In: Progress in Brain Research. Physiology of Spinal Neurons, edited by Eccles JC, Schade JP. Amsterdam: Elsevier, 1964, vol. 12, p. 222–224. [DOI] [PubMed] [Google Scholar]
- Pierrot-Deseilligny E, Burke D. The Circuitry of the Human Spinal Cord. Cambridge, UK: Cambridge University Press, 2005, p. 490–510. [Google Scholar]
- Plautz EJ, Milliken GW, Nudo RJ. Effects of repetitive motor training on movement representations in adult squirrel monkeys: role of use versus learning. Neurobiol Learn Mem 74: 27–55, 2000. [DOI] [PubMed] [Google Scholar]
- Preston JB, Shende MC, Uemura K. The motor cortex-pyramidal system: patterns of facilitation and inhibition on motoneurons innervating limb musculature of cat and baboon and their possible adaptive significance. In: Neurophysiological Basis of Normal and Abnormal Motor Activities, edited by Yahr MD, Purpura DP. New York: Raven, 1967, p. 61–72. [Google Scholar]
- Preston JB, Whitlock DB. A comparison of motor cortex effects on slow and fast muscle innervations in the monkey. Exp Neurol 7: 327–341, 1963. [DOI] [PubMed] [Google Scholar]
- Preston JB, Whitlock DB. Intracellular potentials recorded from motoneurons following precentral gyrus stimulation in primate. J Neurophysiol 24: 91–100, 1961. [DOI] [PubMed] [Google Scholar]
- Sahrmann SA, Clare MH, Montgomery EB, Landau WM. Motor cortical neuronal activity patterns in monkeys performing several force tasks at the ankle. Brain Res 310: 55–66, 1984. [DOI] [PubMed] [Google Scholar]
- Schieber MH, Rivlis G. A spectrum from pure post-spike effects to synchrony effects in spike-triggered averages of electromyographic activity during skilled finger movements. J Neurophysiol 94: 3325–3341, 2005. [DOI] [PubMed] [Google Scholar]
- Shapovalov AI. Neuronal organization and synaptic mechanisms of supraspinal motor control in vertebrates. Rev Physiol Biochem Pharmacol 72: 1–54, 1975. [DOI] [PubMed] [Google Scholar]
- Shapovalov AI, Kurchavyi GG. Effects of trans-membrane polarization and TEA injection on monosynaptic actions from motor cortex, red nucleus and group Ia afferents on lumbar motoneurons in the monkey. Brain Res 82: 49–67, 1974. [DOI] [PubMed] [Google Scholar]
- Tehovnik EJ, Tolias AS, Sultan F, Slocum WM, Logothetis NK. Direct and indirect activation of cortical neurons by electrical stimulation. J Neurophysiol 96: 512–521, 2006. [DOI] [PubMed] [Google Scholar]
- Thomas SL, Gorassini MA. Increases in corticospinal tract function by treadmill training after incomplete spinal cord injury. J Neurophysiol 94: 2844–2855, 2005. [DOI] [PubMed] [Google Scholar]
- Widajewicz W, Kably B, Drew T. Motor cortical activity during voluntary gait modifications in the cat. II. Cells related to the hindlimbs. J Neurophysiol 72: 2070–2089, 1994. [DOI] [PubMed] [Google Scholar]
- Wise SP, Tanji J. Supplementary and precentral motor cortex: contrast in responsiveness to peripheral input in the hindlimb area of the unanesthetized monkey. J Comp Neurol 195: 433–451, 1981. [DOI] [PubMed] [Google Scholar]