Abstract
ER stress has been implicated in the pathogenesis of both acute and chronic kidney diseases. However, the molecular regulation of ER stress in kidney cells and tissues remains poorly understood. In this study, we examined tunicamycin-induced ER stress in renal proximal tubular cells (RPTC). Tunicamycin induced the phosphorylation and activation of PERK and eIF2α within 2 h in RPTC, which was followed by the induction of GRP78 and CHOP. Consistently, tunicamycin also induced apoptosis in RPTC. Interestingly, mTOR was activated rapidly during tunicamycin treatment, as indicated by phosphorylation of both mTOR and p70S6K. Inhibition of mTOR with rapamycin partially suppressed the phosphorylation of PERK and eIF2a and the induction of CHOP and GRP78 induction during tunicamycin treatment. Rapamycin also inhibited apoptosis during tunicamycin treatment and increased cell survival. Collectively, the results suggest that mTOR plays a regulatory role in ER stress, and inhibition of mTOR may have potential therapeutic effects in ER stress-related renal diseases.
Keywords: endoplasmic reticulum stress, mammmalian target of rapamycin, tunicamycin, apoptosis, renal tubular cells
proteins are synthesized or assembled by ribosomes that are localized mainly on endoplasmic reticulum (ER). Newly synthesized proteins are further subjected to posttranslational modification in ER and Golgi apparatus for proper folding into native configurations, which are required for their trafficking and function. A well-controlled protein assembly and folding machinery in ER is vital to the maintenance of cellular homeostasis and viability. Accordingly, in response to the accumulation of misfolded or unfolded proteins, the cell activates a set of specific signaling pathways to cope with the stress, which is called unfolded protein response (UPR) or ER stress response (10, 28).
To date, three canonical signaling pathways of ER stress have been described (10, 28). First, ER stress may lead to the phosphorylation and activation of inositol-requiring enzyme 1 (IRE1), a unique enzyme with both kinase and RNase activity that is required for specific splicing of Xbp1 (25). Spliced Xbp1 encodes a transcription factor to induce chaperone proteins and UPR genes involved in ER-associated protein degradation (ERAD). Second, upon ER stress, activating transcription factor 6 (ATF6) translocates to the Golgi apparatus, where it is activated by proteolysis. Proteolyzed ATF6 then translocates into the nucleus to transcriptionally induce UPR genes for ERAD. Finally, in the PKR-like endoplasmic reticulum kinase (PERK) pathway, ER stress leads to the phosphorylation and activation of PERK, which further phosphorylates eukaryotic initiation factor 2α (eIF2α), leading to the blockade of global protein synthesis and a concomitant induction of ATF4. ATF4, as a transcription factor, further induces the expression of downstream target genes such as C/EBP homologous protein (CHOP), a proapoptotic protein (27). Therefore, following UPR, the cell mounts a rapid stress response to shut down protein synthesis, enhance protein folding, and promote protein degradation; however, when ER stress is severe and overwhelming, cell death may be initiated via the PERK-CHOP pathway (27).
ER stress has been implicated in the pathogenesis of kidney diseases (4, 5, 12). For example, diabetic nephropathy in mice is associated with the induction of ER stress-related genes such as glucose-regulated protein 78 (GRP78), ATF4, and CHOP; moreover, manipulation of ER stress pharmacologically or genetically results in correlated changes in disease progress (2, 26). In acute kidney injury, ER stress has been documented in experimental models of ischemia-reperfusion injury and nephrotoxicity (22–24). Despite these interesting observations, little is known about the regulation of ER stress in renal cells and tissues under these pathological conditions. In the present study, we examined tunicamycin-induced ER stress response in renal tubular cells. Interestingly, we found that mTOR is activated rapidly during ER stress in these cells and contributes to subsequent cell death, revealing a role of mTOR signaling in ER stress in renal systems.
MATERIALS AND METHODS
Materials.
The rat kidney proximal tubular cell (RPTC) line was originally obtained from Dr.U. Hopfer (Case Western Reserve University, Cleveland, OH) and maintained as described previously (8, 14, 16, 17). Rabbit polyclonal antibodies, including anti-PERK, anti-phospho (Thr980)-PERK, anti-phospho (Ser51)-eIF2, anti-mTOR, anti-phospho (Ser2448)-mTOR, and anti-phospho (Thr389)-p70 S6 kinase, were purchased from Cell Signaling Technology (Beverly, MA); monoclonal mouse anti-GRP78 was from BD Transduction Laboratories (Lexington, KY); mouse monoclonal anti-CHOP was from Cell Signaling Technology; mouse monoclonal anti-β-actin antibody was from Sigma (St. Louis, MO); and all secondary antibodies were from Jackson ImmunoResearch (West Grove, PA). Tunicamycin was purchased from MP Biomedicals (Solon, OH). Rapamycin was purchased from Sigma. Carbobenzoxy-Asp-Glu-Val-Asp-7-amino-4-trifluoromethyl coumarin (DEVD.AFC) and 7-amino-4-trifluoromethyl coumarin (AFC) for caspase assay were purchased from Enzyme Systems Products (Dublin, CA). Vybrant 3-[4,5-dimethylthiazol-2-yl]-2,5-diphenyl tetrazolium bromide (MTT) Cell Proliferation Assay Kit was purchased from Invitrogen (Eugene, OR).
Treatment of RPTC.
RPTC were plated at a density of 1 × 10⁶ cells/dish in 35-mm dishes to reach confluence by the next day. After cells reached confluence, they were incubated with 1 μg/ml tunicamycin in the presence of indicated amounts of rapamycin.
Morphological examination of apoptosis.
Apoptotic cells were identified by their morphology, as described previously (3, 7, 8, 29). Briefly, cells were stained with 10 μg/ml Hoechst 33342 staining for ∼5 min and then examined by phase contrast and fluorescence microscopy. Apoptotic cells showed a characteristic morphology, including shrunken configuration and apoptotic blebs or bodies, and a condensed and fragmented nucleus. Four fields with ∼200 cells/field were examined in each dish to estimate the percentage of apoptosis. Representative images were also recorded.
Measurement of caspase activity.
Caspase activity in cell lysate was measured as described previously (3, 7, 8, 29) using DEVD.AFC, a fluorogenic peptide substrate. Briefly, cells were extracted with 1% Triton X-100. The lysates of 25 μg of protein were added to enzymatic reactions containing 50 μM DEVD.AFC. After 1 h of incubation at 37°C, fluorescence at Ex 360 nm/Em 530 nm was measured. To indicate caspase activity, the fluorescence reading from each sample was calculated into the nanomolar amount of liberated AFC per milligram of protein based on a standard curve constructed using free AFC.
MTT assay.
Vybrant MTT Cell Proliferation Assay Kit from Invitrogen was used to determine cell viability, following the manufacturer's protocol. Briefly, MTT stock solution was added to the cells and incubated for 4 h. The medium was then removed, and DMSO was added to the cells for 10 min of incubation, followed by measurement of absorbance at 540 nm.
Immunoblot analysis.
Immunblot analysis was conducted according to a standard protocol. Briefly, protein concentration of cell lysate was determined using the bicinchoninic acid reagent (Pierce, Rockford, IL). Equal amounts of protein were loaded in each lane for reducing SDS-gel electrophoresis and then electroblotted onto polyvinylidene difluoride membranes. The blots were incubated with blocking buffer, a specific primary antibody, and horseradish peroxidase-conjugated secondary antibodies. Antigens on the blots were revealed using the enhanced chemiluminescence kit from Pierce.
Statistical analysis.
Statistical differences between two groups were determined by Student's t-test and multiple groups by analysis of variance. Values are expressed as means ± SD. P < 0.05 was considered statistically significant.
RESULTS
Tunicamycin-induced activation of PERK pathway in RPTC.
To study ER stress in renal tubular cells, we treated confluent RPTC with tunicamycin, which inhibits N-linked glycosylation, a posttranslational modification required for proper folding in many proteins. Cell lysate was collected before tunicamycin was added or at various time points after tunicamycin was added. Tunicamycin induced a rapid activation of the PERK pathway of UPR or ER stress response. As shown in Fig. 1A, PERK phosphorylation was detected at 2 h of tunicamycin treatment, increased thereafter, and reached remarkable levels at 8–24 h. Downstream of PERK, eIF2 was also phosphorylated at 2 h of tunicamycin treatment; however, in contrast to PERK, eIF2 phosphorylation did not further increase at later time points. CHOP was not induced at 2 h of tunicymycin treatment but was induced thereafter in a time-dependent manner. GRP78 is the key molecular chaperone for keeping the ER stress pathways in an inactive state. During ER stress, GRP78 is induced as an adaptive mechanism to quench the stress response. Consistently, GRP78 induction was detected in RPTC during 8–24 h of tunicamycin treatment (Fig. 1A). Densitometric analysis of the immunoblots further verified the phosphorylation of PERK and eIF2a and the induction of CHOP and Grp78 by tunicamycin time dependently in RPTC (Fig. 1B).
Fig. 1.
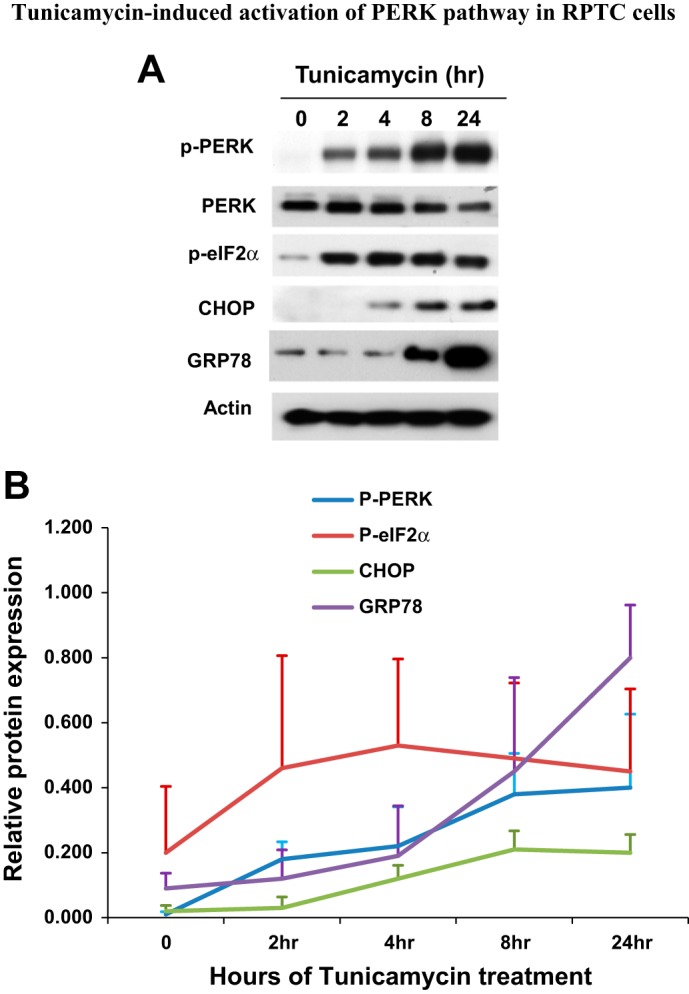
Tunicamycin-induced activation of PKR-like endoplasmic reticulum (ER) kinase (PERK) pathway in rat kidney proximal tubular cells (RPTC). RPTC were treated with 1 μg/ml tunicamycin for 0–24 h. Cell lysate was collected at the end of incubation for immunoblot analysis of phosphorylated (p) PERK, phosphorylated eukaryotic initiation factor 2α (p-eIF2α), PERK, C/EBP homologous protein (CHOP), glucose-regulated protein 78 (GRP78), and actin (loading control). A: immunblot. B: densitometric analysis of protein expression. The signal of each protein band was measured by densitometry and then divided by the actin signal in the same sample. Data are expressed as means ± SD (n = 3, i.e., 3 separate experiments).
Tunicamycin-induced apoptosis in RPTC.
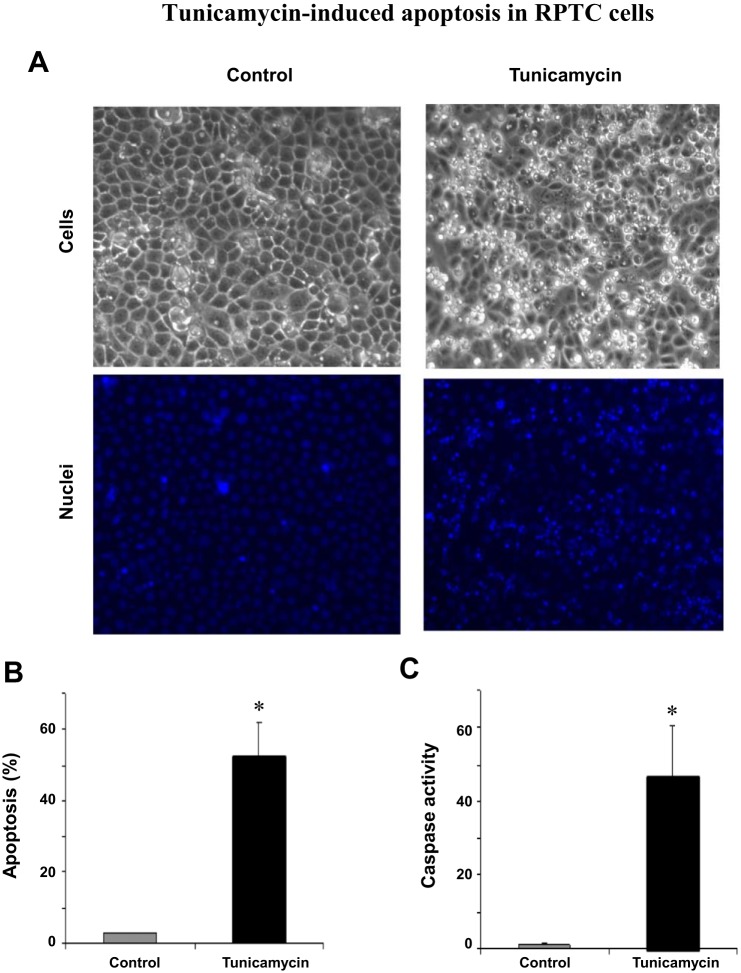
Despite initially being an adaptive response, ER stress triggers cell death when the stress is severe and becomes overwhelming (27). In RPTC, apoptosis was noticed after 12–16 h of tunicamycin treatment. By 24 h, a large percentage of cells underwent apoptosis. As shown in Fig. 2A, these cells showed typical apoptotic morphology, including cellular shrinkage and blebbing. Consistently, Hoechst 33342 staining also revealed nuclear condensation and fragmentation in these cells. Cell counting indicated that 53% of these cells became apoptotic at 24 h of tunicamycin treatment (Fig. 2B). Further biochemical analysis demonstrated a remarkable increase in caspase activity in tunicamycin-treated cells (Fig. 2C). Together, these results indicate that tunicamycin induces typical ER stress in RPTC that is associated with cell death by apoptosis.
Fig. 2.
Tunicamycin-induced apoptosis in RPTC. RPTC were incubated with or without 1 μg/ml tunicamycin for 24 h. A: morphology; cells were stained with 10 μg/ml Hoechst 33342 to record nuclear and cellular morphology by fluorescence and phase contrast microscopy, respectively. B: %apoptosis; the cells with typical apoptotic morphology were counted to determine %apoptosis. C: caspase activity; cell lysate was collected to measure caspase activity in an enzymatic assay. In B and C, data are expressed as means ± SD (n = 3–4). *Statistically significantly different from the control.
mTOR activation during tunicamycin treatment of RPTC.
mTOR and related signaling are central to cell growth, proliferation, and survival in various tissues and organs, including kidneys (9, 20). In connection with the present study, an interplay between mTOR and ER stress response has recently been eluded (1). With this background, we hypothesized that mTOR may participate in the regulation of ER stress in renal cells and tissues. To test this possibility, we initially examined mTOR activation during tunicamycin treatment of RPTC. mTOR activation is commonly indicated by the phosphorylation of mTOR and its downstream substrate proteins, such as p70S6K. Tunicamycin treatment for 2 h induced a low yet detectable mTOR phosphorylation (Fig. 3A). At 4 h, mTOR phosphorylation reached a maximal level, and thereafter mTOR phosphorylation decreased somewhat, but it remained markedly higher than control (Fig. 3A). Consistently, higher p70S6K phosphorylation was detected at 8 h. Quantification of the immunoblots by densitometry further verified mTOR and p70S6K phosphorylation during tunicamycin treatment, which was indicative of mTOR activation during ER stress in RPTC (Fig. 3B).
Fig. 3.
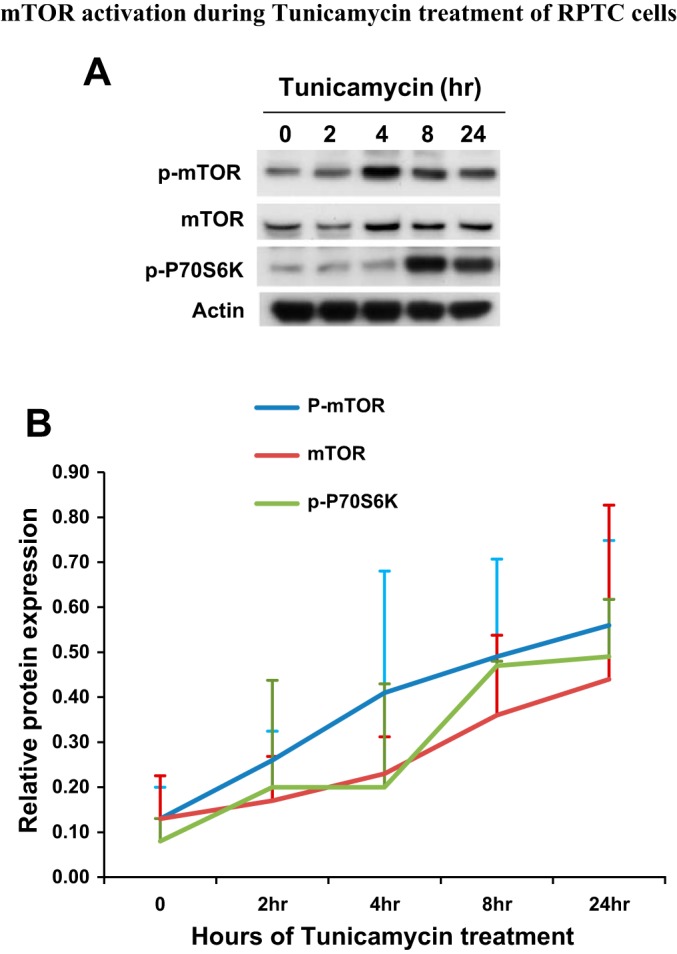
Mammalian target of rapamycin (mTOR) activation during tunicamycin treatment of RPTC. RPTC were treated with 1 μg/ml tunicamycin for 0–24 h as indicated. Cell lysate was collected for immunoblot analysis of p-mTOR, mTOR, p-p70S6K, and actin. B: densitometric analysis of protein expression. The signal of each protein band was measured by densitometry and then divided by the actin signal in the same sample. Data are expressed as means + SD (n = 3).
Suppression of tunicamycin-induced ER stress by rapamycin.
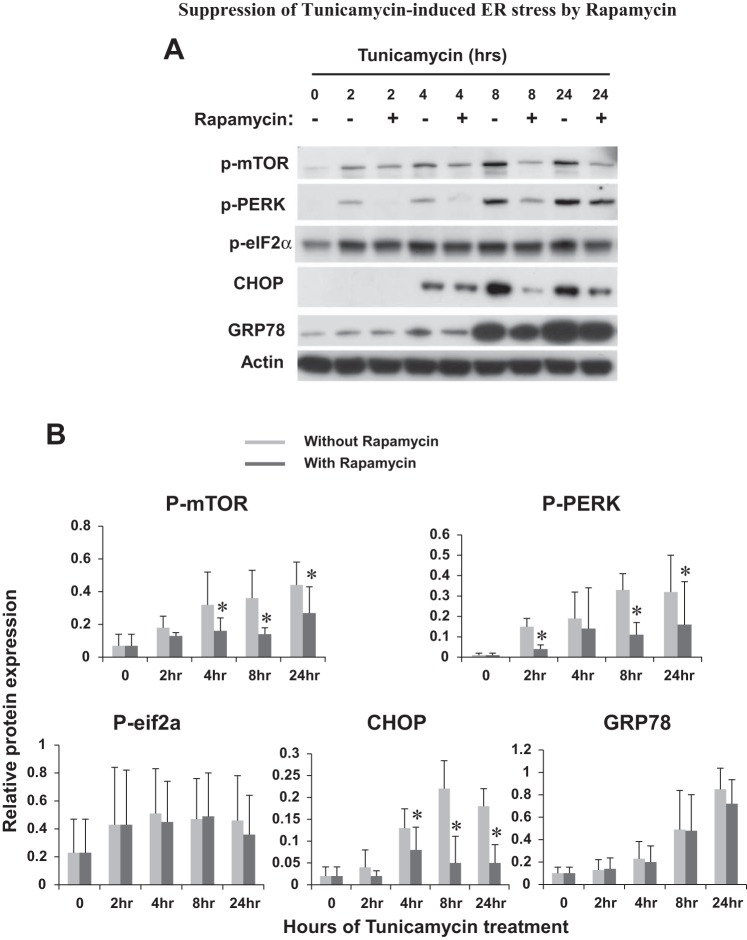
To determine the possible regulation of ER stress by mTOR, we tested the effect of rapamycin, a specific mTOR inhibitor that is efficacious at nanomolar concentrations. Rapamycin was added during tunicamycin treatment of RPTC. As shown in Fig. 4A, rapamycin was first verified for its inhibition of mTOR phosphorylation or activation at various time points of tunicamycin treatment. Further immunoblot analysis showed that rapamycin suppressed PERK phosphorylation during tunicamycin treatment. Rapamycin also suppressed eIF2α phosphorylation, although the effect was not as impressive as that of PERK. CHOP induction by tunicamycin was not notably attenuated by rapamycin at early time points (e.g. 4 h), but it was diminished at late time points of 8–24 h (Fig. 4A). Interestingly, the effect of rapamycin on GRP78 was marginal during tunicamycin treatment of RPTC. These observations were substantiated by quantifying the protein signals by densitometry (Fig. 4B), indicating that mTOR contributes to ER stress in RPTC.
Fig. 4.
Suppression of tunicamycin-induced ER stress by rapamycin. RPTC were treated with 1 μg/ml tunicamycin in the absence or presence of 100 nM rapamycin for 0–24 h as indicated. Cell lysate was collected for immunoblot analysis of p-mTOR, p-PERK, p-eIF2α, CHOP, GRP78, and actin (loading control). A: representative immunoblots. B: densitometric analysis of protein expression. The signal of each protein band was measured by densitometry and then divided by the actin signal in the same sample. Data are expressed as means + SD (n = 3). To show the effect of rapamycin, the protein signals at each time point were compared. *P < 0.05.
Inhibition of tunicamycin-induced apoptosis by rapamycin in RPTC.
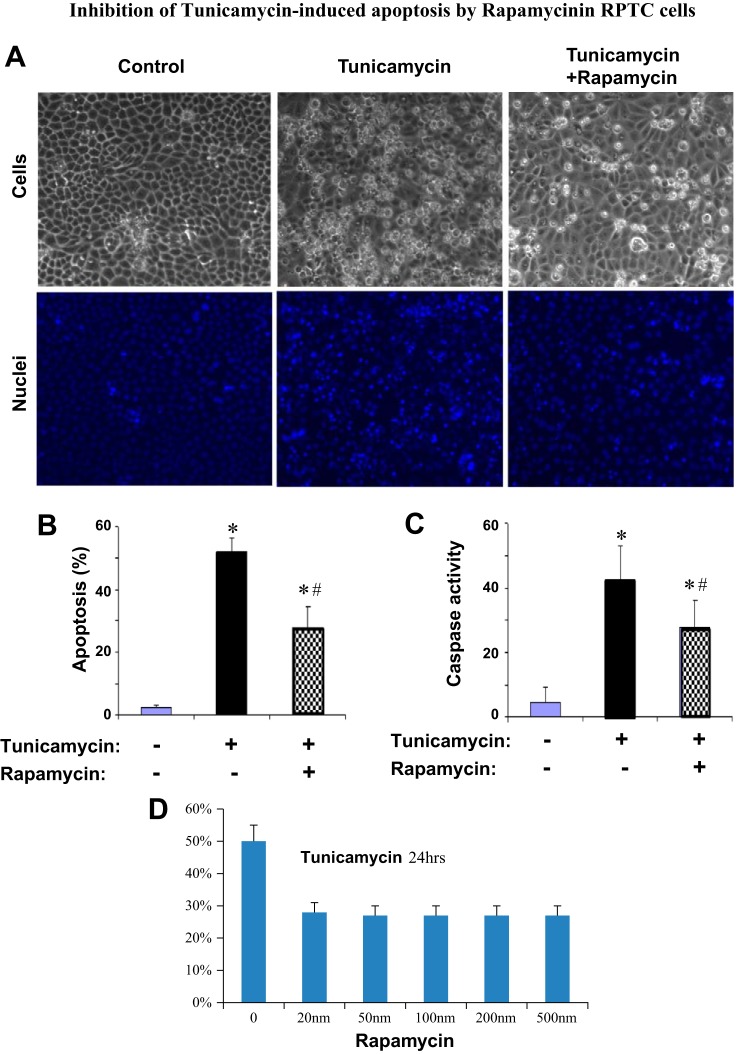
ER stress induced by tunicamycin led to apoptosis in RPTC (Fig. 2). To determine whether mTOR is involved in apoptosis during the treatment, we examined the effect of rapamycin. As shown in Fig. 5A, middle, tunicamycin treatment for 24 h induced massive apoptosis, as indicated by cellular and nuclear condensation and fragmentation in many cells. The apoptosis was markedly suppressed by inclusion of 100 nm of rapamycin during tunicamycin treatment (Fig. 5A, right). Quantification by cell counting indicated that tunicamycin induced >50% apoptosis, which was suppressed to 26% by rapamycin (Fig. 5B). Consistently, tunicamycin induced a marked caspase activation, which was also suppressed by rapamycin (Fig. 5C). We further tested the dose dependence of the inhibitory effect of rapamycin on apoptosis. As shown in Fig. 5D, 20 nM rapamycin was as efficacious as 500 nM rapamycin in blocking tunicymycin-induced apoptosis in RPTC, further supporting a role of mTOR in apoptosis under the experimental condition.
Fig. 5.
Inhibition of tunicamycin-induced apoptosis by rapamycin in RPTC. In A–C, RPTC were treated with 1 μg/ml tunicamycin in the absence or presence of 100 nM rapamycin for 24 h. In D, RPTC were treated with 1 μg/ml tunicamycin in the presence of 0–500 nm rapamycin for 24 h. A: morphology; cells were stained with 10 μg/ml Hoechst 33342 to record nuclear and cellular morphologies by fluorescence and phase contrast microscopy. B: %apoptosis; the cells with typical apoptotic morphology were counted to determine %apoptosis. C: caspase activity; cell lysate was collected to measure caspase activity in an enzymatic assay. D: dose-dependent inhibitory effect of rapamycin on apoptosis during tunicamycin treatment. In B–D, data are expressed as means ± SD (n = 3). *Statistically significantly different from control; #statistically significantly different from the tunicamycin-only group.
Effect of rapamycin on cell survival following tunicamycin treatment in RPTC.
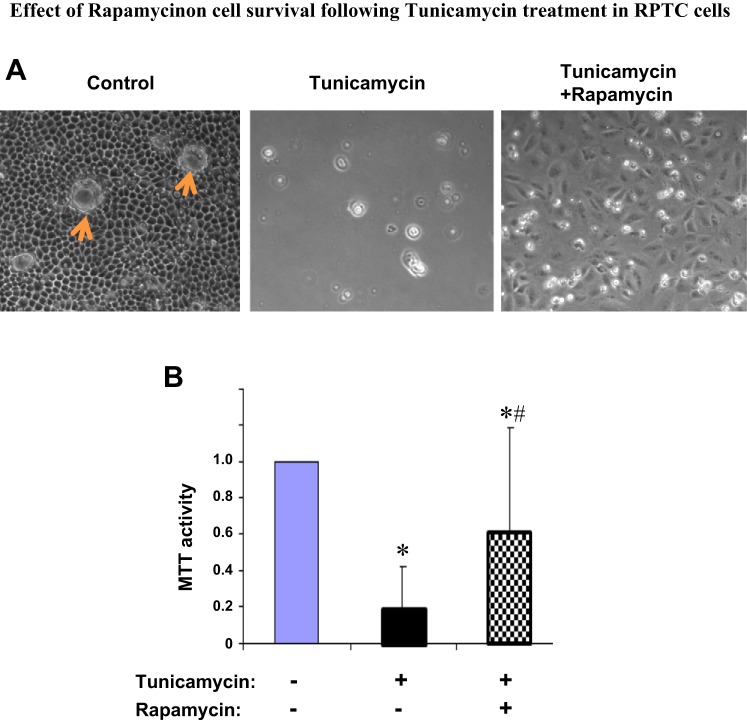
To corroborate the effect of rapamycin on apoptosis, we further analyzed cell survival. To this end, after 24 h of tunicamycin treatment with or without rapamycin, RPTC were changed to fresh medium incubation for another 24 h. After these incubations, control cells without tunicamycin exposure became very confluent and developed clear tight junctions, with some “cell domes” formed as a result of fluid transport and accumulation under cell monolayer (Fig. 6A, left). In sharp contrast, most cells in the tunicamycin only-treated group died and detached from the dish (Fig. 6A, middle). Remarkably, a significant portion of cells were rescued by rapamycin during tunicamycin treatment, and as a result, these cells could repopulate the dish (Fig. 6A, right). MTT assay further confirmed the beneficial effect of rapamycin on long-term cell survival (Fig. 6B).
Fig. 6.
Effect of rapamycin on cell survival following tunicamycin treatment in RPTC. RPTC were treated with 1 μg/ml tunicamycin in the absence or presence of 100 nM rapamycin for 24 h. After the treatment, all cells were changed to fresh medium for another 24 h of culture. A: cell morphology recorded by light microscopy to indicate cell viability. Arrows indicate cell “domes.” B: cell viability analyzed by 3-[4,5-dimethylthiazol-2-yl]-2,5-diphenyl tetrazolium bromide (MTT) assay. The values of the treated groups were normalized with the value of the control group, which was arbitrarily set as 1. Data are expressed as means ± SD (n = 3). *Statistically significantly different from control; #statistically significantly different from the tunicamycin-only group.
DISCUSSION
ER stress is a cellular response to the accumulation of misfolded or unfolded proteins. The initial response is to cope with the stress by inducing the expression of chaperones to facilitate protein folding, activating protein degradation, and reducing protein synthesis. However, cell death ensues when ER stress is severe and prolonged and overwhelms the initial adaptive response (10, 28). In line with this idea, our current study has demonstrated renal tubular cell apoptosis following severe ER stress-induced tunicamycin (Figs. 2 and 5). Importantly, using this model, we have demonstrated mTOR activation during ER stress and have provided further evidence for the involvement of mTOR in ER stress and the associated cell death (Figs. 3–6). As such, these observations support the cross-talk between ER stress and mTOR signaling.
Considering the complex signaling pathways revolving around ER stress and mTOR, it is surprising that only recently was their cross-talk suggested (1). For example, Kato et al. (18) showed that rapamycin could suppress ER stress-associated apoptosis during thapsigargin and tunicamycin treatment in NRK-52E. They further suggested that rapamycin selectively suppressed the IRE1 ER stress pathway without affecting PERK and ATF6 pathways. Consistent with that study, we demonstrated the inhibitory effect of rapamycin on ER stress-associated apoptosis in renal RPTC (Figs. 5 and 6). However, mechanistically we showed that rapamycin suppressed the PERK pathway, including the phosphorylation of PERK and eIF2α and induction of CHOP (Fig. 4). On the basis of the well-known proapoptotic effect of the PERK-CHOP pathway (10, 28), we postulate that mTOR may contribute to apoptosis in ER stress in part by regulating this pathway. The exact cause of the discrepancy between our and the previous studies is unclear, but it may be related to the differences in the experimental models tested. Although three main pathways of ER stress (IRE, PERK, and ATF6) have been described, their sensitivities to mTOR regulation may vary depending on the cellular context and the severity of ER stress.
Rapamycin had remarkable, beneficial effects in ER-stressed RPTC. It not only suppressed apoptosis but also improved long-term cell survival (Figs. 5 and 6). Moreover, rapamycin was efficacious in promoting cell survival even at 20 nM, the lowest concentration tested in our study. As eluded above, by inhibiting mTOR, rapamycin may block ER stress signaling, including the IRE1-JNK and/or PERK-CHOP pathway. It remains elusive as to how mTOR regulates these pathways. mTOR functions in two main protein complexes called mTOR complex 1 (mTORC1) and mTOR complex 2 (mTORC2), which are distinct in protein compositions and cellular functions. It is generally recognized that rapamycin has specificity toward mTORC1 (13). Accordingly, it is suggested that mTORC1 likely participates in the regulation of ER stress and associated apoptosis in our study. mTOR exerts its regulatory functions by phosphorylating specific protein substrates. Thus, it is plausible that mTOR may phosphorylate a key protein(s) in specific ER stress pathways (e.g., PERK) to downregulate its activity. Alternatively, mTOR may contribute to ER stress by inducing new protein synthesis and therefore triggering further protein overload in ER. This notion is supported by our observation that mTOR was rapidly activated during ER stress to result in the phosphorylation and activation of p70S6K (Fig. 2), a protein kinase of the ribosomal S6 subunit for protein synthesis. In this possibility, rapamycin, by blocking mTOR, shuts down new protein synthesis, and therefore, it alleviates protein overload in ER, resulting in the amelioration of ER stress. Apparently, the activation of mTOR and associated protein synthesis during ER stress seems paradoxical or counterintuitive, as the stressed cell is striving to reduce protein overload, especially misfolded proteins, in ER. It is intriguing why and how mTOR and new protein synthesis are activated under this condition.
Yet another pathway that may link mTOR and ER stress signaling networks is autophagy, which normally delivers cytoplasmic contents into lysosomes for degradation. mTOR is known to be the major negative regulator of autophagy, and as a result, rapamycin stimulates autophagy in a variety of cells and tissues, including kidneys (11, 15, 21). Notably, under pathological conditions, autophagy is cytoprotective, antiapoptotic, and prosurvival in kidney cells and tissues (11, 15, 21). These considerations suggest that the activation of mTOR in ER stress may suppress autophagy and limit its cytoprotective action. However, this possibility is not supported by the observation that ER stress is generally associated with autophagy induction and not inactivation (6). Nonetheless, further investigations need to delineate these possibilities for the mechanism whereby mTOR contributes to cell injury and death during ER stress to be understood.
ER stress has been implicated in a broad range of renal diseases involving different cell types in kidneys, such as podocytes, tubular cells, and interstitial cells (4, 5, 12). The demonstration of the detrimental role played by mTOR in ER stress in kidney cells suggests the potential of renoprotection by blocking mTOR in the disease conditions. This is particularly tantalizing since rapamycin, the specific inhibitor of mTOR, is in clinical use for immunosuppression and chemotherapy of certain cancer types. However, it is noteworthy that mTOR has an essential role in cell growth, proliferation, metabolism, and other cell biological functions. Thus, blocking mTOR, for example by rapamycin, may adversely affect the regenerative or repair process that is vital for functional recovery of organs and tissues, including kidneys. In this regard, it has been reported that rapamycin delays kidney repair following renal ischemia-reperfusion injury (19). Despite this concern, rapamycin is a reversible inhibitor of mTOR, and therefore, it may be applied for a defined period of time for tissue protection and then washed off to facilitate the growth and proliferation of surviving cells for tissue repair.
GRANTS
The study was supported in part by grants from the National Natural Science Foundation of China (81430017, 81370791), the National Basic Research Program of China 973 Program (no. 2012CB517601), and the National Institutes of Health and Department of Veterans Administration.
DISCLOSURES
No conflicts of interest, financial or otherwise, are declared by the authors.
AUTHOR CONTRIBUTIONS
G.D. and Z.D. conception and design of research; G.D., Y.L., and L.Z. performed experiments; G.D., Y.L., L.Z., S.H., H.-F.D., and Z.D. analyzed data; G.D., Y.L., and Z.D. prepared figures; G.D. drafted manuscript; G.D., Y.L., L.Z., S.H., H.-F.D., and Z.D. approved final version of manuscript; Y.L., L.Z., S.H., H.-F.D., and Z.D. interpreted results of experiments; Y.L., L.Z., S.H., H.-F.D., and Z.D. edited and revised manuscript.
REFERENCES
- 1.Appenzeller-Herzog C, Hall MN. Bidirectional crosstalk between endoplasmic reticulum stress and mTOR signaling. Trends Cell Biol 22: 274–282, 2012. [DOI] [PubMed] [Google Scholar]
- 2.Borsting E, Patel SV, Declèves AE, Lee SJ, Rahman QM, Akira S, Satriano J, Sharma K, Vallon V, Cunard R. Tribbles homolog 3 attenuates mammalian target of rapamycin complex-2 signaling and inflammation in the diabetic kidney. J Am Soc Nephrol 25: 2067–2078, 2014. [DOI] [PMC free article] [PubMed] [Google Scholar]
- 3.Brooks C, Wei Q, Cho S, Dong Z. Regulation of mitochondrial dynamics in acute kidney injury in cell culture and rodent models. J Clin Invest 119: 1275–1285, 2009. [DOI] [PMC free article] [PubMed] [Google Scholar]
- 4.Cunard R, Sharma K. The endoplasmic reticulum stress response and diabetic kidney disease. Am J Physiol Renal Physiol 300: F1054–F1061, 2011. [DOI] [PMC free article] [PubMed] [Google Scholar]
- 5.Cybulsky AV. The intersecting roles of endoplasmic reticulum stress, ubiquitin- proteasome system, and autophagy in the pathogenesis of proteinuric kidney disease. Kidney Int 84: 25–33, 2013. [DOI] [PubMed] [Google Scholar]
- 6.Ding WX, Yin XM. Sorting, recognition and activation of the misfolded protein degradation pathways through macroautophagy and the proteasome. Autophagy 4: 141–150, 2008. [DOI] [PubMed] [Google Scholar]
- 7.Dong G, Luo J, Kumar V, Dong Z. Inhibitors of histone deacetylases suppress cisplatin-induced p53 activation and apoptosis in renal tubular cells. Am J Physiol Renal Physiol 298: F293–F300, 2010. [DOI] [PMC free article] [PubMed] [Google Scholar]
- 8.Dong G, Wang L, Wang CY, Yang T, Kumar V, Dong Z. Induction of apoptosis in renal tubular cells by histone deacetylase inhibitors, a family of anticancer agents. J Pharmacol Exp Ther 325: 978–984, 2008. [DOI] [PubMed] [Google Scholar]
- 9.Grahammer F, Wanner N, Huber TB. mTOR controls kidney epithelia in health and disease. Nephrol Dial Transplant 29, Suppl 1: i9–i18, 2014. [DOI] [PubMed] [Google Scholar]
- 10.Hetz C. The unfolded protein response: controlling cell fate decisions under ER stress and beyond. Nat Rev Mol Cell Biol 13: 89–102, 2012. [DOI] [PubMed] [Google Scholar]
- 11.Huber TB, Edelstein CL, Hartleben B, Inoki K, Dong Z, Koya D, Kume S, Lieberthal W, Pallet N, Quiroga A, Ravichandran K, Susztak K, Yoshida S, Dong Z. Emerging role of autophagy in kidney function, diseases and aging. Autophagy 8: 1009–1031, 2012. [DOI] [PMC free article] [PubMed] [Google Scholar]
- 12.Inagi R, Ishimoto Y, Nangaku M. Proteostasis in endoplasmic reticulum—new mechanisms in kidney disease. Nat Rev Nephrol 10: 369–378, 2014. [DOI] [PubMed] [Google Scholar]
- 13.Inoki K, Kim J, Guan KL. AMPK and mTOR in cellular energy homeostasis and drug targets. Annu Rev Pharmacol Toxicol 52: 381–400, 2012. [DOI] [PubMed] [Google Scholar]
- 14.Jiang M, Pabla N, Murphy RF, Yang T, Yin XM, Degenhardt K, White E, Dong Z. Nutlin-3 protects kidney cells during cisplatin therapy by suppressing Bax/Bak activation. J Biol Chem 282: 2636–2645, 2007. [DOI] [PMC free article] [PubMed] [Google Scholar]
- 15.Jiang M, Wei Q, Dong G, Komatsu M, Su Y, Dong Z. Autophagy in proximal tubules protects against acute kidney injury. Kidney Int 82: 1271–1283, 2012. [DOI] [PMC free article] [PubMed] [Google Scholar]
- 16.Jiang M, Wei Q, Wang J, Du C, Yu J, Zhang L, Dong Z. Regulation of PUMA-alpha by p53 in cisplatin-induced renal cell apoptosis. Oncogene 25 4056–4066, 2006. [DOI] [PubMed] [Google Scholar]
- 17.Jiang M, Yi X, Hsu S, Wang CY, Dong Z. Role of p53 in cisplatin-induced tubular cell apoptosis: dependence on p53 transcriptional activity. Am J Physiol Renal Physiol 287: F1140–F1147, 2004. [DOI] [PubMed] [Google Scholar]
- 18.Kato H, Nakajima S, Saito Y, Takahashi S, Katoh R, Kitamura M. mTORC1 serves ER stress-triggered apoptosis via selective activation of the IRE1-JNK pathway. Cell Death Differ 19: 310–320, 2012. [DOI] [PMC free article] [PubMed] [Google Scholar]
- 19.Lieberthal W, Fuhro R, Andry CC, Rennke H, Abernathy VE, Koh JS, Valeri R, Levine JS. Rapamycin impairs recovery from acute renal failure: role of cell-cycle arrest and apoptosis of tubular cells. Am J Physiol Renal Physiol 281: F693–F706, 2001. [DOI] [PubMed] [Google Scholar]
- 20.Lieberthal W, Levine JS. Mammalian target of rapamycin and the kidney. II. Pathophysiology and therapeutic implications. Am J Physiol Renal Physiol 303: F180–F191, 2012. [DOI] [PubMed] [Google Scholar]
- 21.Livingston MJ, Dong Z. Autophagy in acute kidney injury. Semin Nephrol 34: 17–26, 2014. [DOI] [PMC free article] [PubMed] [Google Scholar]
- 22.Pallet N, Bouvier N, Legendre C, Gilleron J, Codogno P, Beaune P, Thervet E, Anglicheau D. Autophagy protects renal tubular cells against cyclosporine toxicity. Autophagy 4: 783–791, 2008. [DOI] [PubMed] [Google Scholar]
- 23.Peyrou M, Hanna PE, Cribb AE. Cisplatin, gentamicin, and p-aminophenol induce markers of endoplasmic reticulum stress in the rat kidneys. Toxicol Sci 99: 346–353, 2007. [DOI] [PubMed] [Google Scholar]
- 24.Prachasilchai W, Sonoda H, Yokota-Ikeda N, Oshikawa S, Aikawa C, Uchida K, Ito K, Kudo T, Imaizumi K, Ikeda M. A protective role of unfolded protein response in mouse ischemic acute kidney injury. Eur J Pharmacol 592: 138–145, 2008. [DOI] [PubMed] [Google Scholar]
- 25.Prischi F, Nowak PR, Carrara M, Ali MM. Phosphoregulation of Ire1 RNase splicing activity. Nat Commun 5: 3554, 2014. [DOI] [PMC free article] [PubMed] [Google Scholar]
- 26.Qi W, Mu J, Luo ZF, Zeng W, Guo YH, Pang Q, Ye ZL, Liu L, Yuan FH, Feng B. Attenuation of diabetic nephropathy in diabetes rats induced by streptozotocin by regulating the endoplasmic reticulum stress inflammatory response. Metabolism 60: 594–603, 2011. [DOI] [PubMed] [Google Scholar]
- 27.Sano R, Reed JC. ER stress-induced cell death mechanisms. Biochim Biophys Acta 1833: 3460–3470, 2013. [DOI] [PMC free article] [PubMed] [Google Scholar]
- 28.Walter P, Ron D. The unfolded protein response: from stress pathway to homeostatic regulation. Science 334: 1081–1086, 2011. [DOI] [PubMed] [Google Scholar]
- 29.Wei Q, Dong G, Huang S, Ramesh G, Dong Z. Global deletion of Bak and specific deletion of Bax from proximal tubules protect against ischemic acute kidney injury in mice. Kidney Int 84: 138–148, 2013. [DOI] [PMC free article] [PubMed] [Google Scholar]


