

Abstract
Background
Extracellular vesicles (EVs) are cell-derived membrane vesicles. EVs contain several RNAs such as mRNA, microRNAs, and ncRNAs, but less is known of their genomic DNA (gDNA) content. It is also unknown whether the DNA cargo is randomly sorted or if it is systematically packed into specific EV subpopulations. The aim of this study was to analyze whether different prostate cancer (PCa) cell-derived EV subpopulations (apoptotic bodies, microvesicles, and exosomes) carry different gDNA fragments.
Methods
EV subpopulations were isolated from three PCa cell lines (LNCaP, PC-3, and RC92a/hTERT) and the plasma of PCa patients and healthy donors, and characterized by transmission electron microscopy, nanoparticle tracking analysis and total protein content. gDNA fragments of different genes were detected by real time quantitative PCR and confirmed by DNA sequencing.
Results
We report that the concentration of EVs was higher in the cancer patients than in the healthy controls. EV subpopulations differed from each other in terms of total protein and DNA content. Analysis of gDNA fragments of MLH1, PTEN, and TP53 genes from the PCa cell-derived EV subpopulations showed that different EVs carried different gDNA content, which could even harbor specific mutations. Altogether, these results suggest that both nucleic acids and proteins are selectively and cell-dependently packed into the EV subtypes.
Conclusions
EVs derived from PCa cell lines and human plasma samples contain double-stranded gDNA fragments which could be used to detect specific mutations, making EVs potential biomarkers for cancer diagnostics and prognostics.
Introduction
Extracellular vesicles (EVs) are heterogeneous populations of membrane vesicles released by cells into their microenvironment and blood circulation. EVs are important mediators of intercellular communication and disease progression, and they are considered to play a fundamental role in many physiological and pathological processes [1,2]. The nomenclature and classification of EVs are still undefined, and even the purest vesicle samples can remain heterogeneous, being only isolated as an EV subtype-enriched population by the currently available purification techniques [3]. Presently, a broad consensus classifies EVs into three main classes based on the differences in their size, formation mechanism, and content [1]. Apoptotic bodies (ABs) are the largest EVs, with a size range of 1–4 µm [4]. They are released by all cell types during the late stages of apoptosis. It is widely known that ABs contain nuclear material from the dying cells, being able to participate in the horizontal transfer of oncogenes [5]. Microparticles or microvesicles (MVs) are plasma membrane-derived vesicles defined as 0.2–1.0 µm in size, which are formed by outward shedding of the plasma membrane [2]. Exosomes (EXOs) are the smallest membranous vesicles, between 40 and 100 nm in diameter. They are first secreted into the endosome-derived multivesicular bodies and then liberated by the fusion of the multivesicular body with the plasma membrane [1].
The oncogenic alteration of cancer cells is known to influence both the number of secreted EVs and direct the inclusion of tumor-related molecules into the EV cargo [6,7]. The presence of cancer markers in EVs combined with their release into body fluids, such as blood, urine or semen, highlights their potential use as non-invasive biomarkers [8]. Messenger RNAs (mRNAs) of PCA3 and TMPRSS2-ERG genes have previously been discovered in EXOs from urine of both prostate cancer (PCa) patients [9,10] and mice grafted with human PCa [11]. It has also been demonstrated that prostasomes, EXOs derived from the seminal fluid, contain chromosomal DNA [12]. In addition, the transfer of the tumor suppressor PTEN through EXOs conferring tumor-suppression activity to acceptor cells has been recently proven [13]. The enrichment of mRNAs and microRNAs in EVs suggests that nucleic acids may be selectively packaged into them [8]. However, it is still unclear if the cargo is randomly packed in EVs, or whether it is sorted among different EV subpopulations, making some EV types more likely to carry certain material than others. We investigated if the diverse EV subpopulations from different sources contained gDNA fragments. To test this hypothesis, we extracted gDNA from ABs, MVs, and EXOs derived from different malignant PCa cell lines and from plasma of both PCa patients and healthy donors. We proved that the EV subpopulations from the cell culture supernatants and plasma contained different gDNA fragments, and in some cases DNA harboring TP53 and PTEN mutations.
Materials and Methods
Cell Lines
LNCaP and PC-3, commercial PCa metastatic cell lines (from ATCC), and RC92a/hTERT, human telomerase reverse transcriptase (hTERT)-immortalized primary malignant tumor-derived human prostate epithelial cell line (a kind gift of Dr. Rhim JS, University of the Health Sciences, Bethesda, MD), were grown at 37°C and 5% of CO2 atmosphere to 80% confluence. LNCaP cells were grown in RPMI 1640 medium supplemented with 10% fetal bovine serum (FBS). The FBS was vesicle-depleted by an overnight ultracentrifugation at 110,000g, followed by filtration through 0.22 µm filter (Millipore). PC-3 cells were grown in DMEM/F12 medium supplemented with 10% FBS. RC92a/hTERT cells were grown and maintained in a Keratinocyte serum-free medium supplemented with bovine pituitary extract and recombinant epidermal growth factor. All media were supplemented with 2.5% of penicillin–streptomycin. All reagents were purchased from Life Technologies.
Plasma Samples
EDTA blood samples, taken from four PCa patients and four healthy male donors, were collected at Tampere University Hospital (Finland) after receiving written consent (ethical permission number R03203). Detailed information about the patients is presented in Table I. Samples were stored at 4–8°C and processed within 12 hr.
TABLE I.
Characteristics of the Prostate Cancer Patients
| Patient number | Gender | Clinical stage |
PSA (ng/ml) | Test leading to diagnosis | Gleason score | ||
|---|---|---|---|---|---|---|---|
| cT | cN | cM | |||||
| 6 | Male | T3 | NX | M0 | 18 | PSA | 7 |
| 7 | Male | T1c | NX | M0 | 26.6 | PSA | 7 |
| 8 | Male | T1c | N0 | M0 | 7 | PSA | 6 |
| 9 | Male | T3 | NX | MX | 7.8 | Symptomatic | 8 |
Patient number, gender, clinical stage, PSA (ng/ml), test leading to diagnosis, and Gleason score are showed.
Extracellular Vesicles Isolation
EVs from plasma samples (2 ml), and cell-conditioned media (300 ml) produced from 1.8–2 × 10⁸ cells, were isolated by differential ultracentrifugation. To remove cellular debris, samples were centrifuged at 1,000g for 10 min. This was followed by a centrifugation at 1,200g for 30 min to obtain the ABs. The supernatant was centrifuged at 20,000g for 60 min to obtain the MVs. The remaining supernatant was filtered using a 0.22 µm membrane filter and ultracentrifuged at 110,000g for 60 min to obtain EXOs (Optima-LE 80K ultracentrifuge, 50.2 Ti rotor, and Beckman tubes (Beckman Coulter)). All centrifugations were performed at 4°C. The final pellets were resuspended in 100 µl of Dulbecco's phosphate buffered saline (1× DPBS) (Life Technologies). A sample of the EV-free supernatant collected after the ultracentrifugation was also treated similarly and used as a negative control. Samples were immediately used or stored at −80°C. EV number was normalized per ml of cell culture media containing the vesicles from million cells. From patient samples and healthy donors, the number of the isolated EVs was normalized per ml of plasma.
Transmission Electron Microscopy (TEM)
EVs samples (4 µl) were individually added onto glow discharged 150 mesh formvar copper grids (EMSTM) and incubated for 2 min at 4°C. The grids were washed, negatively stained with 2% aqueous uranyl acetate, dried, and analyzed by TEM (FEI Tecnai Spirit G2 and FEI Tecnai 12) at 80 kV. Images were taken by digital camera (Soft Image System, Morada and Gatan Orius SC 1000B CCD-camera).
Nanoparticle Tracking Analysis (NTA)
EV subpopulations were analyzed using a Nanoparticle Tracking Analyzer LM10 with red laser (638 nm, 40 mW, Nanosight Technology) and Merlin F-033B ASG-camera (Allied Vision Technologies GmbH) to provide data on size distribution and EV concentration. All the EV samples were diluted 1:50–1:100 in DPBS before analysis. Three measurements were performed for each sample in which the analysis settings remained unaltered within experiments (camera level 14, auto-settings off, polydispersity high, and reproducibility high). Data analysis was performed with NTA 2.3 software (Nanosight). In all cases, the median particle size, standard deviation, size distribution, and particle concentration values were obtained.
Protein Quantification
EVs were analyzed for total protein contents using the MicroBCA protein assay kit (Thermo Scientific). Prior the protein extraction, EV samples were washed three times with DPBS and incubated at 95°C for 10 min. EVs preparations, usually diluted 1:10 to 1:50 in DPBS, were compared in triplicates against serially diluted bovine serum albumin standard. After 2 hr of incubation, the samples were analyzed in a microplate reader Varioskan Flash (v.2.4.3) (Thermo Scientific), using a 562 nm absorbance filter. The protein concentration was determined by the standard curve and the optical density value of the samples.
DNA Isolation and Pre-Amplification
Prior to the DNA isolation, samples were treated with 100 µg/ml RNase A (Thermo Scientific) for 2 min at room temperature and 27 Kunitz U/ml DNase I (Quiagen) for 30 min at 37°C respectively in order to remove possible nucleic acids contaminants. After treatment, the enzymes were inactivated using RiboLock RNase Inhibitor (Fermentas) and heat inactivation. Total DNA was extracted from EVs and cells using DNeasy blood and Tissue Kit (Qiagen) following manufacturer's recommendations. The extracted DNA was pre-amplified using the GenomePlex Complete WGA2 Kit (Sigma-Aldrich), according to manufacturer's instructions, and then diluted to 10 ng/µl working solution. The spectrum, double-stranded DNA concentration, and quality of the extracted DNA were estimated in all the samples using SPECTROstar Nano (BMG Labtech) and 2100 Bioanalyzer (Agilent).
PCR Analysis and Sequencing
PCR analysis was performed with preamplified gDNA products from ABs, MVs, and EXOs from both PCa cell lines and plasma samples, using the specific designed primers (Table II and Supplementary Fig. S3). Each experiment was repeated a minimum of three times. The PCR reaction mixture contained 2 mM Mg2+, 100 mM dNTP mix, 10 µM of each primer, 5 U/µl of Paq 5000 DNA polymerase (Aguilent Technologies), 10 ng of gDNA and DEPC H2O up to 25 µl. PCR was performed in a T100 Thermal cycler (BioRad) and the thermal cycles were used as follows: 1 cycle of 2 min at 95°C, 34 cycles for 20 sec at 95°C, 20 sec at 60°C and 30 sec at 72°C, and 5 min at 72°C. The resulting PCR-products were validated by electrophoresis in 1% agarose gels. The bands were extracted and purified from the gel (Gel extraction kit and QIAqick PCR purification kit, Quiagen). Subsequently, a sequencing reaction was performed using BigDye Terminator (v.3.1) Cycle Sequencing Kit (Applied Biosystems), and run in an ABI 3730 DNA analyzer automated sequencer (Applied Biosystems).
TABLE II.
PCR Primer Sequences
| Primer name | Gene | Sequence 5′–3′ | Tm | nt # | Amplicon size (bp) |
|---|---|---|---|---|---|
| hGAPDH_FW | GAPDH | TCCTCCACCTTTGACGCTG | 60 | 19 | 101 |
| hGAPDH_Rw | ACCACCCTGTTGCTGTAGCC | 62 | 20 | ||
| hMLH1_gI7-E8_FW | MLH1 | ttatcagCAAGGAGAGACAGTAGC | 59 | 24 | 108 |
| hMLH1_gE8-I9_Rv | cgacatacCGACTAACAGCATTT | 60 | 23 | ||
| hPTEN_gE1_FW | PTEN | GCCAAGTCCAGAGCCATT | 60 | 18 | 225 |
| hPTEN_gI1_Rv | aagagagtgacagaaaggtaaagagg | 60 | 26 | ||
| hTP53_gE3-I3_FW | TP53 | CTGgtaaggacaagggttgg | 59 | 20 | 316 |
| hTP53_gE4_Rv | CTGGGAAGGGACAGAAGATG | 60 | 20 |
Real-Time Quantitative PCR (qPCR)
Relative quantification of parts of MLH1, PTEN, and TP53 genes for the cell-derived EVs was determined by qPCR. qPCR assays were performed using a Lightcycler 480 (Roche Diagnostics). All the samples, external standards, and non-template controls were run in triplicate. For each 20 µl PCR reaction, 10 µl of Fast SYBR Green Master Mix (Applied Biosystems), 300 nM of each primer, and 50 ng of DNA were used. The thermal cycle parameters were as follows: enzyme activation at 95°C for 20 sec, 40 cycles of denaturation at 95°C for 1 sec, and annealing and extension at 60°C for 20 sec. DNA detection was performed using specific primer pairs (Sigma-Aldrich) which were designed using Primer 3 and nucleotide Blast (Blastn) tools (see Table II). The melting curves and Ct values were analyzed with Lightcycler 480 software (v.1.5), and the resulting values were reviewed manually for a correct analysis. Normalized relative ratio values for MLH1, PTEN, and TP53 gDNA fragments were calculated by comparison with the relative amount obtained for Glyceraldehyde-3-phosphate dehydrogenase (GAPDH) [14].
Statistical Analysis
Statistical analyses were performed using statistical software R-project (v.3.0.2). In all experiments, Student's t-test assessed by a Shapiro–Wilk test or nonparametric Wilcoxon signed ranked test were used. The results were always considered statistically significant (two sides) in the following scale: *P < 0.05; **P < 0.01; ***P < 0.001. Results are represented as mean ± standard error (SE).
Results
Morphological Characterization and Size Distribution of ABs, MVs, and EXOs
Different EV subpopulations generated by LNCaP, PC-3, and RC92a/hTERT cell cultures, as well as from human plasma samples, were isolated by differential centrifugations, visualized by TEM, and size measured by NTA (Fig. 1). TEM and NTA are complementary techniques. TEM offers a precise observation of the size morphology and heterogeneity of individual vesicles, while NTA is more appropriate for observation of EV size distribution and concentration. TEM data revealed that we were able to morphologically separate three different enriched vesicle populations: ABs, pelleted at 1,200g, were within the previously reported size rage of 1–4 µm [4] (Fig. 1A. a1–c1). MVs, isolated at 20,000g, were within a diameter range of 0.2–1 µm. They were more heterogeneous in size and morphology with a predominant oval and spherical shape (Fig. 1A. a2–c2). EXOs obtained after 0.22 µm filtration and subsequent ultracentrifugation at 110,000g were more homogeneous in shape, and within a size range of 40–100 nm (Fig. 1A. a3–c3). TEM results (Fig. 1A) verified that we were able to isolate highly purified populations of ABs, MVs, and EXOs free of cellular debris and protein aggregates. The EV subpopulations from the different cell lines and plasma samples had a similar morphology (Supplementary Fig. S1), with intact structures, confirming that different cell sources produced similar EV populations with comparable sizes, using the same isolation protocol. The mean size of MVs and EXOs for LNCaP, PC-3, and RC92a/hTERT, from NTA measurements, together with the size distribution histograms are shown in the Figure 1B. In addition, the mean size of MVs and EXOs derived from the PCa patients and healthy donors plasma samples are also provided (Supplementary Table SI) in order to prove that in both cases, the isolated MVs and EXOs from plasma were also in the same size distribution range described for each EV subtype. In the NTA measurements, the partial overlap between the MV and EXO populations may be due to the intra-sample variability, the presence of other particles from the plasma (lipoprotein and immune complexes) and also the vesicle aggregation (Fig. 4C). ABs could not be measured because their size range was out of the detection limits of the NTA technique.
Fig 1.
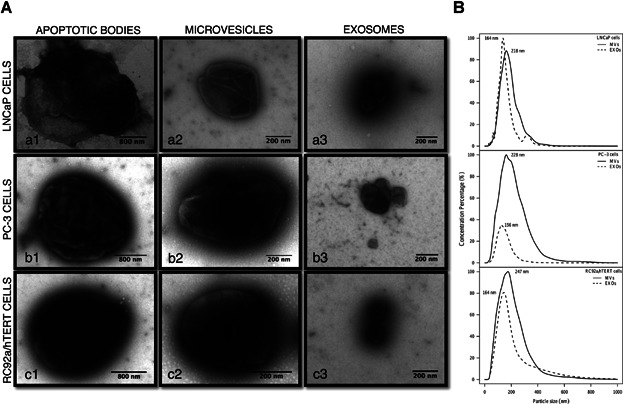
Characterization of cell-derived extracellular vesicle subpopulations. A: Representative transmission electron microscopy images of different EV populations: apoptotic bodies (a1–c1), microvesicles (a2–c2) and exosomes (a3–c3) released from LNCaP, PC-3, RC92a/hTERT cell lines. The scale bar is included in each picture. B: Size distribution graphics of microvesicles (MVs) and exosomes (EXOs) derived from LNCaP, PC-3, and RC92a/hTERT cells were determined by NTA using Nanosight software. The mean particle size for each population is represented.
Fig 4.
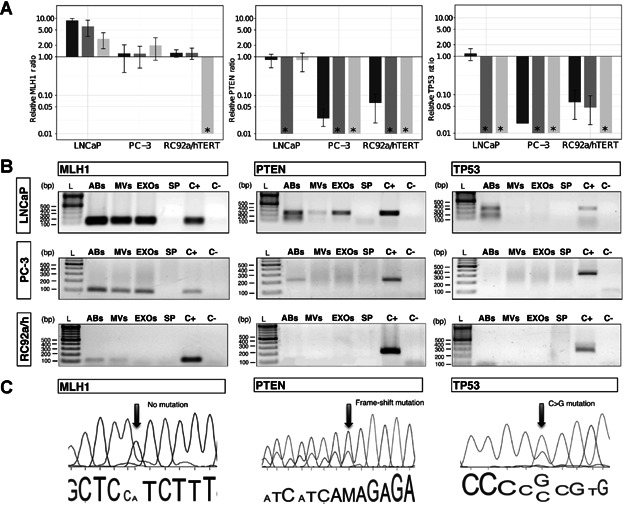
Presence of mutated DNA fragments in EV subpopulations. A: Relative ratio of MLH1, PTEN, and TP53 genomic DNA (gDNA) fragments assessed by qPCR from subpopulations of EVs derived from LNCaP, PC-3, and RC92a/hTERT cells, using GAPDH as a reference gene. The GAPDH gene was used as reference due to its constant presence in all the vesicle types (Supplementary Fig. S2). Asterisk (*) represents that the gene of interest was not detectable by qPCR or not present in the samples analyzed. Columns are the average of three experiments, each one measured in triplicates. Error bars represent SE. Apoptotic bodies: dark gray; microvesicles: gray; exosomes: light gray. B: Agarose gel electrophoresis of MLH1, PTEN, and TP53 gDNA fragments extracted of EVs derived from LNCaP, PC-3, and RC92a/hTERT cells (n = 3). Ladder (L), apoptotic bodies (ABs), microvesicles (MVs), exosomes (EXOs), supernatant from the last ultracentrifugation (SP), positive cell control (C+) and negative control (C−). C: Electropherograms displaying PTEN and TP53 mutations in ABs and EXOs. Part of genomic DNA sequences of MLH1, PTEN, and TP53 genes from LNCaP-derived vesicles, with no MLH1 mutation (left), PTEN mutation in codon 6 (Frame-shift mutations, delAA) (center) and TP53 mutation in codon 215 (CCC to CGC) (right). The arrows show the position of the mutations.
EVs Are More Abundant in the Plasma of Cancer Patients Than in Healthy Donors
In order to measure the EV concentration, both cell-derived and plasma-derived EV samples were analyzed by NTA (Fig. 2). Although the cancer cells used in this study were morphologically very heterogeneous, their MVs and EXOs had comparable sizes and concentrations. Particle concentration was normalized per million cells to be comparable between the different cell lines. The concentration of MVs (n = 16) and EXOs (n = 16) in each cell line was quite similar, within the range of 1.36–2.52 × 10⁸ particles/ml per million cells for MVs, and 0.56–1.93 × 10⁸ particles/ml per million cells for EXOs (Figs. 2A and B).
Fig 2.
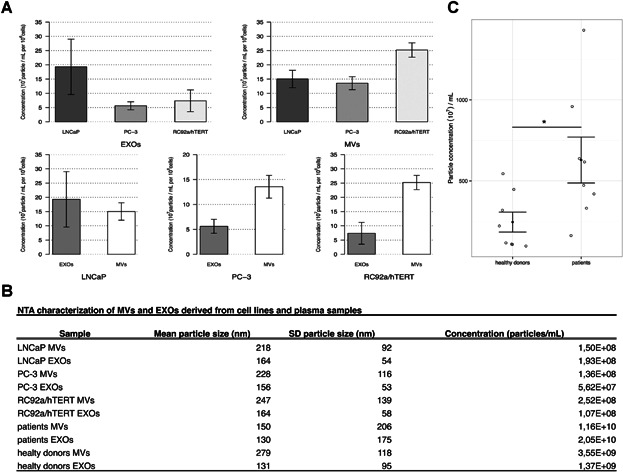
Particle concentration of microvesicles and exosomes from prostate cell lines and plasma samples. A: Barplots representing the nanoparticle tracking analysis results depicting the particle concentration of microvesicles (MVs) and exosomes (EXOs) per million cells per cell line. LNCaP MVs (n = 8); PC-3 MVs (n = 4); RC92a/hTERT MVs (n = 4); LNCaP EXOs (n = 6); PC-3 EXOs (n = 4); RC92a/hTERT EXOs (n = 5); error bars represent SE; P values were determined by unpaired Wilcoxon signed ranked test (upper bar plots) and paired Wilcoxon signed ranked test (lower bar plots). B: Nanoparticle tracking analysis of MVs and EXOs derived from cell lines and plasma samples. The concentration (particles/ml) is normalized per million cells for EVs derived from prostate cell lines. C: Dot plot showing the total EV particle concentration per milliliter of plasma for patients (n = 8) and healthy donors (n = 8); error bars represent SE; *P < 0.05, was determined by unpaired Student's t-test.
Although the MVs and EXOs concentrations from the three cell lines seemed to differ from one another (Fig. 2A), the results did not reach statistical significance. Regarding the plasma samples, the concentration of MVs and EXOs was higher in cancer patients than in healthy donors (Supplementary Fig. S4). However, the results did not reach statistical significance, and it was only observed when the analysis were done with the total EV population when the EVs derived from the PCa patients and healthy donors were significantly different from each other (*P = 0.018); the mean EV concentration being higher for cancer patients (Figs. 2B and C). The concentration of ABs could not be measured due to limitations in the detection limit of the NTA technique. However, on the basis of the TEM images, there were much less ABs compared with MVs and EXOs in all samples.
EV Subpopulations Have Different Total Protein Contents
To determine the total protein contents of the EV subpopulations, the microBCA assay was used (Fig. 3). Protein results were normalized per million cells to be comparable between different cell lines. We hypothesized that depending on the origin and vesicle type, EVs would have different protein contents. As shown in Figure 3A, the total protein contents between MVs and EXOs (n = 12) from the three cell lines were different, being almost double for MVs (6 µg protein/106 cells) compared with EXOs (3.2 µg protein/106 cells). Looking at the EV subpopulations by cell line, significant differences were observed between PC-3 and RC92a/hTERT EXOs (***P = 0.001), LNCaP and PC-3 EXOs (*P = 0.034), as well as between LNCaP and PC-3 MVs (***P = 3.50E−04), LNCaP and RC92a/hTERT MVs (***P = 1.40E−05), and PC-3 and RC92a/hTERT MVs (**P = 0.0036; Fig. 3A), LNCaP MVs being the EVs with the highest protein content. In addition, the protein contents of LNCaP MVs (n = 5) and EXOs (n = 4) also significantly differed from each other, 10 µg protein/106 cells and 3 µg protein/106 cells, respectively (*P = 0.035; Fig. 3B). The total protein contents of EVs from the PCa patients and healthy donors were also analyzed. Although protein results paralleled the vesicle concentration results shown in Figure 2B, no significant differences were seen in the MVs and EXOs or as a total EV population between PCa patients and donors (Fig. 3C and Supplementary Fig. S5). To determine if there was a correlation between the particle concentration and the protein content per EV subtypes, linear regression models were developed. Samples were grouped on the basis of cellular origin. Plotting the correlation of particles per microgram of protein demonstrated a very high correlation of particles to protein in LNCaP (R2 = 0.9) and RC92a/hTERT-derived EVs (R2 = 0.6; Fig. 3C), showing in both cases a higher ratio of particles to protein in MVs than in EXOs. However, for PC-3-derived EVs there was no correspondence (R2 = 0.1), which showed that the correlation between the EV concentration and the total protein content was totally dependent on the cellular source of the EVs.
Fig 3.
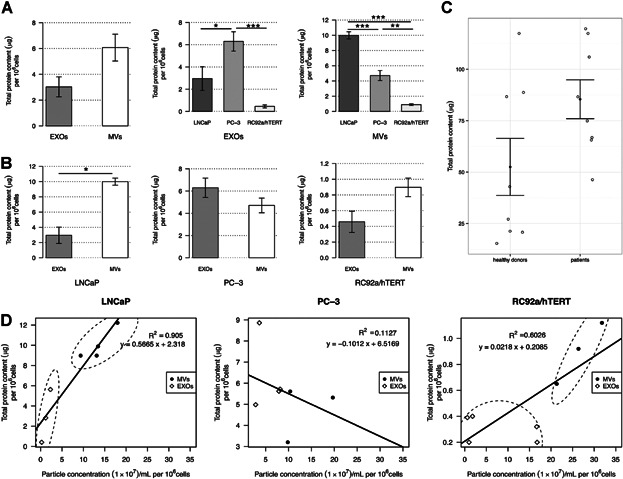
Total protein contents of EV subpopulations. A: Bar plots representing the total protein contents per million cells of microvesicles (MVs) (n = 11) and exosomes (EXOs) (n = 12) isolated from LNCaP, PC-3, and RC92a/hTERT prostate cancer cells. Error bars represent SE. P values determined by paired Wilcoxon signed ranked test. Comparison of the total protein content of EXOs and MVs between cell lines. LNCaP MVs (n = 5); PC-3 MVs (n = 3); RC92a/hTERT MVs (n = 3); LNCaP EXOs (n = 3); PC-3 EXOs (n = 4); RC92a/hTERT EXOs (n = 5); error bars represent SE; *P < 0.05, **P < 0.01, ***P < 0.001 by unpaired Student's t-test. B: Comparison of the total protein content between MVs and EXOs for LNCaP, PC-3, and RC92a/hTERT cells. Error bars represent SE; P values were determined by paired Wilcoxon signed ranked test. C: Dot plot showing the total EV protein content from patients (n = 8) and healthy donors (n = 8). Error bars represent SE; P values determined by unpaired Student's t-test. D: Linear regressions of the correlation between the EV concentration and total protein content per million cells for microvesicles (MVs) and exosomes (EXOs) isolated from prostate cancer cell lines. LNCaP MVs versus EXOs (R2 = 0.905); PC-3 MVs versus EXOs (R2 = 0.113); and, RC92a/hTERT MVs versus EXOs (R2 = 0.623).
EV Subpopulations Contain Fragments of Double-Stranded gDNA
To avoid external DNA/RNA contamination in the analysis of the intravesicular content, the EV samples were first incubated with DNase I and then with RNAse A to exclude RNA contamination, as described in Materials and Methods Section. To ensure that the DNA amplified was gDNA, the primer sequences were specifically designed spanning intronic–exonic sequences (Table II), and the used DNA pre-amplification kit was specific for gDNA. We speculated that the different EV subpopulations could also contain mutated DNA fragments dependent of the cellular origin of the EVs. For this analysis, a 108 bp fragment of MLH1 encoding intron 7 to intron 8, 225 bp fragment of PTEN spanning from exon 1 to intron 1 as well as a 316 bp fragment of TP53 encoding exon-intron 3 to exon 4 were amplified (Fig. 4 and Supplementary Fig. S3). The relative ratio of MLH1, PTEN, and TP53 fragments in EV subpopulations was assessed by qPCR, using the housekeeping GAPDH as a reference (Fig. 1A). The presence of MLH1 fragments was confirmed in all the cell-derived EV subpopulations, with the predicted product size of 108 bp, except for RC92a/hTERT EXOs, where the gene fragment was absent (Figs. 4A and B). A MLH1 mutation (I219V) has been reported in the codon 655 (A>G) for LNCaP cells, but we could not confirm this mutation in the LNCaP-derived EVs (Fig. 4C). On the other hand, PTEN fragments were detected in the LNCaP ABs and EXOs with the predicted product size of 225 bp (Fig. 4A,B). Sequencing analysis of these EV-derived DNA fragments showed a frame-shift mutation in the codon 6 (delAA) (K6fs*4), previously described in LNCaP cells [15,16]. Further, we assessed the presence of TP53 in LNCaP ABs with a 316 bp product (Fig. 4A,B), also harboring a previously described polymorphism (P72R) for LNCaP cells [17], confirming the previous observations that ABs can carry and transfer oncogenic sequences [5]. For PTEN and TP53, these mutations have been described to be absent in PC-3 cells [17], have not previously been studied in RC92a/hTERT cells, and were not identified in this study either. Finally, we assessed as a proof of concept whether the plasma EVs contained gDNA fragments. Although gDNA was present in the patient EVs, these specific mutations were not detectable in the patient cohort (Fig. 5).
Fig 5.
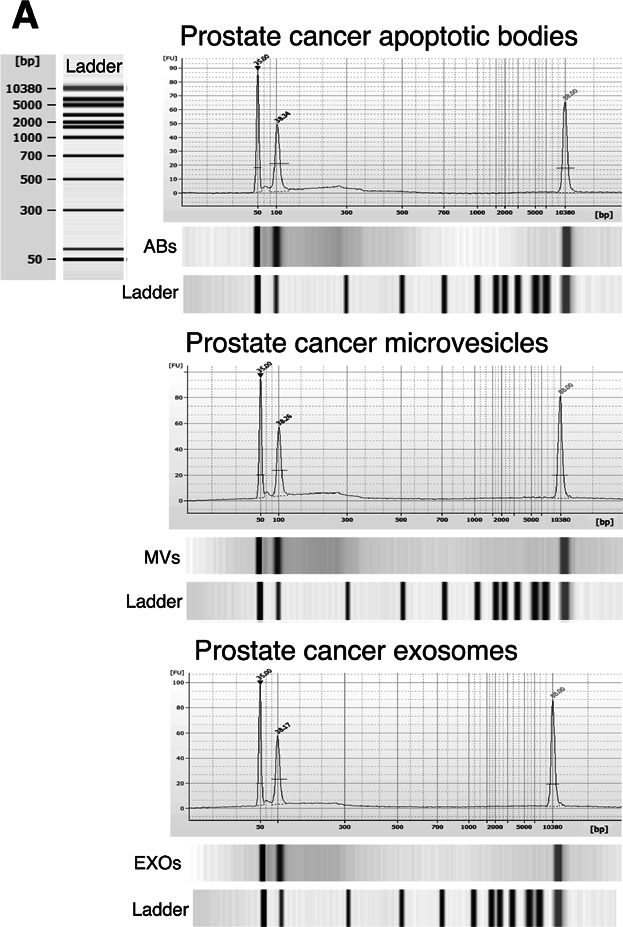
Bioanalyzer analysis of gDNA in plasma-derived EVs from prostate cancer patients. Pre-amplified EV-derived DNA isolated from 2 mL of plasma together with DNA markers were analyzed using a 2100 Bioanalyzer. Vertical axis (FU) represents the fluorescent units and horizontal axis shows the number of base pairs. The two picks at 50 and 10,380 bp represent the DNA markers. Apoptotic bodies (ABs); microvesicles (MVs); exosomes (EXOs). Representative images of prostate cancer patients are showed.
Discussion
EVs are considered to play a key role in cell-to-cell communication since they may transfer the genetic cargo of their parental cells, and thus modulate the biological functions of their recipient cells [18,19]. It is known that EVs contain proteins, lipids, mRNA and microRNA fragments [20,21] but the presence of DNA has not been systematically reported so far. Mitochondrial DNA was found in astrocyte- and glioblastoma-derived EXOs [22], and single-stranded DNA and transposable elements were described in glioblastoma-derived MVs [23]. In the present study, we show that the PCa EVs contain double-stranded gDNA fragments in all the different EV subpopulations: ABs, MVs, and EXOs. Just recently, the presence of gDNA was first reported in the EXOs of patients with pancreatic cancer [24] which our findings accordingly complement.
The presence of a part of both TP53 and PTEN genes in the EV subpopulations was investigated as they are the only genes significantly mutated in both localized and castration-resistant PCa tumors, with a broad role in cancer initiation, progression and treatment resistance [25]. On the other hand, MLH1 germline mutations were researched since they are very rare in prostate tumors. In this preliminary study, we could detect different gDNA cargos in diverse EV subpopulations, which indicate that the molecular content of the EVs is dependent on both the cellular source and the specific vesicle subtype. Further, we also demonstrate that the EV-derived DNA has the same mutations in TP53 and PTEN genes as in their parental tumor cells. The concept of EV subpopulation and cell type-dependent packing of molecular cargo is further supported by our finding of differential total protein content within the EV subtypes, despite the similar concentrations of the PCa cell-derived MVs and EXOs.
Moreover, we also provide evidence as a proof of concept that human plasma-derived EVs also carry double-stranded gDNA fragments, and that plasma-derived EVs are more abundant in PCa patients than in healthy donors, as has been previously reported in other cancer types [26]. However, the previously described mutations for the LNCaP-derived EVs were not detected from the plasma EV populations. The inability to detect specific mutations in patients' samples could be due to the heterogeneous origin of EVs in the blood circulation, since EVs are also released from other non-cancerous cells. Alternatively, it could reflect that these specific mutations were absent in this patient cohort. Further studies are required to develop techniques to selectively enrich and isolate tumor EV subpopulations from the total EV pool in plasma.
Lately, the EV-mediated education of hematopoietic cells within the bone marrow has been suggested to be a fundamental step in the formation of pre-metastatic niches [27]. We propose that by the secretion of EVs, part of the gDNA content of the cell can vesicle-specifically be sorted and travel around the body as a EV-protected circulating DNA, which contributes to both pre-metastatic niche formation and tumor metastasis. As the EV cargo also likely represents the dynamic molecular changes in the tumor and its progression [26], EVs make a promising candidate for diagnostic biomarkers. As DNA is intrinsically more stable than RNA, the analysis of genomic mutations may also be a more robust and sensitive marker of dynamic changes. We consider that the horizontal transfer and uptake of DNA mediated by ABs, MVs, and EXOs could be one possible mechanism for the generation of genetic instability and diversity in cancer. Altogether, these preliminary results warrant further research to use tumor EVs and their gDNA content as an additional biomarkers for diagnosis, prognosis and management of PCa.
Conclusions
We have reported that different EV subpopulations derived from PCa cell lines and plasma samples contain different double-stranded genomic DNA fragments which, depending on the cell source, can also be mutated. These results may offer an explanation for the horizontal transfer of oncogenes between cancer and normal cells via EV-mediated transfer of gDNA. Because tumor cells can release EVs into the blood stream, they could provide a stable source of genetic information for cancer diagnosis, prognosis and treatment. However, identification of more PCa-specific nucleic acid biomarkers in EV subpopulations as well as their correlation to clinical parameters are needed before EVs can be fully utilized in tumor diagnostics.
Acknowledgments
This research was supported by grants from the Finnish Cultural Foundation (no. 00130502, E.L.I.), Academy of Finland Research Fellow (no. 273689–266486, A.S.G and C.E.L.), Magnus Ehrnrooth Foundation and the Medicinska Understödsföreningen Liv och Hälsa r.f. (P.S.), Health Research Fund (FIS) from the Carlos III Health Institute (PI10/01069 and CP11/00147, A.A.S.) and Academy of Finland (no. 259990, M.Y.). Authors are grateful to Carolina Gandia for her excellent technical assistance. We are thankful to J.S. Rhim and Kopeček J.R. for the gift of the RC92a/hTERT cell line. We thank our colleagues in Orion Pharma for helpful discussions. The patients and donors participating in the study are gratefully acknowledged.
Supporting Information
Additional supporting information may be found in the online version of this article at the publisher's web-site.
References
- 1.Kalra H, Simpson RJ, Ji H, Aikawa E, Altevogt P, Askenase P, Bond VC, Borràs FE, Breakefield X, Budnik V, Buzas E, Camussi G, Clayton A, Cocucci E, Falcon-Perez JM, Gabrielsson S, Gho YS, Gupta D, Harsha HC, Hendrix A, Hill AF, Inal JM, Jenster G, Krämer-Albers EM, Lim SK, Llorente A, Lötvall J, Marcilla A, Mincheva-Nilsson L, Nazarenko I, Nieuwland R, Nolte-'t Hoen EN, Pandey A, Patel T, Piper MG, Pluchino S, Prasad TS, Rajendran L, Raposo G, Record M, Reid GE, Sánchez-Madrid F, Schiffelers RM, Siljander P, Stensballe A, Stoorvogel W, Taylor D, Thery C, Valadi H, van Balkom BW, Vázquez J, Vidal M, Wauben MH, Yáñez-Mó M, Zoeller M, Mathivanan S. Vesiclepedia: A compendium for extracellular vesicles with continuous community annotation. PLoS Biol. 2012;10(12):e1001450. doi: 10.1371/journal.pbio.1001450. [DOI] [PMC free article] [PubMed] [Google Scholar]
- 2.Burger D, Schock S, Thompson CS, Montezano AC, Hakim AM, Touyz RM. Microparticles: Biomarkers and beyond. Clin Sci. 2013;124(7–8):423–441. doi: 10.1042/CS20120309. [DOI] [PubMed] [Google Scholar]
- 3.Bobrie A, Colombo M, Krumeich S, Raposo G, Thery C. Diverse subpopulations of vesicles secreted by different intracellular mechanisms are present in exosome preparations obtained by differential ultracentrifugation. Journal of Extracellular Vesicles. 2012;16:1. doi: 10.3402/jev.v1i0.18397. [DOI] [PMC free article] [PubMed] [Google Scholar]
- 4.Hristov M, Erl W, Linder S, Weber PC. Apoptotic bodies from endothelial cells enhance the number and initiate the differentiation of human endothelial progenitor cells in vitro. Blood. 2004;104(9):2761–2766. doi: 10.1182/blood-2003-10-3614. [DOI] [PubMed] [Google Scholar]
- 5.Bergsmedh A, Szeles A, Henriksson M, Bratt A, Folkman M, Spetz A, Holmgren L. Horizontal transfer of oncogenes by uptake of apoptotic bodies. Proc Natl Acad Sci USA. 2001;98(11):6407–6411. doi: 10.1073/pnas.101129998. [DOI] [PMC free article] [PubMed] [Google Scholar]
- 6.Di Vizio D, Kim J, Hager MH, Morello M, Yang W, Lafargue CJ, True LD, Rubin MA, Adam RM, Beroukhim R, Demichelis F, Freeman MR. Oncosome formation in prostate cancer: Association with a region of frequent chromosomal deletion in metastatic disease. Cancer Res. 2009;69(13):5601–5609. doi: 10.1158/0008-5472.CAN-08-3860. [DOI] [PMC free article] [PubMed] [Google Scholar]
- 7.Al-Nedawi K, Meehan B, Micallef J, Lhotak V, May L, Guha A, Rak J. Intercellular transfer of the oncogenic receptor EGFRvIII by microvesicles derived from tumour cells. Nat Cell Biol. 2008;10(5):619–624. doi: 10.1038/ncb1725. [DOI] [PubMed] [Google Scholar]
- 8.D'Souza-Schorey C, Clancy JW. Tumor-derived microvesicles: Shedding light on novel microenvironment modulators and prospective. Cancer Biomarkers. 2012;26(12):1287–1299. doi: 10.1101/gad.192351.112. [DOI] [PMC free article] [PubMed] [Google Scholar]
- 9.Nilsson J, Skog J, Nordstrand A, Baranov V, Mincheva-Nilsson L, Breakefield XO, Widmark A. Prostate cancer-derived urine exosomes: A novel approach to biomarkers for prostate cancer. Br J Cancer. 2009;100(10):1603–1607. doi: 10.1038/sj.bjc.6605058. [DOI] [PMC free article] [PubMed] [Google Scholar]
- 10.Mitchell PJ, Welton J, Staffurth J, Court J, Mason MD, Tabi Z, Clayton A. Can urinary exosomes act as treatment response markers in prostate cancer. J Transl Med. 2009;7:4. doi: 10.1186/1479-5876-7-4. [DOI] [PMC free article] [PubMed] [Google Scholar]
- 11.Jansen FH, Krijgsveld J, van Rijswijk A, van den Bemd GJ, van den Berg MS, van Weerden WM, Willemsen R, Dekker LJ, Luider TM, Jenster G. Exosomal secretion of cytoplasmic prostate cancer xenograft-derived proteins. Mol Cell Proteomics. 2009;8(6):1192–1205. doi: 10.1074/mcp.M800443-MCP200. [DOI] [PMC free article] [PubMed] [Google Scholar]
- 12.Ronquist KG, Ronquist G, Carlsson L, Larsson A. Human prostasomes contain chromosomal DNA. Prostate. 2009;69(7):737–743. doi: 10.1002/pros.20921. [DOI] [PubMed] [Google Scholar]
- 13.Gabriel K, Ingram A, Austin R, Kapoor A, Tang D, Majeed F, Qureshi T, Al-Nedawi K. Regulation of the tumor suppressor PTEN through exosomes: A diagnostic potential for prostate cancer. PLoS ONE. 2013;8(7):e70047. doi: 10.1371/journal.pone.0070047. [DOI] [PMC free article] [PubMed] [Google Scholar]
- 14.Pfaffl MW. A new mathematical model for relative quantification in real-time RT-PCR. Nucleic Acids Res. 2001;29(6):2001–2007. doi: 10.1093/nar/29.9.e45. [DOI] [PMC free article] [PubMed] [Google Scholar]
- 15.Steck PA, Pershouse MA, Jasser SA, Yung WK, Lin H, Ligon AH, Langford LA, Baumgard ML, Hattier T, Davis T, Frye C, Hu R, Swedlund B, Teng DH, Tavtigian SV. Identification of a candidate tumour suppressor gene, MMAC1, at chromosome 10q23.3 that is mutated in multiple advanced cancers. Nat Genet. 1997;15(4):356–362. doi: 10.1038/ng0497-356. [DOI] [PubMed] [Google Scholar]
- 16.Li J, Yen C, Liaw D, Podsypanina K, Bose S, Wang SI, Puc J, Miliaresis C, Rodgers L, McCombie R, Bigner SH, Giovanella BC, Ittmann M, Tycko B, Hibshoosh H, Wigler MH, Parsons R. PTEN, a putative protein tyrosine phosphatase gene mutated in human brain, breast, and prostate cancer. Science. 1997;275(5308):1943–1947. doi: 10.1126/science.275.5308.1943. [DOI] [PubMed] [Google Scholar]
- 17.Spans L, Atak ZK, Van Nieuwerburgh F, Deforce D, Lerut E, Aerts S, Claessens F. Variations in the exome of the LNCaP prostate cancer cell line. Prostate. 2012;72(12):1317–1327. doi: 10.1002/pros.22480. [DOI] [PubMed] [Google Scholar]
- 18.Valadi H, Ekstrom K, Bossios A, Sjostrand M, Lee JJ, Lotvall JO. Exosome-mediated transfer of mRNAs and microRNAs is a novel mechanism of genetic exchange between cells. Nat Cell Biol. 2007;9(6):654–659. doi: 10.1038/ncb1596. [DOI] [PubMed] [Google Scholar]
- 19.Ratajczak J, Miekus K, Kucia M, Zhang J, Reca R, Dvorak P, Ratajczak MZ. Embryonic stem cell-derived microvesicles reprogram hematopoietic progenitors: Evidence for horizontal transfer of mRNA and protein delivery. Leukemia. 2006;20(5):847–856. doi: 10.1038/sj.leu.2404132. [DOI] [PubMed] [Google Scholar]
- 20.Hessvik NP, Phuyal S, Brech A, Sandvig K, Llorente A. Profiling of microRNAs in exosomes released from PC-3 prostate cancer cells. Biochim Biophys Acta. 2012;1819(11–12):1154–1163. doi: 10.1016/j.bbagrm.2012.08.016. [DOI] [PubMed] [Google Scholar]
- 21.Cocucci E, Racchetti G, Meldolesi J. Shedding microvesicles: Artefacts no more. Trends Cell Biol. 2009;19(2):43–51. doi: 10.1016/j.tcb.2008.11.003. [DOI] [PubMed] [Google Scholar]
- 22.Guescini M, Genedani S, Stocchi V, Agnati LF. Astrocytes and glioblastoma cells release exosomes carrying mtDNA. J Neural Transm. 2010;117(1):1–4. doi: 10.1007/s00702-009-0288-8. [DOI] [PubMed] [Google Scholar]
- 23.Balaj L, Lessard R, Dai L, Cho YJ, Pomeroy SL, Breakefield XO, Skog J. Tumour microvesicles contain retrotransposon elements and amplified oncogene sequences. Nat Commun. 2011;2:180. doi: 10.1038/ncomms1180. [DOI] [PMC free article] [PubMed] [Google Scholar]
- 24.Kahlert C, Melo SA, Protopopov A, Tang J, Seth S, Koch M, Zhang J, Weitz J, Chin L, Futreal A, Kalluri R. Identification of double stranded genomic DNA spanning all chromosomes with mutated KRAS and p53 DNA in the serum exosomes of patients with pancreatic cancer. J Biol Chem. 2014;288(12):26888–26897. doi: 10.1074/jbc.C113.532267. [DOI] [PMC free article] [PubMed] [Google Scholar]
- 25.Taylor BS, Schultz N, Hieronymus H, Gopalan A, Xiao Y, Carver BS, Arora VK, Kaushik P, Cerami E, Reva B, Antipin Y, Mitsiades N, Landers T, Dolgalev I, Major JE, Wilson M, Socci ND, Lash AE, Heguy A, Eastham JA, Scher HI, Reuter VE, Scardino PT, Sander C, Sawyers CL, Gerald WL. Integrative genomic profiling of human prostate cancer. Cancer Cell. 2010;18(1):11–22. doi: 10.1016/j.ccr.2010.05.026. [DOI] [PMC free article] [PubMed] [Google Scholar]
- 26.Skog J, Würdinger T, van Rijn S, Meijer DH, Gainche L, Sena-Esteves M, Curry WT, Jr, Carter BS, Krichevsky AM, Breakefield XO. Glioblastoma microvesicles transport RNA and proteins that promote tumour growth and provide diagnostic biomarkers. Nat Cell Biol. 2008;10(12):1470–1476. doi: 10.1038/ncb1800. [DOI] [PMC free article] [PubMed] [Google Scholar]
- 27.Peinado H, Alečković M, Lavotshkin S, Matei I, Costa-Silva B, Moreno-Bueno G, Hergueta-Redondo M, Williams C, García-Santos G, Ghajar C, Nitadori-Hoshino A, Hoffman C, Badal K, Garcia BA, Callahan MK, Yuan J, Martins VR, Skog J, Kaplan RN, Brady MS, Wolchok JD, Chapman PB, Kang Y, Bromberg J, Lyden D. Melanoma exosomes educate bone marrow progenitor cells toward a pro-metastatic phenotype through MET. Nat Med. 2012;18(6):883. doi: 10.1038/nm.2753. [DOI] [PMC free article] [PubMed] [Google Scholar]
Associated Data
This section collects any data citations, data availability statements, or supplementary materials included in this article.