

Abstract
Resting‐state studies conducted with stroke patients are scarce. The study of brain activity and connectivity at rest provides a unique opportunity for the investigation of brain rewiring after stroke and plasticity changes. This study sought to identify dynamic changes in the functional organization of the default mode network (DMN) of stroke patients at three months after stroke. Eleven patients (eight male and three female; age range: 48–72) with right cortical and subcortical ischemic infarctions and 17 controls (eleven males and six females; age range: 57–69) were assessed by neurological and neuropsychological examinations and scanned with resting‐state functional magnetic ressonance imaging. First, we explored group differences in functional activity within the DMN by means of probabilistic independent component analysis followed by a dual regression approach. Second, we estimated functional connectivity between 11 DMN nodes both locally by means of seed‐based connectivity analysis, as well as globally by means of graph‐computation analysis. We found that patients had greater DMN activity in the left precuneus and the left anterior cingulate gyrus when compared with healthy controls (P < 0.05 family‐wise error corrected). Seed‐based connectivity analysis showed that stroke patients had significant impairment (P = 0.014; threshold = 2.00) in the connectivity between the following five DMN nodes: left superior frontal gyrus (lSFG) and posterior cingulate cortex (t = 2.01); left parahippocampal gyrus and right superior frontal gyrus (t = 2.11); left parahippocampal gyrus and lSFG (t = 2.39); right parietal and lSFG (t = 2.29). Finally, mean path length obtained from graph‐computation analysis showed positive correlations with semantic fluency test (r s = 0.454; P = 0.023), phonetic fluency test (r s = 0.523; P = 0.007) and the mini mental state examination (r s = 0.528; P = 0.007). In conclusion, the ability to regulate activity of the DMN appears to be a central part of normal brain function in stroke patients. Our study expands the understanding of the changes occurring in the brain after stroke providing a new avenue for investigating lesion‐induced network plasticity. Hum Brain Mapp 36:577–590, 2015. © 2014 The Authors Human Brain Mapping Published by Wiley Periodicals, Inc.
Keywords: default mode network, probabilistic independent component analysis, seed‐based connectivity analysis, graph‐computation analysis
Abbreviations
- Tests
- FBI
Frontal Behavioral Inventory
- GDS
Geriatric Depression Scale
- GPT
Grooved Pegboard Test
- IQ
Intelligence Quotient
- IQCODE
Informant Questionnaire on Cognitive Decline in the Elderly
- MMSE
Mini Mental State Examination
- MoCA
Montreal Cognitive Test
- NIHSS
National Institutes of Health Scale National Institutes of Health Scale
- TMTA
Trail Making Test part‐A
INTRODUCTION
Nearly one in four stroke patients has cognitive impairment severe enough to be diagnosed as dementia [Desmond et al., 2002; Sachdev et al., 2004; Sachdev et al., 2014] and another one in three has milder levels of cognitive impairment [Sachdev et al., 2006]. While some patients may show recovery over an extended period [Desmond et al., 1996], an overall decline in cognitive function is to be expected [Aharon‐Peretz et al., 2002; del Ser et al., 2005; Nyenhuis et al., 2002; Srikanth et al., 2004; Sachdev et al., 2014] Post‐stroke cognitive symptoms cannot be explained only by the location of the infarction, rather they seem to be attributable to impairment of cortical regions which are remote from the ischemic lesion. A possible explanation for these remote effects can be the disruption of neuronal function at remote cerebral regions belonging to certain functional networks [Crofts et al., 2011; Dacosta‐Aguayo et al., 2014a; Kaiser et al., 2007].
S pontaneous restitution of lost cognitive function has been associated with brain plasticity, which is the brain ability to compensate for functional loss through reorganization of neuronal networks [van Meer et al., 2010; van Meer et al., 2012].
The default mode network (DMN) is one of the most widely studied and precisely identified functional brain networks at rest. This network comprises a set of functionally highly connected regions including the medial prefrontal cortex (MPFC), the posterior cingulate cortex (PCC), the lateral inferior temporal lobe and the medial temporal lobe, and the posterior inferior parietal Lobule (piPL) [Greicius et al., 2003; Raichle et al., 2001; Shulman et al., 1997]. During rest periods, the DMN presents higher levels of activity than other networks [Buckner et al., 2008; Fox et al., 2005]. It is hypothesized that the DMN is active while a person is not performing a goal oriented task, and that during this period the activity in the DMN reflects undirected, spontaneous, conscious mentation, or monitoring of the external environment [Gusnard and Raichle, 2001; Raichle et al., 2001; Shulman et al., 1997) Consistently with this hypothesis, this network deactivates during cognitive task [Dasellar et al., 2004; Miller et al., 2008; Wang et al., 2010]. The term “deactivate” refers to the fact that there is a decrease of activity in the DMN during cognitive tasks compared to baseline. DMN disruption has been commonly observed by resting‐state functional studies in patients with mild cognitive impairment [Wang et al., 2006; Sorg et al., 2007], vascular cognitive impairment with subcortical lesions [Sun et al., 2011], patients with carotid stenosis [Cheng et al., 2012; Lin et al., 2014], and patients with stroke [Tuladhar et al., 2013]. Despite the considerable interest of this network, little is known about its possible alterations in ischemic stroke patients. Probabilistic independent component analysis (pICA) can identify networks of coactivating brain areas based on a linear decomposition of the data and, therefore, it may miss nonlinear relationships in the data [Friston, 2000]. Graph theory is a mathematical tool that has been recently applied to rs‐fMRI data with the goal of studying the organization of network nodes (i.e., connections) at both the local and whole‐brain levels [Bullmore and Sporns, 2007; Buckner et al., 2009]. In both, structural and functional MRI data, brain networks have been found to be so consistently organized [Buckner et al., 2009; Friston, 2000] that disruptions can be used as a biomarker [Nomura et al., 2010]. Graph‐computation analysis (GCA) allows detection of small‐scale changes in regional organization that may underlie more global network changes.
We, therefore, investigated, as an extension of our previous study [Dacosta‐Aguayo et al., 2014a], the alterations in the functional connectivity of the DMN in ischemic stroke patients during resting‐state condition, to assess more accurately DMN integration and segregation properties three months after ischemic stroke. For this purpose, we used pICA, seed‐based connectivity analysis (SBCA), and GCA to determine the functional connectivity of the DMN in a group of subacute stroke patients after a right hemispheric stroke (Fig. 1). We computed connectivity estimates between 11 specific ROIs belonging to the DMN [Watanabe et al., 2013] to study measures of connectivity between those ROIs, testing changes in local and global network structure that may occur following stroke. We chose different methods because they investigate the networks at various levels and, therefore, they complement each other: pICA detects nodes of the networks (voxelwise), SBCA tests local correlation between the different nodes and, finally, GCA investigates the global connectivity of the network. We hypothesized that functional connectivity measures at any level would reveal changes characteristic to the stroke patients. Previous studies indicate disruption in the inter‐hemispheric connectivity [Cheng et al., 2012; Tuladhar et al., 2013]. There is also a growing evidence that some of the most affected regions are the medial parietal areas (PCC) [Cheng et al., 2012; Sun et al., 2011; Tuladhar et al., 2013], the MPFC [Lin et al., 2014; Tuladhar et al., 2013], and the hippocampus [Cheng et al., 2012; Sun et al., 2011; Tuladhar et al., 2013]. Finally, we expected to find a strong negative correlation between the size of the lesion and the functional connectivity, that is: the larger the injury, the worst the connectivity.
Figure 1.
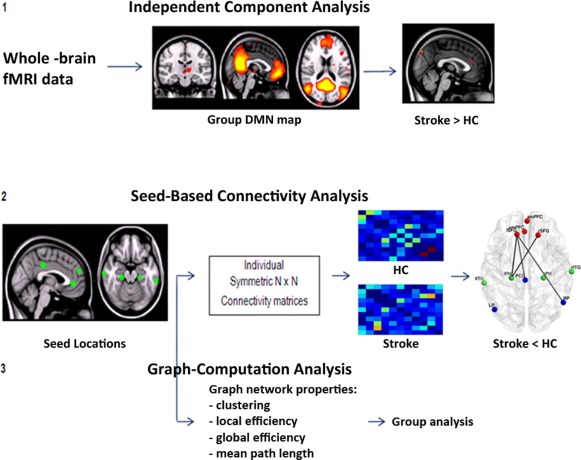
Flowchart of the method process.
MATERIALS AND METHODS
Study Participants
The stroke group comprised 29 right handed (measured with the Edinburgh Test) consecutive patients admitted to the stroke unit Germans Trias i Pujol Hospital affiliated with the University Autonomous of Barcelona. Participants were aged 42 to 72 years, they did not have a diagnosis of dementia or other neurologic disorder prior to the stroke, they did not have severe aphasia (a score of < 2 on NIHSS) [Brott et al., 1989], and they were well enough to consent to participate. Participants rating on the 16‐item IQCODE [Morales‐González et al., 1992] as well as in the FBI [Kertesz et al., 1997] indicated an absence of prestroke cognitive impairment. Exclusion criteria included hemorrhagic stroke, persistent impairment of consciousness following stroke, concomitant central nervous system disease known to affect cognition, actual medical disease that is judged to possibly affect cognition secondarily, alcohol dependence, and contraindications to MRI (pacemaker, metallic foreign bodies, and severe claustrophobia). From these patients, we only selected those that had a stroke in the right hemisphere (n = 17). From these 17 patients, four patients were discarded due to absence of apparent injury at three months according to the neuroradiologist report (based on T1‐weighted image), and two more due to excessive motion during the functional measurement. The final sample comprised 11 patients with right hemispheric stroke. We chose to include only right hemispheric stroke patients because adding a few more (n = 12) subjects with very different lesion locations (i.e., lesion on the other hemisphere), would have added a lot of unimportant variance (i.e., noise). To control it, we would have to add extra regressors to the model, which, in turn, would have decreased the degree‐of‐freedom (i.e., sensitivity).
The control group comprised 17 stroke‐free participants from the Barcelona AsIA Neuropsychology study [López‐Cancio et al., 2011; Miralbell et al., 2012].They were screened for absence of cognitive impairment and psychiatric disorder on history and examination, with the same exclusion criteria as the stroke patients. Approval was obtained from the University of Barcelona ethics committee (Comissió de Bioètica de la Universitat de Barcelona; Institutional Review Board 00003099 Assurance number: FWA00004225; http://www.edu/recerca/comissiobioetica.htm), and informed consent was obtained from each participant, and study was conducted according to the provisions of the Helsinki declaration.
Neuropsychological Data
Patients underwent neuropsychological examinations both within 72 h after the stroke (acute phase) and three months later (subacute phase). The neuropsychological battery comprised the following tests pertaining to various cognitive domains: attentional abilities were explored by the Digit Span Forward Test (WAIS‐III‐R) [Wechsler, 1999], the subtest of attention extracted from de Montreal Cognitive Test (MoCA) [Nasreddine et al., 2005], and the Line Cancellation Test [Strauss et al., 2006]. Executive abilities were assessed with the digit span backwards from WAIS‐III‐R) [Wechsler, 1999], Phonological fluency (letter P) [Strauss et al., 2006], and semantic fluency (animals) [Strauss et al., 2006]. Language abilities were assessed with spontaneous speech (talking briefly about his/her health problems), repetition, understanding items extracted from The Mental Status Examination in Neurology [Strub and Black, 2000], writing of one sentence, item extracted from the MMSE [Folstein et al., 1983], and naming with the short version (15‐items) of the Boston Naming Test [Kaplan et al., 1983]. Premotor abilities were assessed with Luria's sequences test [Folstein et al., 1983], Rhythms subtest extracted from the MoCA test [Nasreddine et al., 2005], and interference and inhibitory control subtest extracted from the Frontal Assessment Battery [Dubois et al., 2000]. Psychomotor speed was assessed with the TMTA [Strauss et al., 2006] and the GPT [Ruff and Parker, 1993]. Neuropsychological examinations also included the MMSE [Folstein et al., 1983], as a global cognitive test and the GDS [Yesavage et al., 1982]. Assessments were conducted by trained psychologists. Participants were given breaks where appropriate to minimize the effects of fatigue on performance. Raw cognitive test scores and standard deviations are reported (Table 2).
Table 2.
Neuropsychological tests scores at three months for the healthy control and stroke subgroups
| HC (n = 17) | Stroke (n = 11) | P | |
|---|---|---|---|
| General cognitive function | |||
| MMSE | 30 [30–28] | 28 [29–26] | <0.01 |
| Attentional abilities | |||
| MoCA subtest (/11) | 11 [11–10.5] | 11 [11–10] | 0.105 |
| Digit span forward (WAIS‐III) | 4.9 ± 1.1 | 5.0 ± 1.5 | 0.91 |
| Right line cancellation test (/18) | 18 [18–18] | 18 [18–18] | 0.430 |
| Left line cancellation test (/18) | 18 [18–18] | 18 [18–17] | 0.430 |
| Executive abilities | |||
| Digit span backwards (WAIS‐III) | 3.0 [4–3] | 4.0 [4–3] | 0.92 |
| Letter (P) | 11.4 ± 2.9 | 9.3 ± 4.6 | 0.15 |
| Semantic (Animals) | 18 [18.5–13] | 13 [17–12] | 0.28 |
| Premotor abilities | |||
| Luria' sequences (/5) | 5 [5–5] | 5 [5–0] | 0.07 |
| Rhythms subtest (/10) | 9 [10–8] | 8 [8–7] | 0.04 |
| Interference and inhibitory control (/3) | 3 [3–2] | 3 [2–1] | 0.27 |
| Language | |||
| Boston naming test (/15) | 11.1 ± 2.1 | 10.8 ± 2.6 | 0.79 |
| Psychomotor speed (s) | |||
| Trail making test A | 56.2 ± 23.6 | 80.6 ± 29.8 | 0.02 |
| Grooved pegboard test (preferred hand) | 73.7 ± 10.7 | 85.1 ± 22.9 | 0.15 |
Values are means ± standard deviations in Student's t‐test or medians (percentile 25–75) in Mann–Whitney test for continuous variables.
Bold values statistically significant at P < 0.05.
Statistical analyses were performed with the Statistical Package for the Social Sciences (SPSS, Chicago), version 17.0 for Windows. Distributions of demographic variables were tested for normality by the Shapiro–Wilk test and we examined group differences using parametric (t‐test) and nonparametric (Mann–Whitney test) independent sample tests for continuous variables and Chi‐Square or Fisher's exact test for categorical variables. The threshold for statistical significance was set at two‐sided P < 0.05.
Lesion Analysis
Infarct depth (cortical, subcortical, or both), laterality (left/right), and vascular territory involved were determined within the first 24 h using computed tomography and/or magnetic resonance. Lesion volume was calculated in the subacute phase as the product of the three largest lesion diameters, along the three orthogonal axes, divided by 2 [Sims et al., 2009].
Resting‐State FMRI
Image acquisition
Data were acquired at the subacute phase (three months) using a Siemens Magnetom Trio operating at three Tesla at the Image Platform of IDIBAPS, Centre de diagnostic per la Image from Hospital Clínic (CDIC), Barcelona. We used a 32‐channel phased‐array head coil with foam padding and headphones to restrict head motion and scanner noise. Resting‐state fMRI data were acquired using an echo‐planar imaging sequence (repetition time = 2 s; echo time = 29 ms; flip angle = 80°; in plane spatial resolution = 3 × 3 mm2; field of view = 240 × 240 mm2; slice thickness = 4 mm; number of slices = 32; number of volumes = 240; acquisition time = 8 min). Participants were instructed to lie still with their eyes closed but remaining awake. All images were visually inspected to ensure that they did not contain MRI artifacts or excessive movement before analysis.
pICA of resting‐state fMRI data
The analysis was carried out using pICA as implemented in MELODIC 3.10 bundled in FSL 4.1.9 (FMRIB Centre, Department of Clinical Neurology, University of Oxford, http://www.fmrib.ox.ac.uk/fsl). The fMRI data preprocessing consisted of the removal of the first six volumes to ensure saturation and adaptation of the participants to the imaging environment, leaving 234 volumes for further analysis, removal of non‐brain structures using Brain Extraction Tool, motion correction using MCFLIRT, high‐pass filtering with a frequency cut‐off at 150 s, low‐pass temporal filtering (5.6 s), spatial smoothing using a Gaussian kernel with full‐width half‐maximum of 5 mm, intensity in homogeneity normalization, and affine linear registration to the subject's anatomical T1‐weighted image, and to the MNI 152 2 mm resolution standard template. Absolute head movement was below 1.5 mm for all participants included. Next, pICA group analysis was conducted using temporal concatenation approach (Multi‐session temporal concatenation), which decomposes the group data into a set of independent components (ICs). Each IC consists of a triplet of (a) time courses, (b) spatial maps, and (c) subject modes, which characterize the signal variation across the temporal, spatial, and subject domains. Subject modes are the quantification of the mean BOLD response for each subject within an IC. We selected the IC map of the DMN from the whole set of ICs. The selection procedure was performed by visual inspection and spatial cross‐correlation between the ICs and template available online [Biswal et al., 2010; Smith et al., 2009]. The ICs of the DMN was then introduced into a dual regression analysis [Filippini et al., 2009; Sharp et al., 2011]. In this analysis, the preprocessed functional data of each subject were first regressed against the spatial IC maps, yielding individual time series associated with the DMN. These time series were then used to regress again the individual preprocessed fMRI data and to obtain individual spatial maps. Spatial maps were finally tested for voxel‐wise differences between groups using nonparametric testing with 5000 random permutations [Nichols and Holmes, 2002]. We applied a mask to ensure that only voxels involved in the DMN were evaluated. After family‐wise error (FWE) correction, differences with P < 0.05 were considered significant. Anatomical labeling of activations was performed with reference to the Harvard‐Oxford cortical and subcortical structural atlases (http://fsl.fmrib.ox.ac.uk/fsl/fslwiki/Atlases).
We extracted the DMN activation strength from the peak of the significant areas for each individual (patients and controls). The extracted values were further used to study the relationship between connectivity and cognitive performance using Pearson correlation analysis.
SBCA of the DMN
According to previous reports [Watanabe et al., 2013], we selected 11 spherical ROIs as representatives of the main nodes of the DMN (see Table 3). First level fMRI data processing was carried out using FEAT (FMRI Expert Analysis Tool) Version 5.98, bundled in FSL. For each subject, the mean timeseries of all those ROIs was stored into a matrix of 11 columns (regions) by 234 rows (time points). To reduce the influence of head movement, six motion parameters were regressed out from each mean timeseries: the three sets of translations (in the x, y, and z directions) estimated in the image realignment phase with MCFLIRT after running MELODIC and the three first‐order differences of these translations.
Table 3.
Coordinates of brain ROIs in the DMN
| Region | MNI coordinates | ||
|---|---|---|---|
| X | Y | Z | |
| Anterior medial PFC (amPFC) | 1 | 55 | 26 |
| Ventro‐medial PFC (vmPFC) | −3 | 40 | 0 |
| Left SFG (lSFG) | −14 | 36 | 59 |
| Right SFG (rSFG) | 17 | 35 | 58 |
| Left ITG (lITG) | −62 | −33 | −20 |
| Right ITG (rITG) | 66 | −17 | −19 |
| Left parahippocampal gyrus (lPH) | −22 | −26 | −21 |
| Right parahippocampal gyrus (rPH) | 25 | −26 | −18 |
| PCC | −2 | −29 | 39 |
| Left lateral parietal (LP) | −47 | −71 | 35 |
| Right lateral parietal (RP) | 54 | −61 | 36 |
PFC, prefrontal cortex; SFG, superior frontal gyrus; ITG, inferior temporal gyrus; PCC, posterior cingulate cortex.
On the regional functional representatives contained in these matrices, region‐to‐region partial correlation weighted matrices (rij) were calculated for each subject. Then, to normalize the correlation coefficients we applied Fisher's transformation [Fransson, 2005; Long et al., 2008; Raichle et al., 2001]. Furthermore, we compute separate mean correlation weighted matrices for the patient and control groups.
We used Network‐Based Statistics (NBS) v1.2 [Zalesky et al., 2010] (http://www.nitrc.org/projects/nbs/) to isolate the components of the 11 × 11 connectivity weighted matrices that differ significantly between the two groups. A component is a set of interconnected edges in the connectivity matrix. The NBS analysis first performed a two‐sample t‐test at each edge independently to test the null hypothesis (H 0) that the values of connectivity between the two populations come from distributions with equal means. After that, a preselected T‐value (T‐threshold = 2) is used to threshold the statistical value calculated at each edge of the connectivity matrix to identify the set of suprathreshold edges. All interconnected components present in the set of suprathreshold edges are identified and their size (number of edges that the components comprise) is stored. Thus, a component is formed by interconnected suprathreshold edges at which the H 0 was rejected. To estimate the significance of each component, the NBS performed a nonparametric permutation test (K = 5000 permutations). A total of K random permutations are generated independently; for each permutation the group to which each subject belongs is randomly exchanged, and then the statistical test is recalculated in each permutation. After that, the same threshold is applied to create the set of suprathreshold links for each K permutation. Then, the size of the largest component in the set of suprathreshold links derived from each K permutation is stored, thus providing an empirical estimation of the null distribution of the maximal component size. Finally, the P‐value of each observed connected component was corrected, calculating the proportion of the 5000 permutations for which the largest component size was greater than the observed connected component size and then normalized by K. This allowed us to control the FWE.
Graph‐computation analysis
For the calculation of graph network properties, we used the Brain Connectivity Toolbox, from Rubinov and Sporns [2010], (https://sites.google.com/site/bctnet/). First, we calculated the following measures of functional segregation for every subject: clustering, defined as the inherent tendency to cluster nodes into tightly connected neighborhoods [Onnela et al., 2005; Watts and Strogatz, 1998], and local efficiency, defined as the average of the global efficiency of the level of the local subnetworks [Latora and Marchiori, 2001]; second, we calculated measures of functional integration for every subject: mean path length, defined as the average distance (in terms of node–node connection) that must be traversed to connect one mode with another [Watts and Strogatz, 1998] and global efficiency, defined as a measure of how much parallel information can potentially be exchanged [Latora and Marchiori, 2001]. Finally, we compared each patient's network measures with the corresponding values obtained in control participants, using Crawford's Z test as a more appropriate an established approach for small samples size [Crawford and Garthwaite, 2004; Crawford et al., 2003a,b]. We correlated those measures with patient's cognitive scores. Threshold of significance for those correlations was set at P = 0.05 FWE corrected for multiple permutation testing.
RESULTS
Demographical and Clinical Data
Anatomical regions and arterial distribution affected by the stroke are described in Table 1. In brief: patients showed lesions that affected the right hemisphere of the following regions: insular cortex (n = 4), parietal lobe (n = 4), temporal lobe (n = 3), frontal lobe (n = 3), lentiform nucleus (n = 2); basal ganglia (n = 2), corona radiata (n = 2), and the occipital lobes (n = 2). Lesion overlap is represented in Figure 2. There were no statistically significant differences between stroke group and control group regarding age, gender, years of education, premorbid IQ, handedness, or vascular risk factors (Table 1).
Table 1.
Demographic and clinical characteristics of patients and control participants
| Characteristics | Control participants (n = 17) | Patients with stroke (n = 11) |
|---|---|---|
| Age, mean (SD), yearsa | 63.8 (3.6) | 61.9 (7.9) |
| Educational level, mean (SD), yearsb | 6.8 (3.6) | 8.1 (6.1) |
| Edinburgh Test, mean (SD)c | 95.3 (13.9) | 97.7 (4.1) |
| Premorbid IQ, mean (SD)d | 37.9 (8.1) | 36.5 (10.4) |
| Gender, No. | ||
| Male (%) | 11 (64.7) | 8 (72.7) |
| GDS | 2.3 (3.5) | 1 (2–0) |
| Vascular Risk Factors, No (%) | ||
| Alcohol intake | 9 (52.9) | 2 (18.2) |
| Smoking | 6 (35.3) | 3 (27.3) |
| Hypertension | 8 (47.1) | 5 (45.5) |
| Diabetes Mellitus | 1 (5.9) | 4 (36.4) |
| Dyslipidemia | 9 (52.2) | 6 (54.5) |
| NIHSS at three months, median (interquartile range) | — | 1.50 (3.5–0) |
| Barthel scale at three months, mean (SD) | — | 89.55 (17.9) |
| Ranking scale at three months, median (interquartile range) | — | 2 (2–0.5) |
| S‐IQCODE at three months, mean (SD) | 51.8 (1.8) | 53.6 (4.65) |
| Lesion volume (cm3), median (interquartile range) | — | 17.60 (42–7.30) |
| Anatomical regions affected | ||
| Insular cortex | — | 4 |
| Lentiform nucleus | — | 2 |
| Basal Ganglia | — | 2 |
| Corona Radiata | — | 2 |
| Occipital lobes | — | 2 |
| Temporal lobes | — | 3 |
| Parietal lobes | — | 4 |
| Frontal lobes | — | 3 |
| Arterial distribution | ||
| MCA | — | 8 |
| ACA | — | 2 |
| PCA | — | 2 |
Abbreviations: IQ, Intelligence Quotient measured with the vocabulary subtest (Wechsler Adults Intelligence Scale (WAIS‐III‐R); GDS, Geriatric Depression Scale; NIHSS, National institute of Health Stroke Scale; S‐IQCODE, Short version of the Informant Questionnaire on Cognitive Decline in the Elderly.
t = 0.734; P = 0.476.
t = −0.695; P = 0.493.
z = 0.304; P = 1.00.
t = 0.409; P = 0.686.
Figure 2.
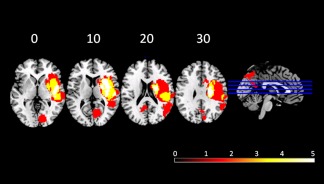
Frequency distribution of the lesions for patients. Images are depicted in radiological convention (R‐L).
Neuropsychological Data
Stroke patients showed statistically significant impairment at three months following stroke in the general cognitive function measured by the MMSE, premotor functions measured by the Rhythms subtests, and psychomotor and speed measured by the time to complete the TMTA at three months after stroke (Table 2).
DMN Activity: IC Analysis
Using pICA with temporal concatenation, a set of 55 ICs was estimated using the Laplace approximation to the Bayesian evidence of the model order [Beckmann and Smith, 2004; Minka, 2000]. Within all ICs obtained, we identified 12 common resting‐state functional networks [Biswal et al., 2010; Smith et al., 2009; van den Heuvel et al., 2010] (Fig. 3a,b) particularly the DMN. Stroke patients had greater functional activity than controls within the DMN in the left anterior cingulate gyrus and the left precuneus cortex (Fig. 4). The increase of activity in the left anterior cingulate gyrus was related to line cancellation test (r = −0.747; P = 0.000).
Figure 3.
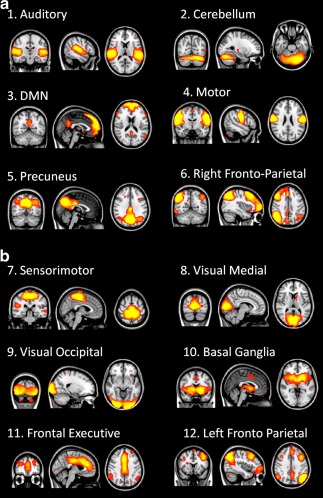
(a) and (b) Twelve common resting state networks identified with pICA for the two groups.
Figure 4.
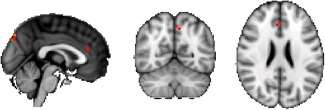
Orthogonal view. Increased activity within the default mode network in patients with stroke relative to healthy controls. Red regions represent areas where the activity differed significantly between patients and controls. Significant at P < 0.05 (family‐wise error corrected).
Local DMN Connectivity: Seed‐Based Connectivity Analysis
SBCA detected affected connectivity between the following pair of ROIs for the stroke patients: left superior frontal gyrus (lSFG) and PCC (t = 2.01); left parahippocampal (lPH) gyrus and right superior frontal gyrus (rSFG) (t = 2.11); lPH gyrus and lSFG (t = 2.39) and between right parietal (RP) and lSFG (t = 2.29) (Fig. 5). All these connections were identified as part of an across‐patients affected DMN subnetwork, altered with regard controls with a statistical significance of P = 0.014 (see Table 3 for coordinates and abbreviations; Fig. 6).
Figure 5.
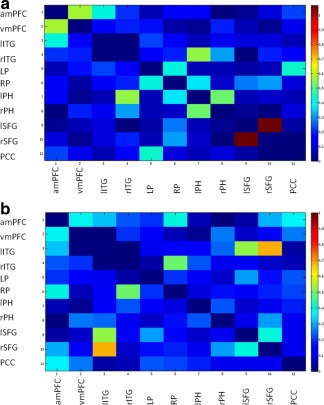
Mean correlation coefficient weighted matrices (Fisher transformed) for every pair‐wise region for the group of controls (a) and for the group of patients (b). (1) amPFC; (2) vmPFC; (3) lITG; (4) rITG; (5) LP; (6) RP; (7) lPH; (8) rPH; (9) lSFG; (10) rSFG; and (11) PCC.
Figure 6.

Graph visualization of the correlation coefficient weighted matrices thresholded at P < 0.05, FWE corrected (5000 permutations). Mean correlations for the group of controls; mean correlations for the group of patients; significant differences between patients and controls. amPFC: anterior middle prefrontal cortex; vmPFC: ventro medial prefrontal cortex; rSFG: right superior frontal gyrus; lSFG: left superior frontal gryrus; rITG: right inferior temporal gyrus; lITG: left inferior temporal gyrus; lPH: left parahippocampal; rPH: right parahippocampal; LP: left parietal; RP: right parietal; PCC: posterior cingulate cortex.
Global DMN Connectivity: GCA
We found statistical significant correlations between the mean path length and the following tests: scoring in the Semantic Fluency test (r s = 0.454; P = 0.023), scoring in the Phonetic Fluency test (r s = 0.523; P = 0.007), and scoring in the MMSE (r s = 0.528; P = 0.007). Additionally, we found a nonsignificant correlation trend to the significance between the path length and the GDS (r s = −0.380; P = 0.055), and between the global efficiency measure and the Semantic Fluency test (r s = −0.378; P = 0.063).
DISCUSSION
The purpose of this study was to provide further insight into the role of the different regions of the DMN in the cognitive outcome of patients with first ever ischemic stroke, as well as a better understanding of the underlying pathophysiology.
Previous works showed that localized brain lesions can cause connectivity‐based changes in regions that are structurally intact and far from the lesion site [Carter et al., 2010; Carter et al., 2012; Crofts et al., 2011; Dacosta‐Aguayo et al., 2014a,b; Golestani et al., 2013; Grefkes et al., 2008; He et al., 2007; Nomura et al., 2010; Ovadia‐Caro et al., 2013; Park et al., 2011; Tuladhar et al., 2013; Warren et al., 2009]. The relationship between alterations in functional connectivity after stroke and behavioral outcome/performance has been previously reported. For example, He et al. [2007] reported a breakdown of interhemispheric functional connectivity within the attention network in stroke patients with neglect symptoms. Symptom severity correlated with decreased connectivity, and recovery from symptoms correlated with the recovery of normal connectivity patterns. Similar results have been reported regarding the sensorimotor [Carter et al., 2010; Carter et al., 2012; Golestani et al., 2013; Grefkes et al., 2008; Ovadia‐Caro et al., 2013; Park et al., 2011; Wang et al., 2010] and language networks [Warren et al., 2009]. DMN disruption has been commonly observed by resting‐state functional studies in patients with mild cognitive impairment [Sorg et al., 2007; Wang et al., 2006] vascular cognitive impairment with subcortical lesions [Sun et al., 2011], patients with carotid stenosis [Cheng et al., 2012; Lin et al., 2014] Regarding the role of the DMN on cognitive performance in stroke patients, we know only of one recent study [Tuladhar et al., 2013] carried out. This study investigated the pathophysiology of memory dysfunction in first‐ever right and left stroke patients scanned 9–12 weeks after stroke onset. By means of group pICA, they found reduced DMN activity in stroke patients when compared with controls. We found, however, increased DMN activity in our stroke patients, which confirms our previous finding [Dacosta‐Aguayo et al., 2014a]. The increase of activity in the left anterior cingulate gyrus was related to line cancellation test (r = −0.747; P = 0.000). Relationship between resting‐state activity in the DMN and cognitive tasks, such as motor‐sequence learning [Kincses et al., 2008] and visual detection task [Singh and Fawcett, 2008] has been already demonstrated. Our recent finding is in agreement with attention model that postulate the involvement of the anterior cingulate cortex in the spatial attention [Thiel et al., 2004]. Contradictory results between our study and the study reported by Tuladhar et al., [2013] could be the result of some differences that should be taken into account. First, Tuladhar et al., [2013] selected right and left, supratentorial and infratentorial stroke patients (four brainstem stroke patients), which resulted in a more heterogeneous sample with a lot of confounding variance. For example, we cannot assume that the decreased connectivity between different regions of both hemispheres is due to widespread effects of the infarction to other remote regions because data contains affected hemispheres from both sides. Second, it is not clear how the site of the lesion, regarding supratentorial or infratentorial strokes, affects the behavioral/cognitive/neuronal recovery [Gialanella et al., 2008; Hoffmann and Schmitt, 2004; Nys et al., 2007]. Third, they did not report possible group differences in vascular risk factors (e.g., diabetes mellitus, hypertension, dislypidemia) that are more frequent in stroke patients and have been shown to confound resting‐state fluctuations: in the case of patients with diabetes mellitus, a reduction of functional connectivity has been reported [Demuru et al., 2014; van Duinkerken et al., 2012]. Taking this into account, it is difficult to exclude that the reduced functional connectivity found in stroke patients in the paper of Tuladhar et al., [2013] is not (partially) due to the presumably higher frequency of vascular risk factors. Fourth, the abovementioned heterogeneity in lesion location also confounds the interpretation of reduced connectivity found in the DMN by Tuladhar et al., [2013]: a compensatory effect in one hemisphere of a patient could be “masked” by the lesion effect in the same hemisphere of another patient.
By means of seed‐based‐connectivity analysis, we found that functional connectivity of the contralesional hemisphere was affected, which is in agreement with our previous studies [Dacosta‐Aguayo et al., 2014a, 2014b] conducted with stroke patients.
By means of GCA, we found that (1) impairment of the functional integration of the DMN was negatively associated with the size of the lesion in stroke patients, that is, as the size of the lesion is greater, the connectivity between the nodes is poorer; (2) there were more impaired nodes in the right and left (contralesional) frontal gyrus, the PCC, the RP cortex, and the lPH gyrus; (3) the disrupted mean path length between those nodes was associated to the cognitive performance in the Semantic Fluency Test, Phonetic Fluency Test, and MMSE. The size of the lesion has been, and still remains, a subject of discussion in the stroke literature along with the importance of the site of the lesion. These findings might contribute to clarify the reasons by which both size and localization are equally important in cognitive impairment after stroke: if the stroke lesion is big, the connectivity disruption between the different nodes of a network (or even nodes belonging to more than one network) will be greater enlarging the mean path length from one node to the other. Conversely, if the lesion is situated in a critical node, such as the PCC, or disrupts the connectivity of this node, the consequences of the lesion would be of significant relevance at short and long term. The impaired nodes were not only located in the lesioned hemisphere but also in the contralesional hemisphere. This finding reflects the general influence of localized lesions on distant functionally connected regions. Our findings are consistent with the concept of diaschisis after stroke, which was originally formulated to describe temporary clinical deficits related to areas remote from the area of damage [Achard et al., 2006] and has been expanded to include neurophysiological observations of depression of activity in remote, undamaged brain sites that are functionally connected to lesion areas [Carter et al., 2010; Crofts et al., 2011] However, the mean path length between the DMN nodes in stroke patients was positively associated with the MMSE as well as with the semantic and verbal fluency scores. Taking into account that lesions directly affect the mean path length, one would have expected that this association was negative; showing that mean path length disruption or elongation would explain poor cognitive performance in stroke patients. However, no such result was reported so far according to our knowledge. We can only speculate that those positive associations could perhaps reflect adaptive changes, that is, decreased connectivity can be interpreted not as a consequence of the damage but rather a compensation by means of isolating damaged areas.
The association with the MMSE, a screening test that have been always related to cortical neurodegenerative disease, such as Alzheimer Disease, is an important finding. Whereas vascular cognitive impairment and Vascular Dementia have been always related to a pattern of executive, motor, processing speed, and attentional disabilities; Alzheimer Disease has been related mainly to episodic memory and visuospatial (parietal) related skills. Our finding is not only in agreement with other recent study [Tuladhar et al., 2013] regarding the involvement of the DMN in episodic memory but also is based on the fact that our patients showed impairment in the lPH gyrus.
The negative trend to significance correlation between the mean path length and the GDS (r s = −0.38; P = 0.055) would be in agreement with other studies over patients diagnosed with major depressive disorder. Those patients presented a number of abnormal psychological and psychiatric symptoms characterized by multiple self‐abnormalities [Grimm et al., 2009; Northoff, 2007; Sumner et al., 2010]. The DMN has recently been shown to be important in self‐referential activities [Fox et al., 2005; Fransson 2005]. According to previous studies, there are striking differences between the DMNs of patients with major depressive disorder and healthy control participants [Johnson et al., 2009; Sheline et al., 2009; Zhu et al., 2012].
Finally, the association between the DMN connectivity and the semantic retrieval (semantic fluency test) is in agreement with a study of Greicius et al. [2003], who suggested that the retrieval and manipulation of episodic and semantic knowledge were likely elucidated by the DMN.
Our ischemic stroke patients showed more alteration in a measure of functional integration in the brain networks: the mean path length, computed as the global average of the graph's distance matrix [Watts and Strogatz, 1998]. Cognitive functions depend on the integrated operation of large‐scale distributed brain networks. The interaction between brain regions within a network and the interactions between networks are both important for efficient cognitive function. Numerous hubs (important nodes highly connected to the network that play global integrative processes, or play a critical compensatory role when the network is damaged) are mainly located in heteromodal association cortices which largely overlap the DMN [van den Heuvel and Sporns, 2011]. Disturbances of the functional connectivity of those hubs are linked to neuropathology. Diseases that affect the rich‐hub core of the brain may have more global effects on brain communication and thereby affect multiple cognitive domains. Whether these deficits can lead to increased susceptibility to develop vascular cognitive impairment and ensuing vascular dementia remains unclear. Applying graph theory to individual nodes of a network provides a potential explanation for disruptions of small‐worldness organization of this network. A network perspective is fundamental to appreciate the pathophysiology of brain injury at the systems level, and the underlying mechanisms of recovery, as well as to develop novel strategies of rehabilitation.
CONCLUSIONS
The ability to regulate activity of the DMN appears to be a central part of normal brain function in stroke patients.
ACKNOWLEDGMENTS
We would like to thank all participants for their participation in this study, members at the stroke unit of the Germans Trias i Pujol and members of the Institut Universitari d'Investigació en Atenció Primària‐IDIAP Jordi Gol for their valuable discussion of the paper. We also wish to thank nurses, neuroradiologists and technicians from the Germans Trias i Pujol University Hospital and from the Clinic Hospital for their helpful collaboration.
REFERENCES
- Achard S, Salvador R, Whitcher B, Suckling J, Bullmore E (2006): Resilient, low‐frequency, small‐world human brain functional network with highly connected association cortical hubs. J Neurosci 23:63–72. [DOI] [PMC free article] [PubMed] [Google Scholar]
- Aharon‐Peretz J, Daskowski E, Mashiach T, Tomer R (2002): Natural history of dementia associated with lacunar infarctions. J Neurol Sci 203–204:53–5. [DOI] [PubMed] [Google Scholar]
- Beckmann CF, Smith SM (2004): Probabilistic independent component analysis for functional magnetic resonance imaging. IEEE Trans Med Imaging 23:137–152. [DOI] [PubMed] [Google Scholar]
- Biswal BB, Mennes M, Zuo XN, Gohel S, Kelly C, Smith SM, Beckmann CF, Adelstein JS, Buckner RL, Colcombe S, Dogonowski AM, Ernst M, Fair D, Hampson M, Hoptman MJ, Hyde JS, Kiviniemi VJ, Kötter R, Li SJ, Lin CP, Lowe MJ, Mackay C, Madden DJ, Madsen KH, Margulies DS, Mayberg HS, McMahon K, Monk CS, Mostofsky SH, Nagel BJ, Pekar JJ, Peltier SJ, Petersen SE, Riedl V, Rombouts SA, Rypma B, Schlaggar BL, Schmidt S, Seidler RD, Siegle GJ, Sorg C, Teng GJ, Veijola J, Villringer A, Walter M, Wang L, Weng XC, Whitfield‐Gabrieli S, Williamson P, Windischberger C, Zang YF, Zhang HY, Castellanos FX, Milham MP (2010): Toward discovery science of human brain function. Proc Natl Acad Sci USA 107:4734–4739. [DOI] [PMC free article] [PubMed] [Google Scholar]
- Brott T, Marler JR, Olinger CP, Adams HP Jr, Tomsick T, Barsan WG, Biller J, Eberle R, Hertzberg V, Walker M (1989): Measurements of acute cerebral infarction: Lesion size by computed tomography. Stroke 20:871–875. [DOI] [PubMed] [Google Scholar]
- Buckner R, Andrews‐Hanna J, Schacter L (2008): The brain's default network. Anatomy, function, and relevance to disease. Ann NY Acad. Sci 1124:1–38. [DOI] [PubMed] [Google Scholar]
- Buckner RL, Sepulcre J, Talukdar T, Krienen FM, Liu H, Hedden T, Andrews‐Hanna JR, Sperling RA, Johnson KA (2009): Cortical hubs revealed by intrinsic functional connectivity: mapping, assessment of stability, and relation to Alzheimer's disease. J Neurosci 29:1860–1873. [DOI] [PMC free article] [PubMed] [Google Scholar]
- Bullmore ED, Sporns O (2007): Complex brain networks: graph theoretical analysis of structural and functional systems. Nat Rev 10:186–198. [DOI] [PubMed] [Google Scholar]
- Carter AR, Astafiev SV, Lang CE, Connor LT, Rengachary J, Strube MJ, Pope DL, Shulman GL, Corbetta M (2010): Resting interhemispheric functional magnetic resonance imaging connectivity predicts performance after stroke. Ann Neurol 67:365–375. [DOI] [PMC free article] [PubMed] [Google Scholar]
- Carter AR, Patel KR, Astafiev SV, Snyder AZ, Rengachary J, Strube MJ, Pope A, Shimony JS, Lang CE, Shulman GL, Corbetta M (2012): Upstream dysfunction of somatomotor functional connectivity after corticospinal damage in stroke. Neurorehabil Neural Repair 26:7–19. [DOI] [PMC free article] [PubMed] [Google Scholar]
- Cheng HL, Lin CJ, Soong BW, Wang PN, Chang FC, Wu YT (2012): Impairments in cognitive function and brain connectivity in severe asymptomatic carotid stenosis. Stroke 43:2567–2573. [DOI] [PubMed] [Google Scholar]
- Crawford JR, Garthwaite PH (2004): Statistical methods for single‐case research: Comparing the slope of a patient's regression line with those of a control sample. Cortex 40:533–548. [DOI] [PubMed] [Google Scholar]
- Crawford JR, Garthwaite PH, Gray CD (2003a): Wanted: Fully operational definitions of dissociations in single‐case studies. Cortex 39:357–370. [DOI] [PubMed] [Google Scholar]
- Crawford JR, Garthwaite PH, Howell DC, Venneri A (2003b): Intra‐individual measure of association in neuropsychology: Inferential methods for comparing a single case with a control or normative sample. J Int Neuropsychol Soc 9:989–1000. [DOI] [PubMed] [Google Scholar]
- Crofts JJ, Higham DJ, Bosnell R, Jbabdi S, Matthews PM, Behrens TE, Johansen‐Berg H (2011): Network analysis detects changes in the contralesional hemisphere following stroke. Neuroimage 54:161–169. [DOI] [PMC free article] [PubMed] [Google Scholar]
- Dacosta‐Aguayo R, Graña M, Fernández‐Andújar M, López‐Cancio E, Cáceres C, Bargalló N, Barrios M, Clemente I, Montserrat PT, Sas MA, Dávalos A, Auer T, Mataró M (2014a): Structural integrity of the contralesional hemisphere predicts cognitive impairment in ischemic stroke at three months. PloS One 9:e86119. [DOI] [PMC free article] [PubMed] [Google Scholar]
- Dacosta‐Aguayo R, Graña M, Savio A, Fernández‐Andújar M, Millán M, López‐Cancio E, Cáceres C, Bargalló N, Garrido C, Barrios M, Clemente IC, Hernández M, Munuera J, Dávalos A, Auer T, Mataró M (2014b): Prognostic value of changes in resting‐state functional connectivity patterns in cognitive recovery after stroke: A 3T fMRI pilot study. Hum Brain Mapp 35:3819–3831. [DOI] [PMC free article] [PubMed] [Google Scholar]
- Dasellar SM, Prince SE and Cabeza R (2004): When less means more: deactivations during encoding that predict subsequent memory. Neuroimage 23:921–927. [DOI] [PubMed] [Google Scholar]
- del Ser T, Barba R, Morin MM, Domingo J, Cermillan C, Pondal M (2005): Evolution of cognitive impairment after stroke and risk factors for delayed progression. Stroke 36:2670–2675. [DOI] [PubMed] [Google Scholar]
- Demuru M, van Duinkerken E, Fraschini M, Marrosu F, Snoek FJ, Barkhof F, Klein M, Diamant M, Hillebrand A (2014): Changes in MEG resting‐state networks are related to cognitive decline in type 1 diabetes mellitus patients. Neuroimage Clin 5:69–76. [DOI] [PMC free article] [PubMed] [Google Scholar]
- Desmond DW, Moroney JT, Sano M, Stern Y (1996): Recovery of cognitive function after stroke. Stroke 27:1798–1803. [DOI] [PubMed] [Google Scholar]
- Desmond DW, Moroney JT, Sano M, Stern Y (2002): Incidence of dementia after ischemic stroke: results of a longitudinal study. Stroke 33:2254–2260. [DOI] [PubMed] [Google Scholar]
- Dubois MD, Slachevsky A, Litvan I, Pillon B (2000): The FAB. A frontal assessment battery at bedside. Neurology 11:1621–1626. [DOI] [PubMed] [Google Scholar]
- Filippini N, MacIntosh BJ, Hough MG, Goodwin GM, Frisoni GB, Smith SM, Matthews PM, Beckmann CF, Mackay CE (2009): Distinct patterns of brain activity in young carriers of the APOE‐epsilon4 allele. Proc Natl Acad Sci USA 106:7209–7214. [DOI] [PMC free article] [PubMed] [Google Scholar]
- Folstein MF, Robins LN, Helzer JE (1983): The Mini‐Mental State Examination. Arch Gen Psychiatry 40:812. [DOI] [PubMed] [Google Scholar]
- Fox MD, Snydera Z, Vincent JL, Corbetta M, Van Essen DC, Raichle ME (2005): The human brain is intrinsically organized into dynamic, anticorrelated functional networks. Proc Natl Acad Sci USA 102:9673–9678. [DOI] [PMC free article] [PubMed] [Google Scholar]
- Fransson P (2005): Spontaneous low‐frequency BOLD signal fluctuations: An fMRI investigation of the resting‐state default mode of brain function hypothesis. Hum Brain Mapp 26:15–29. [DOI] [PMC free article] [PubMed] [Google Scholar]
- Friston KJ (2000): The labile brain. I. Linear transients and nonlinear coupling. Philos Trans R Soc London B 355:215–236. [DOI] [PMC free article] [PubMed] [Google Scholar]
- Gialanella B, Bertolinelli M, Santoro R (2008): Rehabilitative outcome in supratentorial and infratentorial stroke: the role of motor deficits. Aging Clin Exp Res 20:310–315. [DOI] [PubMed] [Google Scholar]
- Golestani AM, Tymchuk S, Demchuk A, Goodyear BG (2013): Longitudinal evaluation of resting‐state FMRI after acute stroke with hemiparesis. Neurorehabil Neural Repair 27:153–163. [DOI] [PubMed] [Google Scholar]
- Grefkes C, Nowak DA, Eickhoff SB, Dafotakis M, Küst J, Karbe H, Fink GR (2008): Cortical connectivity after subcortical stroke assessed with functional magnetic resonance imaging. Ann Neurol 63:236–246. [DOI] [PubMed] [Google Scholar]
- Greicius MD, Krasnow B, Reiss AL, Menon V (2003): Functional connectivity in the resting brain: A network analysis of the default mode hypothesis. Proc Natl Acad Sci USA 100:253–258. [DOI] [PMC free article] [PubMed] [Google Scholar]
- Grimm S, Ernst J, Boesiger P, Schuepbach D, Hell D, Boeker H, Northowff G (2009): Increased self‐focus in major depressive disorder is related to neural abnormalities in the subcortical‐cortical midline structures. Hum Brain Mapp 30:2617–2627. [DOI] [PMC free article] [PubMed] [Google Scholar]
- Gusnard A, Raichle M (2001): Searching for a baseline: Functional imaging and the resting human brain. Nat Rev 2:685–694. [DOI] [PubMed] [Google Scholar]
- He BJ, Snyder AZ, Vincent JL, Epstein A, Shulman GL, Corbetta M (2007): Breakdown of functional connectivity in frontoparietal networks underlies behavioral deficits in spatial neglect. Neuron 53:905–918. [DOI] [PubMed] [Google Scholar]
- Hoffmann M, Schmitt F (2004): Cognitive impairment in isolated subtentorial stroke. Acta Neurol Scand 109:14–24. [DOI] [PubMed] [Google Scholar]
- Johnson MK, Nolen‐Hoeksema S, Levin Y (2009): Medial cortex activity, self‐reflection and depression. Soc Cogn Affect Neurosci 4:313–327. [DOI] [PMC free article] [PubMed] [Google Scholar]
- Kaiser M, Martin R, Andras P, Young MP (2007): Simulation of robustness against lesions of cortical networks. Eur J Neurosci 25:3185–3192. [DOI] [PubMed] [Google Scholar]
- Kaplan E, Goodglass H, Weintraub S (1983): Boston Naming Test. Philadelphia: Lea and Febiger. [Google Scholar]
- Kertesz A, Davidson W, Fox H (1997): Frontal behavioral inventory: diagnostic criteria for frontal lobe dementia. Can J Neurol Sci 24:29–36. [DOI] [PubMed] [Google Scholar]
- Kincses ZT, Johansen‐Berg H, Tomassini V, Bosnell R, Matthews PM, Beckmann CF (2008): Model‐free characterization of brain functional networks for motor sequence learning using fMRI. Neuroimage 39:1950–1958. [DOI] [PubMed] [Google Scholar]
- Latora V, Marchiori M (2001): Efficient behavior of small‐world networks. Phys Rev Lett 87:1988701. [DOI] [PubMed] [Google Scholar]
- Lin CJ, Tu PC, Chern CM, Hsiao FJ, Chang FC, Chen HL, Tang CW, Lee YC, Chen WT, Lee IH (2014): Connectivity features for identifying cognitive impairment in presymptomatic carotid stenosis. PloS One 9:e85441. [DOI] [PMC free article] [PubMed] [Google Scholar]
- Long XY, Zuo XN, Kiviniemic V, Yang Y, Zou QH, Zhu CZ, Jiang TZ, Yang H, Gong QY, Wang L, Li KC, Xie S, Zang YF (2008): Default mode network as revealed with multiple methods for resting‐state functional MRI analysis. J Neurosci Methods 171:349–355. [DOI] [PubMed] [Google Scholar]
- López‐Cancio E, Dorado L, Millán M, Reverté S, Suñol A, Massuet A, Mataró M, Galán A, Alzamora M, Pera G, Torán P, Dávalos A, Arenillas JF (2011): The population‐based Barcelona‐Asymptomatic Intracranial Atherosclerosis Study (ASIA): rationale and design. BMC Neurol 11:22. [DOI] [PMC free article] [PubMed] [Google Scholar]
- Miller SL, Celone K, DePeau K, Diamond E, Dickerson BC, Rentz D, Pihlajamäki M, Sperling RA (2008): Age‐related memory impairment associated with loss of parietal deactivation but preserved hippocampal activation. Proc Natl Acad Sci USA 105:2181–2186. [DOI] [PMC free article] [PubMed] [Google Scholar]
- Minka T (2000): Automatic choice of dimensionality for PCA. Technical Report, 514, MIT Media Lab Vision and Modeling Group.
- Miralbell J, Soriano JJ, Spulberb G, López‐Cancio E, Arenillas F, Bargalló N, Galán A, Barrios MT, Cáceres C, Alzamora MT, Pera G, Kivipelto M, Wahlund LO, Dávalos A, Mataró M (2012): Structural brain changes and cognition in relation to markers of vascular dysfunction. Neurobiology of Aging 5:1003.e9–1003.e17. [DOI] [PubMed] [Google Scholar]
- Morales‐González JM, González‐Montalvo JI, Del Ser Quijano T, Bermejo‐Pareja F (1992): Validation of the S‐IQCODE : the Spanish version of the informant questionnaire on cognitive decline in the elderly. Arch Neurobiology 55:262–266. [PubMed] [Google Scholar]
- Nasreddine ZS, Phillips NA, Bédirian V, Charbonneau S, Whitehead V, Collin I, Cummings JL, Chertkow H (2005): The Montreal Cognitive Assessment, MoCA: A brief screening tool for mild cognitive impairment. Jam Geriatr Soc 53 695–699. [DOI] [PubMed] [Google Scholar]
- Nomura EM, Gratton C, Visser RM, Kayser A, Perez F, D'Esposito M (2010): Double dissociation of two cognitive control networks in patients with focal bain lesions. Proc Natl Acad Sci USA 107:12017–12022. [DOI] [PMC free article] [PubMed] [Google Scholar]
- Northoff G (2007): Psychopathology and pathophysiology of the self in depression‐neuropsychiatric hypothesis. J Affect Disord 104:1–14. [DOI] [PubMed] [Google Scholar]
- Nyenhuis DL, Gorelick PB, Freels S, Garron DC (2002): Cognitive and functional decline in African Americans with VaD, AD, and stroke without dementia. Neurology 58:56–61. [DOI] [PubMed] [Google Scholar]
- Nys GMS, van Zandvoort MJE, de Kort PLM, Jansen BPW, de Haan EHF, Kappelle LJ (2007): Cognitive disorders in acute stroke: prevalence and clinical determinants. Cerebrovasc Dis 23: 408–416. [DOI] [PubMed] [Google Scholar]
- Onnela JP, Saramaki J, Kertesz J, Kaski K (2005): Intensity and coherence of motifs in weighted complex networks. Phys Rev E Stat Nonlin Soft Matter Phys 71:065–103. [DOI] [PubMed] [Google Scholar]
- Ovadia‐Caro S, Willringer K, Fiebach J, Jungehulsing G, van der Meer E, Margulies D, Villringer A (2013): Longitudinal effects of lesions on functional networks after stroke. J Cereb Blood Flow Metabolism 33:1279–1285. [DOI] [PMC free article] [PubMed] [Google Scholar]
- Park CH, Chang WH, Ohn SH, Kim ST, Bang OY, Pascual‐Leone A, Kim YH (2011): Longitudinal changes of resting‐state functional connectivity during motor recovery after stroke. Stroke 42:1357–1362. [DOI] [PMC free article] [PubMed] [Google Scholar]
- Raichle ME, MacLeod AM, Snyder AZ, Powers WJ, Gusnard DA, Shulman GL (2001): A default mode of brain function. Proc Natl Acad Sci USA 98:676–682. [DOI] [PMC free article] [PubMed] [Google Scholar]
- Rubinov M, Sporns O (2010): Complex network measures of brain connectivity: uses and interpretations. NeuroImage 52:1059–1069. [DOI] [PubMed] [Google Scholar]
- Ruff RM, Parker SB (1993): Gender and age‐specific changes in motor speed and eye‐hand coordination in adults: Normative values for the finer tapping and grooved pegboard tests. Percept Mot Skills 76:1219–1230. [DOI] [PubMed] [Google Scholar]
- Sachdev PS, Brodaty H, Valenzuela MJ, Lorentz L, Looi JC, Wen W, Zagami AS (2004): The neuropsychological profile of vascular cognitive impairment in stroke and TIA patients. Neurology 62:912–919. [DOI] [PubMed] [Google Scholar]
- Sachdev PS, Brodaty H, Valenzuela MJ, Lorentz L, Looi JC, Berman K, Ross A, Wen W, Zagami AS (2006): Clinical determinants of dementia and mild cognitive impairment following ischemic stroke: the Sydney Stroke Study. Dement Geriatr Cogn Disord 21:275–283. [DOI] [PubMed] [Google Scholar]
- Sachdev PS, Lipnicki DM, Crawford JD, Wen W, Brodaty H (2014): Progression of cognitive impairment in stroke/TIA patients over 3 years. J Neurol Neurosurg Psychiatry. 2014 Mar 21. doi: 10.1136/jnnp-2013-306776. [Epub ahead of print]. [DOI] [PubMed] [Google Scholar]
- Sharp DJ, Beckmann CF, Greenwood R, Kinnunen KM, Bonnelle V, De Boissezon X, Powell JH, Counsell SJ, Patel MC, Leech R (2011): Default mode network functional and structural connectivity after traumatic brain injury. Brain 134:2233–2247. [DOI] [PubMed] [Google Scholar]
- Sheline YI, Barch DM, Price JL, Rundle MM, Vaishnavi WN, Snyder AZ, Mintun MA, Wang S, Coalson RS, Raichle ME (2009): The default mode network and self‐referential processes in depression. Proc Natl Acad Sci USA 106:1942–1947. [DOI] [PMC free article] [PubMed] [Google Scholar]
- Shulman GL, Fiez JA, Corbetta M, Buckner RL, Miezin FM, Raichle ME, Petersen SE (1997): Common blood flow changes across visual tasks: II. Decreases in cerebral cortex. J Cogn Neurosci 9:648–663. [DOI] [PubMed] [Google Scholar]
- Sims JR, Rezai Gharai L, Schaefer PW, Vangel M, Rosenthal ES, Lev MH, Schwamm LL (2009): ABC/2 for rapid clinical estimate of infarct, perfusion, and mismatch volumes. Neurology 72:2104–2110. [DOI] [PMC free article] [PubMed] [Google Scholar]
- Singh KD, Fawcett IP (2008): Transient and linearly graded deactivation of the human default‐mode network by a visual detection task, NeuroImage 41:100–112. [DOI] [PubMed] [Google Scholar]
- Smith SM, Fox PT, Miller KL, Miller KL, Glahn DC, Fox PM, Mackay CE, Filippini N, Watkins KE, Toro R, Laird AR, Beckmann CF (2009): Correspondence of the brain's functional architecture during activation and rest. Proc Natl Acad Sci USA 106:13040–13045. [DOI] [PMC free article] [PubMed] [Google Scholar]
- Sorg C, Riedl V, Muhlau M, Calhoun VD, Eichele T, Läer L, Drzezga A, Förstl H, Kurz A, Zimmer C, Wohlschläger AM (2007): Selective changes of resting‐state networks in individuals at risk for Alzheimer's disease. Proc Natl Acad Sci USA 104:18760–18765. [DOI] [PMC free article] [PubMed] [Google Scholar]
- Srikanth VK, Anderson JF, Donnan GA, Saling MM, Didus E, Alpitsis R, Dewey HM, Macdonell RA, Thrift AG (2004): Progressive dementia after first‐ever stroke: a community‐based follow‐up study. Neurology 63:785–792. Available at: http://www.ncbi.nlm.nih.gov/pubmed/15365124. [DOI] [PubMed] [Google Scholar]
- Strauss E, Sherman EMS, Spreen O (2006): A Compendium of Neuropsychological Tests, 3rd ed New York: Oxford University Press. [Google Scholar]
- Strub R, Black W (2000): The Mental Status Examination in Neurology. Philadelphia: F.A. Davis. [Google Scholar]
- Sun YW, Qin LD, Zhou Y, Xu Q, Qian LJ, Tao J, Xu JR (2011): Abnormal functional connectivity in patients with vascular cognitive impairment, no dementia: a resting‐state functional magnetic resonance imaging study. Behav Brain Res 223:388–394. [DOI] [PubMed] [Google Scholar]
- Sumner JA, Griffth JW, Mineka S (2010): Overgeneral autobiographical memory as a predictor of the course of depression; a meta‐analysis. Bevah Res Ther 48:614–625. [DOI] [PMC free article] [PubMed] [Google Scholar]
- Thiel CM, Zilles K, Fink GR (2004): Cerebral correlates of alerting, orienting and reorienting of visuospatial attention: an event‐related fMRI study. NeuroImage 21:318–328. [DOI] [PubMed] [Google Scholar]
- Tuladhar AM, Snaphaan L, Shumskaya E, Rijpkema M, Fernández G, Norris D, de Leeuw FE (2013): Default Mode Network Connectivity in Stroke Patients. PloS One 8:e66556. [DOI] [PMC free article] [PubMed] [Google Scholar]
- van den Heuvel MP, Hulshoff Pol HE (2010): Exploring the brain network: a review on resting‐state fMRI functional connectivity. Eur Neuropsychopharmacol 20:519–534. [DOI] [PubMed] [Google Scholar]
- van den Heuvel MP, Sporns O (2011): Rich‐Club Organization of the Human Connectome. J Neurosci 31:15775–15786. [DOI] [PMC free article] [PubMed] [Google Scholar]
- van Duinkerken E, Schoonheim MM, Sanz‐Arigita EJ, IJzerman RG, Moll AC, Snoek FJ, Ryan CM, Klein M, Diamant M, Barkhof F (2012): Resting‐state brain networks in type 1 diabetic patients with and without microangiopathy and their relation to cognitive functions and disease variables. Diabetes 61:1814–1821. [DOI] [PMC free article] [PubMed] [Google Scholar]
- van Meer M, van der Marel K, Wang K, Otte W, el Bouazati S, Roeling T, Viergever MA, van der Sprenkel J, Dijkhuizen R (2010): Recovery of Sensorimotor Function after Experimental Stroke Correlates with Restoration of Resting‐State Interhemispheric Functional Connectivity. J Neurosci 30:3964–3972. [DOI] [PMC free article] [PubMed] [Google Scholar]
- van Meer MP, Otte WM, van der Marel K, Nijboer CH, Kavelaars A, van der Sprenkel JW, Viergever MA, Dijkhuizen RM (2012): Extent of bilateral neuronal network reorganization and functional recovery in relation to stroke severity. J Neurosci 32:4495–4587. [DOI] [PMC free article] [PubMed] [Google Scholar]
- Wang L, Yu C, Chen H, Qin W, He Y, Fan F, Zhang Y, Wang M, Li K, Zang Y, Woodward TS, Zhu C (2010): Dynamic functional reorganization of the motor execution network after stroke. Brain 133:1224–1238. [DOI] [PubMed] [Google Scholar]
- Wang L, Zang Y, He Y, Liang M, Zhang X, Tian L, Wu T, Jiang T, Li K (2006): Changes in hippocampal connectivity in the early stages of Alzheimer's disease: evidence from resting state fMRI. NeuroImage 31:496–504. [DOI] [PubMed] [Google Scholar]
- Warren JE, Crinion JT, Lambon Ralph MA, Wise RJ (2009): Anterior temporal lobe connectivity correlates with functional outcome after aphasic stroke. Brain 132:3428–3442. [DOI] [PMC free article] [PubMed] [Google Scholar]
- Watanabe T, Hirose S, Wada H, Imai Y, Machida T, Shirouzu I, Seiki K, Miyashita Y, Masuda N (2013): A pairwise maximum entropy model accurately describes resting‐state human brain networks. Nat Commun 4:1370. [DOI] [PMC free article] [PubMed] [Google Scholar]
- Watts DJ, Strogatz SH (1998): Collective dynamics of “small‐world” networks. Nature 393:440–442. [DOI] [PubMed] [Google Scholar]
- Wechsler D (1999): Wechsler Adult Intelligence Scale‐III (WAIS‐III‐R). Madrid: TEA Ediciones. [Google Scholar]
- Yesavage JA, Brink TL, Rose TL, Lum O, Huang V, Adey M, Leirer VO (1982): Development and validation of a geriatric depression screening scale: a preliminary report. J Psychiatr Res 17:37–49. [DOI] [PubMed] [Google Scholar]
- Zalesky A, Fornito A, Bullmore ET (2010): Network‐based statistic: identifying differences in brain networks. NeuroImage 53:1197–1207. [DOI] [PubMed] [Google Scholar]
- Zhu X, Wang X, Xiao J, Liao J, Zhong M, Wang W, Yao S (2012): Evidence of a dissociation pattern in resting‐state default mode network connectivity in first‐episode, treatment‐naïve major depression patients. Biol Psychiatry 71:611–617. [DOI] [PubMed] [Google Scholar]