

Abstract
Hypothalamic fatty acid (FA) sensing neurons alter their activity utilizing the FA translocator/receptor, FAT/CD36. Depletion of ventromedial hypothalamus (VMH) CD36 with adeno-associated viral vector expressing CD36 shRNA (AAV CD36 shRNA) leads to redistribution of adipose stores and insulin resistance in outbred rats. This study assessed the requirement of VMH CD36-mediated FA sensing for the regulation of energy and glucose homeostasis in postnatal day 5 (P5) and P21 selectively bred diet-induced obese (DIO) and diet-resistant (DR) rats using VMH AAV CD36 shRNA injections. P5 CD36 depletion altered VMH neuronal FA sensing predominantly in DIO rats. After 10 wk on a 45% fat diet, DIO rats injected with VMH AAV CD36 shRNA at P21 ate more and gained more weight than DIO AAV controls, while DR AAV CD36 shRNA-injected rats gained less weight than DR AAV controls. VMH CD36 depletion increased inguinal fat pad weights and leptin levels in DIO and DR rats. Although DR AAV CD36 shRNA-injected rats became as obese as DIO AAV controls, only DIO control and CD36 depleted rats became insulin-resistant on a 45% fat diet. VMH CD36 depletion stunted linear growth in DIO and DR rats. DIO rats injected with AAV CD36 shRNA at P5 had increased fat mass, mostly due to a 45% increase in subcutaneous fat. They were also insulin-resistant with an associated 71% increase of liver triglycerides. These results demonstrate that VMH CD36-mediated FA sensing is a critical factor in the regulation of energy and glucose homeostasis and fat deposition in DIO and DR rats.
Keywords: CD36, fatty acid, hypothalamus, neuronal sensing, obesity
obesity and type 2 diabetes mellitus are major worldwide public health issues (1, 3, 6, 14, 19, 23, 60, 61). Obesity has genetic underpinnings, and its incidence is increasing in children (17, 18, 53, 55). Both obesity and Type 2 diabetes have major comorbidities that make it imperative to understand the underlying mechanisms that regulate energy and glucose homeostasis. We have used selectively bred diet-induced obese (DIO) rats as a model of human obesity (33, 34, 39) to assess the underlying factors that regulate their responses to high-fat diet intake. These rats are selectively bred to produce polygenically inherited diet-induced obesity or to remain diet-resistant (DR) when fed a 31% fat diet. DIO rats are larger, but not fatter, than DR rats when fed a low-fat diet, but rapidly become hyperphagic, obese, and insulin-resistant when fed 31% fat diet (34, 37).
Many studies support the idea that specialized hypothalamic metabolic sensing neurons can monitor peripheral fuel availability by altering their activity in response to ambient brain levels of glucose and fatty acid (FA) as a means of regulating body energy and glucose homeostasis (10, 20, 26, 28, 31, 44, 46, 50). Glucose-excited (GE) neurons increase and glucose-inhibited (GI) neurons decrease their activity as glucose levels rise (2, 11, 20, 22, 47, 54). Metabolic sensing neurons also possess specialized pathways that allow them to utilize FA as a signaling molecule to regulate their activity (27–30, 44, 48, 59). Using pharmacological methods, we previously demonstrated that CD36 accounted for at least 50% of the excitatory and inhibitory effects of the long-chain FA (LCFA), oleic acid (OA) in ventromedial hypothalamic nucleus (VMN) neurons, whereas inhibiting any of the steps of neuronal LCFA oxidation accounted for no more than 20% of these effects of OA (28). We also demonstrated that depleting ventromedial hypothalamus [VMH; arcuate nucleus (ARC) + VMN] CD36 with an adeno-associated virus expressing CD36 shRNA (AAV CD36 shRNA) in outbred Sprague-Dawley rats fed a 45% fat diet had no effect on overall food intake, body weight gain, or total carcass adiposity. However, this depletion led to selective fat deposition in subcutaneous depots and markedly abnormal glucose tolerance (27). These results demonstrated that CD36 is a critical factor in both VMH neuronal FA sensing and the regulation of energy and glucose homeostasis in outbred Sprague-Dawley rats (27, 28).
We previously showed that the DIO rat has abnormal VMN neuronal FA sensing (29). The goal of this study was to assess the effects on energy and glucose homeostasis of altering VMH FA sensing by depleting CD36 in DIO and DR rats. We postulated that, since DIO rats have abnormal neuronal VMH FA sensing and become hyperphagic, obese, and insulin-resistant when fed a high-fat diet (34, 37), impairing VMH FA sensing by depleting CD36 with AAV CD36 shRNA would similarly cause DR rats to develop abnormal VMH neuronal FA sensing and become obese and insulin-resistant when fed a high-fat diet. Additionally, we postulated that further impairing DIO VMH FA sensing by depleting their CD36 would cause them to become even more obese and insulin-resistant than controls when fed a high-fat diet.
METHODS
Animals
Animals were housed at 23–24°C on a 12:12-h light-dark cycle (lights on at 1000). Male rats selectively bred to express the DR or DIO phenotypes (34) were raised in our in-house colony and used for all studies. Litters were culled to 10 pups per dam on postnatal day 2 (P2) and weaned at P21 onto Purina rat chow or a 45% fat diet and water ad libitum, unless otherwise noted. Purina rat chow (no. 5001) contains 13.5% fat, 28.5% protein, and 58% carbohydrate; the 45% fat diet (no. D12451, Research Diets, New Brunswick, NJ) contains 45% fat, 20% protein, and 35% carbohydrate as a percentage of total energy content. The FA composition of the 45% fat diet is 31.4% saturated (37% of palmitic), 35.5% monounsaturated (64% of oleic), and 33.1% polyunsaturated (56% of linoleic) as a percentage of total fat energy content (Research Diets).
During the course of all experiments, cumulative food intake and body weight measurements were obtained weekly. All work was in compliance with the Institutional Animal Care and Use Committee of the East Orange Veterans Affairs Medical Center.
Adeno-Associated Viral Vectors
Murine CD36 open reading frame was PCR-amplified from brain cDNA library with a COOH terminal FLAG tag and subcloned into an adeno-associated virus (AAV) expression plasmid to generate AAV.CD36. A control vector (AAV.mCherry) was designed to express mCherry-FLAG. The expression of both transgenes is regulated by a hybrid cytomegalovirus/chicken β-actin promoter. Virus stocks were prepared by packaging the vector plasmids into AAV serotype 2 particles using a helper-free plasmid transfection system. The vectors were purified using heparin affinity chromatography, dialyzed against PBS, supplemented with 2 mmol/l MgCl2, and diluted to 1012 genomic particles per milliliter (27).
Stereotaxic Surgery
Separate groups of P5 and P21 DR and DIO rats were stereotaxically injected bilaterally with 0.4 μl of saline containing 2 × 10⁸ genomic particles of AAV per side. Viruses contained a gene encoding the fluorescent marker mCherry gene, and either an shRNA designed to silence CD36, or a control sequence, which did not silence any known gene. Injections were made into the VMH over 10 min per side (n = 9 or 10/group). P5 pups were anesthetized by lowering their body temperature in ice to 7°C (neck temperature). They were placed into a stereotaxic instrument with a neonatal rat adaptor (Stoelting, Wood Dale, IL), in which the base plate was cooled using a 30% ethanol/dry ice bath to maintain a temperature of 10°C. P21 rats were anesthetized with chloropent (chloral hydrate + Nembutal) and placed in an adult stereotaxic frame (Kopf Instrument, Tujunga, CA). Tilt was adjusted so that bregma and lambda were leveled. Infusions were delivered to the coordinates for P5: 2.6 mm caudal to bregma, 0.40 mm lateral to midline, 6.6 mm down from dural surface; and for P21: 2.7 mm caudal to bregma, 0.6 mm lateral to midline, 8.4 mm below dura (VMN), 8.9 mm below dura (ARC), and 0.3 mm lateral to midline, as previously described (27).
In Vivo Effects of P21 DR and DIO VMH CD36 Depletion
Rats injected at P21 were fed a 45% fat diet for 10 wk. During weeks 9 and 10, rats were assessed for their glucose responses to systemic 2-deoxyglucose, refeeding after a 24-h fast and an oral glucose tolerance test (OGTT). Terminally, rats were decapitated, and the brains were harvested for micropunch of specific brain areas followed by real-time quantitative PCR (QPCR). Trunk blood was collected for glucose, insulin, leptin, free FA, and β-hydroxybutyrate. Retroperitoneal, perirenal, mesenteric, and epididymal fat pads were weighed as representative of visceral fat, and inguinal pads were taken as representative of subcutaneous fat.
Measurement of OA and Glucose-Induced Changes in Intracellular Ca2+ ([Ca2+]i) Oscillations in Dissociated VMN Neurons
Rats were injected in the VMH at P5 with AAV expressing CD36 shRNA. At P21–P28, they were perfused with an ice-cold oxygenated (95% O2-5% CO2) perfusion buffer (in mmol/l: 2.5 KCl, 1.25 NaH2PO4, 28.0 NaHCO3, 7.0 MgCl2, 0.5 CaCl2, 7.0 glucose, 1.0 ascorbate, 3.0 pyruvate, and 233 sucrose), the VMN was bilaterally punched from VMH slices, and neurons were dissociated, as previously described (22, 27, 28). Evaluation of glucose- and OA-induced alterations in [Ca2+]i oscillations in individual VMN neurons, which expressed mCherry (see Adeno-Associated Viral Vectors) were assessed using fura-2 acetoxy-methyl ester (Life Technologies, Grand Island, NY), as previously described (22, 27, 28). Neurons were classified as GE, GI, and non-glucosensing and as OA-excited (OAE), -inhibited (OAI), or nonresponsive using previously established criteria for changes in [Ca2+]i area under the curve (AUC) (22, 27, 28). Studies began with neurons held at 2.5 mmol/l glucose. Changes in [Ca2+]i fluctuations in response to glucose and OA were assessed over 10-min periods after the addition of each substance. All neurons were incubated with 20 nmol/l of glutamate terminally to ensure that they were functionally viable.
In Vivo Effects of P5 DIO VMH CD36 Depletion
Rats injected at P5 were weaned at 3 wk of age onto chow for 7 wk, followed by 7 wk on a 45% fat diet. After each diet period, rats underwent an OGTT. Terminally, rats were decapitated, and the brains were harvested for micropunch of specific brain areas followed by QPCR. Trunk blood was collected for glucose, insulin, leptin, free FA, and β-hydroxybutyrate. Retroperitoneal, perirenal, mesenteric, and epididymal fat pads were weighed as representative of visceral fat, and inguinal pads were taken as representative of subcutaneous fat. Liver and muscle were assessed for their triglyceride content. Liver triglycerides were stained with O-red oil and counterstained with hematoxylin.
OGTT
During the last week of each diet period, in both P5- and P21-injected rats, food was removed 2 h prior to light onset, rats were gavaged with 2 g/kg glucose, and blood was sampled by tail nip at 15, 30, 60, 90, and 120 min for glucose and insulin. Insulin sensitivity index was calculated according to the Matsuda and DeFronzo formula: 10,000/square root of (fasting glucose × fasting insulin) × (mean glucose × mean insulin during OGTT) (42).
Glucoprivic Test
During the final week, food was removed from P21-injected DR and DIO rats 2 h prior to light onset, and rats were injected subcutaneously with 200 mg/kg of 2-deoxy-d-glucose (2DG). Blood was sampled by tail nip at 30, 60, 90, and 120 min for glucose.
Refeeding Test
In P21-injected rats, during the 8th wk on a 45% fat diet, DR and DIO rats were fasted for 24 h and then refed with a 45% fat diet. Food was measured at 4 h and 24 h.
Assays of Insulin, Leptin, Free FA, β-Hydroxybutyrate, and Glucose
Plasma insulin and leptin levels were analyzed with radioimmunoassay kits (Linco, Carlsbad, CA). Plasma free FA and β-hydroxybutyrate levels were analyzed using a colorimetric assay (Wako, Richmond, VA). Plasma blood glucose was measured using a glucose Analox instrument (Lunenburg, MA).
Triglycerides Assay in Liver and Muscle
Triglycerides were measured in liver and muscle tissue, according to the manufacturer's protocol (Cayman, Ann Arbor, MI). Briefly, 400 mg of tissue was homogenized and centrifuged at 10,000 g for 10 min at 4°C. The supernatant was then assayed colorimetrically at 540 nm.
O-Red Oil Staining and Hematoxylin Counterstained
Liver was cut in 10-μm sections and air dried onto the untreated slide. Slides were fixed in 10% formalin for 1 h and rinsed with water and isopropanol. They were then stained with O-red oil for 15 min at room temperature and rinsed with water before being counterstained with hematoxylin for 1 min (24). Slides were rinsed with running tap water for 10 min and coverslipped with a 10% glycerol/PBS solution.
Gene Expression in Dissociated VMH Neurons and VMN and ARC Micropunches
After determination of neuronal glucose and FA sensing, 120 μl of lysis buffer (Ambion, Austin, TX) were added to the dissociated neurons, and mRNA was quantified by QPCR, as previously described (20, 27, 28, 38). The resultant cDNA was analyzed using TaqMan MGB primer/probes sets targeting gene involved in glucose and FA metabolism (27, 28). Data were expressed as the ratio of the gene of interest relative to the housekeeping gene, cyclophilin (20, 27, 28, 38).
Statistics
Responses of neurons to changes in glucose and OA were compared using χ2 statistics (GraphPad Prism, La Jolla, CA). One-way and two-way ANOVA and ANOVA for repeated measures with post hoc Bonferroni corrections were used for the in vivo studies. Outliers were removed if necessary (Systat, Chicago, IL).
RESULTS
Effects of Depleting VMH CD36 at P21 in DIO and DR Rats
Physiological effects of VMH CD36 depletion.
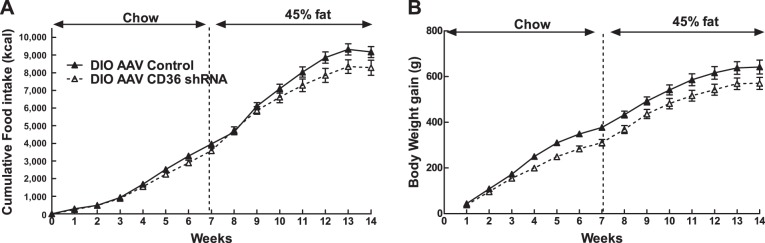
After 10 wk on a 45% fat diet, DIO VMH AAV CD36 shRNA rats ate 10% more and gained 7% more weight than controls (F1,12 = 29.872; P < 0.0001) (Table 1, Fig. 1, A and B). On the other hand, DR VMH AAV CD36 shRNA rats ate the same amount of food but gained 9% less weight than controls (F1,13 = 4.682, P < 0.05; Table 1, Fig. 1, A and B). Overall, VMH injections of AAV CD36 shRNA induced an increase in total fat mass (as a percentage of body weight) in DR rats by 40% and DIO rats by 28% compared with controls (Table 1). In VMH AAV CD36 shRNA rats, visceral mesenteric fat pads (as a percentage of body weight) were increased by 28% in DR and 50% in DIO, while subcutaneous inguinal fat pads were increased by 64% in both DR and DIO VMH AAV CD36 shRNA rats, suggesting that DR rats tended to distribute more of their added adiposity to their subcutaneous rather than visceral depots than did DIO rats (Table 1). In keeping with their increased overall adiposity, leptin levels were elevated by 115% in DR and by 212% in DIO VMH AAV CD36 shRNA rats compared with their respective controls (Table 1). DIO controls and DIO VMH AAV CD36 shRNA leptin levels were higher than comparable DR control rat levels (Table 1). Finally, depletion of VMH CD36 in DR caused them to have the same amount of body fat and leptin levels as DIO controls (Table 1). Whereas depleting VMH CD36 caused DR and DIO rats to become more obese than their respective controls, it also stunted their linear growth by 8% and 7%, respectively (Table 1). Importantly, VMH CD36 depletion did not alter serum FFA levels in DIO and DR rats. However, serum ketone levels represented by β-hydroxybutyrate were lower in DR VMH AAV CD36 rats (Table 1).
Table 1.
Morphometric and biochemical data after 10 wk on 45% fat diet for DIO and DR rats injected in the VMH with AAV control (n = 7 or 8) or AAV CD36 shRNA (n = 8) at P21
| DR AAV Control | DR AAV CD36 shRNA | DIO AAV Control | DIO AAV CD36 shRNA | |
|---|---|---|---|---|
| Initial body weight, g | 66.9 ± 1.2 | 66.1 ± 1.8 | 66.9 ± 0.9 | 67.0 ± 1.3 |
| Final Body weight, g | 407 ± 7a | 384 ± 7b | 599 ± 10c | 645 ± 17d |
| Body weight gain, g | 341 ± 6a | 318 ± 8b | 533 ± 10c | 579 ± 17d |
| Naso-anal length, cm | 24.5 ± 0.3a | 22.6 ± 0.5b | 26.7 ± 0.3c | 25.0 ± 0.5a |
| Total Food intake | 5133 ± 126a | 4822 ± 147a | 6876 ± 142a | 7614 ± 99b |
| Retroperitoneal, %BW | 2.8 ± 0.2 | 3.2 ± 0.2 | 3.3 ± 0.2 | 3.5 ± 0.2 |
| Mesenteric, %BW | 1.4 ± 0.1a | 1.8 ± 0.1b | 2.2 ± 0.2c | 3.3 ± 0.1d |
| Inguinal, %BW | 2.5 ± 0.1a | 4.1 ± 0.1b | 2.8 ± 0.3a | 4.6 ± 0.1b |
| Epididymal, %BW | 2.6 ± 0.2a | 3.9 ± 0.1b | 3.2 ± 0.2a | 3.1 ± 0.2a |
| Perirenal, %BW | 0.8 ± 0.1 | 0.8 ± 0.1 | 0.8 ± 0.1 | 1.0 ± 0.1 |
| Total fat pad, g | 42 ± 3a | 55 ± 2b | 76 ± 6c | 106 ± 5d |
| Total fat pad, %BW | 10.2 ± 0.7a | 14.3 ± 0.5b | 12.5 ± 0.8a | 16.1 ± 0.6b |
| Liver, g | 12.2 ± 0.6a | 10.1 ± 0.5b | 20.6 ± 0.6c | 22.1 ± 1c |
| Liver, %BW | 3.0 ± 0.1a | 2.6 ± 0.1a | 3.4 ± 0.1b | 3.4 ± 0.1b |
| Glucose, mg/dl | 175 ± 5 | 168 ± 3 | 176 ± 5 | 170 ± 2 |
| Insulin, ng/ml | 1.50 ± 0.14a | 1.70 ± 0.32a | 3.18 ± 0.71a | 5.73 ± 0.89b |
| Leptin, ng/ml | 13 ± 2a | 28 ± 4b | 25 ± 6b | 78 ± 15c |
| FFA, μM | 487 ± 52 | 541 ± 141 | 787 ± 183 | 635 ± 70 |
| βOHB, μM | 649 ± 82a | 349 ± 23b | 554 ± 77a | 436 ± 71a |
| Glucose AUC, mg·dl−1·120 min−1 | 23707 ± 755a | 22753 ± 433a,b | 21670 ± 1157b | 30860 ± 2531c |
| Insulin AUC, mg·dl−1·120 min−1 | 107 ± 15a | 146 ± 18a | 219 ± 46b | 512 ± 69c |
| Insulin sensitivity index | 34.7 ± 2.8a | 30.3 ± 3.7a | 17.5 ± 2.9b | 6.9 ± 1.3c |
Data are expressed as means ± SE.
DIO, diet-induced obesity; DR, diet-resistant; AAV, adeno-associated virus; BW, body weight; FFA, free fatty acid; bOHB, beta-hydroxybutyrate.; AUC, area under the curve. Parameters with different letter superscripts (a, b, c, d) differ from each other at the P < 0.05 level by post hoc Bonferroni adjustment after significant intergroup differences were found by two-way ANOVA.
Fig. 1.
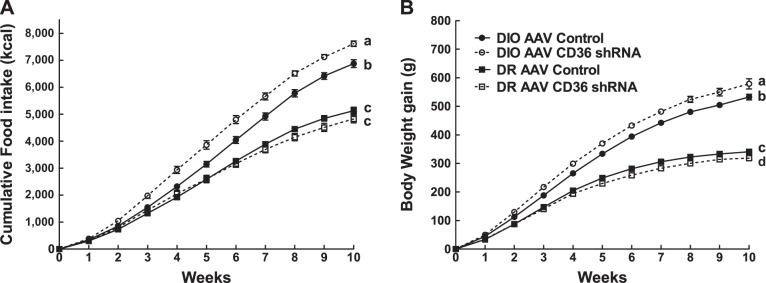
Cumulative food intake (A) and body weight gain (B) over 10 wk on 45% fat diet in diet-induced obese (DIO) adeno-associated virus (AAV) control (n = 7), DIO AAV CD36 short hairpin RNA (shRNA) (n = 8), DR AAV control (n = 8), and DR AAV CD36 shRNA (n = 8) rats injected in the ventromedial hypothalamus (VMH) at 3 wk of age. Parameters with different letter superscripts (a, b, c, d) differ from each other at the P < 0.05 level by post hoc Bonferroni adjustment after significant intergroup differences were found by two-way ANOVA.
Although basal fasting glucose levels did not differ among the groups in association with their increased adiposity (Table 1), basal fasting insulin levels were 80% higher in DIO VMH AAV CD36 shRNA rats than their controls (Table 1). During an OGTT, glucose and insulin levels remained elevated over the entire 120-min test in DIO VMH AAV CD36 shRNA rats (Fig. 2, A and B) and glucose and insulin AUCs were increased by 118% and 148%, respectively (Table 1). This resulted in a 61% decrease in their insulin sensitivity indexes compared with their controls (Table 1). On the other hand, VMH CD36 depletion had no effect on glucose or insulin levels or insulin sensitivity as assessed by an OGTT in DR rats (Table 1).
Fig. 2.
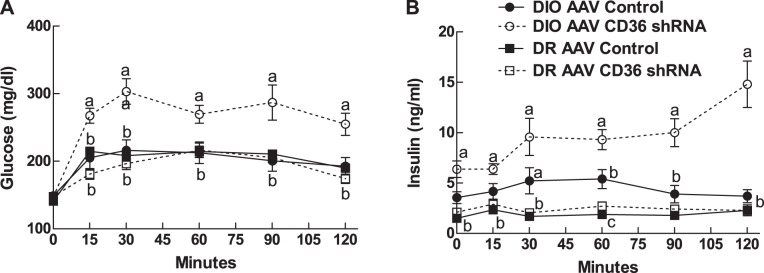
Oral glucose tolerance test (2 g/kg) was performed after 9 wk on 45% fat diet in DIO AAV control (n = 7), DIO AAV CD36 shRNA (n = 8), DR AAV control (n = 8) and DR AAV CD36 shRNA (n = 8) rats injected in the VMH at 3 wk of age. Parameters with different letter superscripts (a, b, c) differ from each other at the P < 0.05 level by post hoc Bonferroni adjustment after significant intergroup differences were found by two-way ANOVA.
To assess the potential effects of VMH CD36 depletion on the counterregulatory response to glucoprivation, 2DG was administered systemically during the last week of the study. Overall, DIO rats had a greater hyperglycemic response to 2DG (F1,23 = 6.88; P = 0.017; Fig. 3) than DR. The main effect of VMH CD36 depletion was to increase the DIO and to decrease the DR hyperglycemic responses to 2DG, especially during the last 30 min of the 120-min test (Interaction: F1,25 = 5.179; P = 0.032) (Fig. 3A).
Fig. 3.
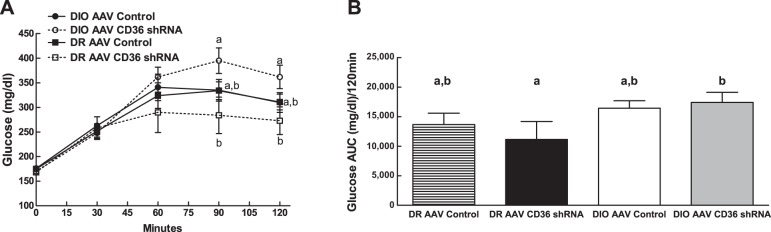
Effects of 2-deoxyglucose (200 mg/kg sc) injections in fasted rats after 10 wk on 45% fat diet in DIO AAV control (n = 7), DIO AAV CD36 shRNA (n = 8), DR AAV control (n = 8), and DR AAV CD36 shRNA (n = 8) rats injected in the VMH at 3 wk of age. Parameters with different letter superscripts (a, b) differ from each other at the P < 0.05 level by post hoc Bonferroni adjustment after significant intergroup differences were found by 2-way ANOVA.
Refeeding after a 24-h fast was assessed after 8 wk on a 45% fat diet. Overall, DIO rats ate more than DR rats during 24 h of refeeding (F1,27 = 37.727; P = 0.0001; Fig. 4). VMH CD36 depletion caused DR rats to eat 23% less at 4 h and 20% less over 24 h of refeeding than their controls. VMH CD36 depletion had less of an effect on DIO rats, which ate comparable amounts over 1 h and 4 h, and only 8% less than their comparable controls over 24 h of refeeding (Fig. 4).
Fig. 4.
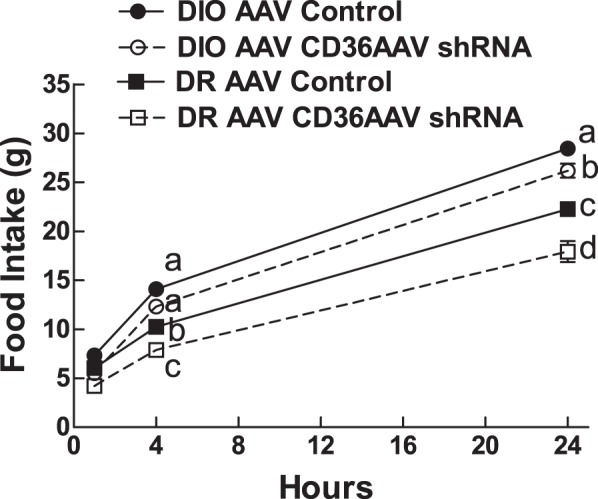
Refeeding was assessed at 1 h, 4 h, and 24 h after a 24-h fast after 8 wk on a 45% fat diet in DIO AAV control (n = 7), DIO AAV CD36 shRNA (n = 8), DR AAV control (n = 8), and DR AAV CD36 shRNA (n = 8) rats injected in the VMH at 3 wk of age. Parameters with different letter superscripts (a, b, c, d) differ from each other at the P < 0.05 level by post hoc Bonferroni adjustment after significant intergroup differences were found by two-way ANOVA.
Effects of VMH CD36 depletion at P21 on DIO and DR VMH gene expression.
Gene expression of proteins involved in glucose and FA metabolism, as well as neuropeptides controlling food intake were assessed in DIO and DR, as previously published in our outbred rat study (27). VMH injection of AAV expressing CD36 shRNA at P21 resulted in 66% and 64% reduction in VMH (ARC + VMH) CD36 mRNA expression after 10 wk on a 45% fat diet in DR and DIO compared with their respective controls (Table 2). This was associated with a 58% and 57% reduction in DR and DIO agouti-related protein (AgRP), a 47% decrease in DR and DIO proopiomelanocortin (POMC), and a 15% and 34% increase in DR and DIO glucokinase mRNA expression compared with their respective controls (Table 2). Expression of FA transport protein 2 (FATP2) mRNA was increased by 56% and 100%, and FATP4 expression was increased by 13% and 25% in DR and DIO VMH CD36-depleted rats compared with their respective controls (Table 2). Other genes involved in FA metabolism were analyzed but were not affected by VMH CD36 depletion.
Table 2.
VMH gene expression after 10 wk on 45% fat diet for DIO and DR rats injected in the VMH with AAV control (n = 7 or 8) or AAV CD36 shRNA (n = 8) at P21
| DR |
DIO |
|||
|---|---|---|---|---|
| mRNA | AAV Control | CD36 AAV shRNA | AAV Control | CD36 AAV shRNA |
| CD36 | 3.57 ± 0.66a | 1.56 ± 0.25b | 3.02 ± 0.45a | 1.10 ± 0.28b |
| NPY | 2.56 ± 0.59 | 2.11 ± 0.5 | 1.59 ± 0.22 | 1.71 ± 0.20 |
| AgRP | 2.98 ± 0.84a | 1.25 ± 0.50b | 1.92 ± 0.37a | 0.82 ± 0.21b |
| POMC | 2.01 ± 0.49a | 1.06 ± 0.42b | 2.47 ± 0.49a | 1.32 ± 0.45b |
| Glucokinase | 1.82 ± 0.11a | 2.08 ± 0.09b | 1.65 ± 0.08a | 2.21 ± 0.10b |
| Fatty acid synthase | 1.93 ± 0.07b | 2.28 ± 0.08b | 1.87 ± 0.07a | 2.17 ± 0.14b |
| FATP1 | 2.05 ± 0.18 | 2.08 ± 0.15 | 1.92 ± 0.13 | 2.36 ± 0.25 |
| FATP2 | 1.67 ± 0.33a | 2.60 ± 0.20b | 1.53 ± 0.32a | 3.06 ± 0.44b |
| FATP4 | 1.92 ± 0.08a | 2.23 ± 0.08b | 1.87 ± 0.07a | 2.34 ± 0.08b |
| FATP6 | 2.30 ± 0.17 | 1.86 ± 0.26 | 1.63 ± 0.26 | 2.10 ± 0.47 |
| CPT1a | 2.66 ± 0.32 | 2.42 ± 0.11 | 2.07 ± 0.35 | 2.44 ± 0.24 |
| CPT1c | 2.10 ± 0.07a | 1.92 ± 0.06b | 1.81 ± 0.07b | 1.84 ± 0.09b |
| Acyl-CoA synthetase 1 | 2.27 ± 0.25 | 1.89 ± 0.08 | 2.00 ± 0.11 | 1.75 ± 0.10 |
| Acyl-CoA synthetase 3 | 2.00 ± 0.06 | 2.08 ± 0.07 | 1.85 ± 0.08 | 1.97 ± 0.11 |
| Acyl-CoA synthetase 4 | 2.01 ± 0.10 | 2.08 ± 0.12 | 1.85 ± 0.12 | 1.95 ± 0.22 |
| Acyl-CoA synthetase 5 | 1.81 ± 0.13 | 2.13 ± 0.12 | 1.67 ± 0.12 | 1.97 ± 0.24 |
| Acyl-CoA synthetase 6 | 2.17 ± 0.09 | 2.06 ± 0.13 | 2.06 ± 0.05 | 1.86 ± 0.15 |
| Malonyl CoA decarboxylase | 2.14 ± 0.14 | 2.32 ± 0.21 | 1.76 ± 0.13 | 2.16 ± 0.11 |
| HSL | 1.91 ± 0.07 | 1.79 ± 0.07 | 2.00 ± 0.08 | 1.83 ± 0.16 |
| UCP2 | 1.94 ± 0.25 | 1.75 ± 0.22 | 2.14 ± 0.25 | 1.83 ± 0.15 |
Data are expressed as means ± SE of duplicate determinations expressed relative to the amount of the mRNA expression of the housekeeping gene, cyclophilin. n = 7 or 8/group. NPY, neuropeptide Y; AgRP, agouti-related protein; FATP, fatty acid transport protein 2; CPT, carnitine palmitoyltransferase; CoA, coenzyme A; HSL, hormone-sensitive lipase; UCP2, uncoupling protein 2. Parameters with different letter superscripts (a, b) differ from each other at the P < 0.05 level by post hoc Bonferroni adjustment after significant intergroup differences were found by two-way ANOVA.
Effect of VMH CD36 Depletion at P5 on DR and DIO Neuronal Gene Expression and Glucose and FA Sensing
The first set of studies assessed the effects of depleting VMH CD36 at P21, after hypothalamic development is largely completed (7). We next assessed the effects of depleting VMH CD36 beginning during the early postnatal period (P5), when important hypothalamic pathways are still developing; we assessed the effects of VMH depletion on neuronal FA sensing and the resultant effects on the regulation of energy and glucose homeostasis in DIO vs. DR rats. Thus, DIO and DR neonates were injected in the VMH with AAV CD36 shRNA at P5 and either had their VMH neuronal FA sensing properties assessed at P21–P23 in vitro. An additional group of DIO rats were injected in the VMH with AAV CD36 shRNA at P5 and then were followed in vivo on a low- or high-fat diet to assess their regulation of energy and glucose homeostasis. At P21, VMH neurons were dissociated and assessed for their capacity to sense OA at 0.1, 15, and 100 nmol/l in 2.5 mM glucose (29), followed by an assay of changes in gene expression in pooled neurons. VMH AAV CD36 shRNA injections at P5 depleted DR and DIO CD36 by 58% and 40% at P21–P28, respectively. This was associated with an 88% and 52% increase in DR and DIO FATP2 mRNA expression, respectively, without significant effects on the expression of neuropeptide Y (NPY), AgRP, POMC, or glucokinase (Table 3). At this age, DIO VMH neurons had a 6–9-fold greater expression of NPY than DR neurons (Table 3). VMH CD36 depletion had no effect on the proportion of GE or GI neurons in either DIO or DR rats (Table 4), a result comparable to what we previously found in VMH CD36-depleted Sprague-Dawley rats (27). On the other hand, VMH CD36 depletion altered neuronal FA sensing over a range of 0.1, 15, and 100 nmol/l OA (Table 4). When considered independently of their glucosensing status, there was no effect of VMH CD36 depletion on the proportion of VMH neurons that were excited or inhibited by OA in DIO and DR rats (Table 4). However, as a function of their glucosensing properties, the proportion of GE neurons from VMH CD36-depleted DIO rats that were excited by OA (OAE) was reduced by 50%, while there was no effect on OA responses in GI neurons (Table 4). In DR rats, VMH CD36 depletion reduced the proportion of GE neurons that was inhibited by OA (OAI) by 81% compared with controls (Table 4). VMH CD36 depletion had no effect on the percentage of GI neurons that were excited or inhibited by OA in DIO rats (Table 4). There was an overall phenotype effect on neuronal FA sensing. DIO rats had 24% fewer GE neurons that were excited by OA than did DR rats, while, in DIO VMH CD36-depleted GE neurons, there were 60% fewer that were OA-excited, but 400% more that were inhibited by OA than in DR VMH CD36-depleted rats (Table 4).
Table 3.
mRNA expression in dissociated VMH neurons from P21–P28 male DIO and DR rats injected at P5 in the VMH with AAV control or AAV CD36 shRNA at 3 wk of age
| VMH DR |
VMH DIO |
|||
|---|---|---|---|---|
| mRNA | AAV Control | AAV CD36 shRNA | AAV Control | AAV CD36 shRNA |
| CD36 | 1.47 ± 0.36a | 0.62 ± 0.12b | 0.68 ± 0.07b | 0.40 ± 0.05c |
| NPY | 0.16 ± 0.02a | 0.16 ± 0.02a | 1.42 ± 0.26b | 0.95 ± 0.22b |
| AgRP | 1.25 ± 0.13 | 1.01 ± 0.08 | 1.44 ± 0.26 | 0.95 ± 0.26 |
| POMC | 0.89 ± 0.14a | 0.54 ± 0.12a | 1.17 ± 0.16b | 1.00 ± 0.16a,b |
| Glucokinase | 1.02 ± 0.12 | 0.91 ± 0.09 | 1.01 ± 0.07 | 0.88 ± 0.10 |
| FATP2 | 0.59 ± 0.10a | 1.11 ± 0.12b | 0.78 ± 0.09a | 1.19 ± 0.11b |
Data are expressed as means ± SE of duplicate determinations expressed relative to the amount of the mRNA expression of the housekeeping gene, cyclophilin. n =14–16/group. VMH, ventromedial hypothalamus; POMC, proopiomelanocortin. Parameters with different letter superscripts (a, b, c) differ from each other at the P < 0.05 level by post hoc Bonferroni adjustment after significant intergroup differences were found by two-way ANOVA.
Table 4.
Effect of glucose and oleic acid in dissociated VMH neurons from P21–P28 male DIO and DR rats injected at P5 in the VMH with AAV control or AAV CD36 shRNA at 3 wk of age
| DR AAV Control |
DR AAV CD36 shRNA |
DIO AAV Control |
DIO AAV CD36 shRNA |
|||||||||
|---|---|---|---|---|---|---|---|---|---|---|---|---|
| % of total | OAE | OAI | % of total | OAE | OAI | % of total | OAE | OAI | % of total | OAE | OAI | |
| GE | 18 | 63 | 16 | 16 | 59 | 3* | 16 | 48‡ | 11 | 10 | 24*‡ | 15‡ |
| GI | 15 | 74 | 6 | 13 | 80 | 8 | 11 | 78 | 3 | 14 | 68 | 2 |
| NG | 68 | 49 | 10 | 71 | 56 | 12 | 73 | 51 | 23 | 77 | 41 | 10 |
| Total | 100 (240) | 55 (133) | 10 (25) | 100 (196) | 60 (118) | 10 (20) | 100 (342) | 54 (183) | 19 (64) | 100 (346) | 43 (148) | 10 (33) |
DR and DIO rats were injected with control AAV or AAV CD36 shRNA in the VMH at P5, and dissociated VMH neurons were assessed by fura-2 calcium imaging at P21–P28. Neurons were first classified by glucosensing categories by alterations in [Ca2+]i oscillations, as glucose was changed from 2.5 to 0.5 to 2.5 mmol/l and then for fatty acid sensing to 0.1, 15, and 100 nmol/l oleic acid (OA) at 2.5 mmol/l glucose. Neurons were classified as OA excited (OAE), inhibited (OAI), or nonresponsive (OAN). Data are expressed as means ± SE percent of total neurons tested in each category. GE, glucose excited; GI, glucose inhibited; NG, nonglucosensing. Total = total percent of each category of neurons at each glucose concentration, irrespective of their glucosensing properties with the number of neurons tested in each group divided by the total number tested in parentheses. n = 8 rats/group.
P < 0.05 χ2 test AAV vs. control rats.
P < 0.05 χ2 test DR vs. DIO rats with same category.
Physiological, Metabolic, and Molecular Effects of P5 VMH CD36 Depletion in DIO Rats
The majority of physiological and metabolic abnormalities caused by depleting VMH CD36 beginning at P21 were observed in DIO rats. Furthermore, when VMH CD36 was depleted at P5, more abnormalities of neuronal FA sensing occurred in DIO than DR rats. For that reason, we further assessed the effects of early neonatal depletion of VMH CD36 on glucose and energy metabolism in DIO rats. VMH CD36 depletion at P5 had no effect on intake of either chow or 45% fat diet but was associated with an 18% decrease in body weight gain on chow but not on 45% fat diet (Table 5, Fig. 5). Despite the lack of difference in overall body weight gain or final body weight, DIO rats depleted of VMH CD36 at P5 had 9% more total fat mass (as a percentage of body weight; Table 5). This increase in fat mass was almost completely accounted for by a selective 45% increase in subcutaneous (inguinal) fat (Table 5). Paradoxically, the decrease in body weight gain after 7 wk on chow in VMH CD36-deleted DIO rats was associated with 134% higher leptin levels, while the increase in total fat mass after another 7 wk on 45% fat diet resulted in no differences in leptin levels (Table 5). Nor did CD36 depletion alter overall linear growth (naso-anal length; Table 5) as it did in DIO rats with VMH CD36 depletion beginning at P21. Importantly, P5 VMH CD36 depletion was associated with a 34% and 39% decrease in insulin sensitivity (insulin sensitivity index) after 7 wk on chow and 45% fat diet, respectively (Table 5). This reduction in insulin sensitivity in VMH CD36-depleted DIO rats was likely due to a marked infiltration of the liver with fat, as demonstrated using oil-red O stain (Fig. 6) and a 71% increase in liver triglycerides compared with controls (Table 5). On the other hand, there was no apparent infiltration of muscle by ectopic fat in these rats (Table 5).
Table 5.
Morphometric and biochemical data for male DIO rats injected in the VMH at P5 with AAV control (n = 10) or AAV CD36 shRNA (n = 10) and fed 13.5% fat chow diet from weaning for 7 wk, followed by 7 wk on 45% fat diet
| AAV Control | AAV CD36 shRNA | |
|---|---|---|
| 7-wk 13.5% Fat Diet | ||
| Initial body weight, g | 48.2 ± 1.4 | 47.4 ± 0.7 |
| Body weight chow, g | 425 ± 11 | 358 ± 14* |
| Body weight gain on chow, g | 377 ± 11 | 310 ± 10* |
| Food intake on chow, kcal | 3692 ± 122 | 3584 ± 155 |
| Leptin, ng/ml | 6.9 ± 11 | 16.2 ± 3.3* |
| Glucose, mg/dl | 128 ± 6 | 145 ± 5* |
| Insulin, ng/ml | 1.29 ± 0.16 | 1.86 ± 0.28 |
| Glucose AUC, mg·dl−1·120 min−1 | 14417 ± 487 | 14592 ± 483 |
| Insulin AUC, mg·dl−1·120 min−1 | 78 ± 5 | 74 ± 11 |
| Insulin sensitivity index | 53.8 ± 3.7 | 35.7 ± 3.7* |
| 7-wk 45% Fat Diet | ||
| Body weight gain on 45% fat, g | 264 ± 20 | 259 ± 15 |
| Food intake on 45% fat, kcal | 5592 ± 295 | 4960 ± 386 |
| Total 7-wk 13.5% and 7-wk 45% Fat Diet | ||
| Final body weight, g | 690 ± 30 | 617 ± 26 |
| Total body weight gain, g | 642 ± 30 | 570 ± 26 |
| Total food intake, kcal | 9173 ± 307 | 8286 ± 429 |
| Feed efficiency total, BWG (g)/FI (kcal) · 1000 | 70 ± 3 | 69 ± 2 |
| Naso-anal length | 18.9 ± 0.6 | 18.1 ± 1.4 |
| Leptin, ng/ml | 36.4 ± 2.1 | 41 ± 2.4 |
| Retroperitoneal, %BW | 3.3 ± 0.2 | 3.2 ± 0.1 |
| Mesenteric, %BW | 3.0 ± 0.1 | 3.0 ± 0.2 |
| Inguinal, %BW | 4.2 ± 0.2 | 6.1 ± 0.3* |
| Epididymal, %BW | 3.3 ± 0.1 | 3.2 ± 0.2 |
| Perirenal, %BW | 0.8 ± 0.1 | 0.9 ± 0.1 |
| Total fat pads, g | 99.6 ± 6.1 | 100.6 ± 4.3 |
| TFP, %BW | 15.1 ± 0.2 | 16.5 ± 0.4* |
| Glucose, mg/dl | 195 ± 7 | 196 ± 7 |
| Insulin, ng/ml | 2.25 ± 0.30 | 3.89 ± 0.50* |
| Glucose AUC, mg·dl−1·120 min−1 | 9571 ± 1441 | 9304 ± 859 |
| Insulin AUC, mg·dl−1·120 min−1 | 311 ± 42 | 326 ± 45 |
| Insulin Sensitivity Index | 27.8 ± 3.4 | 16.9 ± 3.8* |
| Liver, g | 18.9 ± 0.6 | 18.1 ± 1.4 |
| Liver, %BW | 2.9 ± 0.1 | 3.0 ± 0.2 |
| Liver triglycerides, mg TG/mg tissue | 4.80 ± 0.45 | 8.21 ± 1.19* |
| Muscle triglycerides, mg TG/mg tissue | 2.62 ± 0.11 | 3.50 ± 0.58 |
Data are expressed as means ± SE. BWG, body weight gain; TG, triglycerides.
P < 0.05 or less comparing control to AAV CD36 short hairpin RNA (shRNA) values.
Fig. 5.
Food intake (A) and body weight gain (B) of DIO rats injected at P5 in their VMH with either control AAV or AAV expressing CD36 shRNA fed 7 wk on 13.5% fat chow diet from weaning and 7 wk on 45% high-fat (HF) diet (n = 10/group).
Fig. 6.

DIO rats injected at P5 with AAV control vs. AAV CD36 shRNA and fed for 7 wk on 13.5% fat diet from weaning and then 7 wk on 45% high-fat diet. Ten-micrometer liver sections were stained with O-red oil and hematoxylin counterstain: VMH AAV Control 4× (A), VMH AAV Control 10× (B), VMH AAV Control 20× (C) and VMH AAV CD36 shRNA 4× (D), VMH AAV CD36 shRNA 10× (E), and VMH AAV CD36 shRNA 20× (F).
Many of the marked alterations in neuronal FA sensing at P21–P28 (Table 4) and physiological, metabolic (Fig. 5, Table 5), and molecular (Table 6) abnormalities after exposure to chow and 45% fat diets (Fig. 5, Table 5) in DIO rats injected at P5 in the VMH with AAV CD36 shRNA were similar to those seen in DIO rats injected at P21. However, there was no significant depletion of VMH CD36 expression in AAV CD36 shRNA-injected rats (Table 6). Given the marked changes in physiology, metabolism, and molecular expression, it is likely that there was significant depletion of VMH CD36 at some point during development but that this depletion had waned by 14 wk after injection. The possibility that FA transport into VMH neurons was impaired by depleting CD36-mediated FA transport was suggested by a likely compensatory increase in the expression of other established FA transporters (FATP1, FATP2, and FATP6) in the ARC and VMN of DIO rats injected at P5. As with P21-injected rats (Table 2), there was also decreased ARC AgRP expression (Table 6). In addition, the possibility of enhanced neuronal glucosensing was suggested by increased VMN expression of the Kir6.2 subunit of the KATP channel and of GLUT4. On the other hand, ARC AMPKα2 expression was decreased in VMH CD36-depleted vs. control DIO rats (Table 6).
Table 6.
Effects of P5 VMH CD36 depletion on DIO rat ARC and VMN gene expression after 7 wk on a 13.5% fat chow diet and 7 wk on a 45% fat diet
| ARC |
VMN |
|||
|---|---|---|---|---|
| mRNA | AAV Control | AAV CD36 shRNA | AAV Control | AAV CD36 shRNA |
| CD36 | 0.66 ± 0.14 | 0.60 ± 0.13 | 0.46 ± 0.05 | 0.63 ± 0.07 |
| NPY | 0.61 ± 0.06 | 0.75 ± 0.10 | ||
| AgRP | 1.12 ± 0.13 | 0.41 ± 0.11* | ||
| POMC | 0.77 ± 0.10 | 1.22 ± 0.68 | ||
| Glucokinase | 0.64 ± 0.04 | 0.85 ± 0.13 | 0.59 ± 0.05 | 0.47 ± 0.06 |
| Kir6.2 | 0.85 ± 0.12 | 1.48 ± 0.37 | 0.62 ± 0.03 | 0.93 ± 0.09* |
| Fatty acid synthase | 0.66 ± 0.06 | 0.77 ± 0.14 | 0.73 ± 0.07 | 0.92 ± 0.11 |
| FATP1 | 0.77 ± 0.08 | 0.87 ± 0.13 | 0.48 ± 0.03 | 0.63 ± 0.06* |
| FATP2 | 0.35 ± 0.05 | 1.29 ± 0.32* | 0.40 ± 0.05 | 0.63 ± 0.07* |
| FATP4 | 0.69 ± 0.03 | 0.73 ± 0.03 | 0.53 ± 0.04 | 0.59 ± 0.04 |
| FATP6 | 0.24 ± 0.03 | 1.29 ± 0.39* | 0.38 ± 0.04 | 0.57 ± 0.07* |
| CPT1a | 0.99 ± 0.12 | 0.65 ± 0.21 | 0.69 ± 0.13 | 0.54 ± 0.12 |
| CPT1c | 0.70 ± 0.03 | 0.71 ± 0.10 | 0.63 ± 0.02 | 0.57 ± 0.03 |
| Acyl-CoA synthetase 1 | 0.75 ± 0.05 | 0.80 ± 0.14 | 0.55 ± 0.03 | 0.45 ± 0.04 |
| Acyl-CoA synthetase 3 | 0.53 ± 0.04 | 0.47 ± 0.07 | 0.77 ± 0.07 | 0.74 ± 0.10 |
| Acyl-CoA synthetase 4 | 0.82 ± 0.11 | 0.90 ± 0.16 | 0.28 ± 0.04 | 0.25 ± 0.03 |
| Acyl-CoA synthetase 5 | 0.65 ± 0.04 | 0.59 ± 0.03 | 0.55 ± 0.02 | 0.66 ± 0.03* |
| Acyl-CoA synthetase 6 | 0.82 ± 0.05 | 0.87 ± 0.14 | 0.58 ± 0.05 | 0.58 ± 0.07 |
| Malonyl CoA decarboxylase | 0.77 ± 0.02 | 0.71 ± 0.02 | 0.57 ± 0.02 | 0.64 ± 0.03 |
| AMPKα1 | 0.72 ± 0.05 | 0.69 ± 0.05 | 0.51 ± 0.02 | 0.56 ± 0.04 |
| AMPKα2 | 0.99 ± 0.09 | 0.65 ± 0.09* | 0.57 ± 0.12 | 0.36 ± 0.10 |
| GLUT4 | 1.55 ± 0.33 | 1.08 ± 0.24 | 0.35 ± 0.05 | 0.66 ± 0.11* |
| HSL | 0.82 ± 0.11 | 0.85 ± 0.13 | 0.59 ± 0.05 | 0.75 ± 0.05* |
| UCP2 | 0.71 ± 0.05 | 0.70 ± 0.09 | 1.00 ± 0.15 | 1.16 ± 0.26 |
Data are expressed as means ± SE of duplicate determinations expressed relative to the amount of the mRNA expression of the housekeeping gene, cyclophilin. n = 6–8/group. VMN, ventromedial nucleus of the hypothalamus; ARC, arcuate nucleus.
P < 0.05 control vs. CD36 AAV for each strain.
DISCUSSION
In these studies we demonstrate that depleting CD36 in the VMH of DR and DIO rats using an AAV expressing CD36 shRNA, beginning at either P5 or P21, had variable deleterious effects on neuronal FA sensing, carcass adiposity, adipose deposition, and linear growth depending upon underlying genotype and age at injection. These VMH CD36-induced alterations were more marked in DIO rats, which alone demonstrated hyperphagia and severe insulin resistance. Thus, whereas DR CD36 rats injected at P21 became fatter than both DR and DIO controls, they also became obese without becoming hyperphagic or insulin-resistant. After long-term exposure to 45% fat diet, VMH CD36 depletion was associated with a likely compensatory increase in the expression of various members of the FATP family, as well as glucokinase, the rate-limiting enzyme in neuronal glucosensing (11, 20). While this might suggest that FA sensing would be spared while glucosensing would be altered, both DR and DIO rats injected at P5 had reduced neuronal FA with no effects on glucosensing at P21–P28. DR rats had reduced numbers of GE neurons that were inhibited by OA, while DIO rats had reduced numbers of GE neurons that were excited by OA. This is in keeping with our previous finding that neuronal FA sensing is mediated predominantly by the receptor-mediated function of CD36 rather than its FA transport function required for intracellular neuronal FA metabolism (27). Finally, although P5 VMH AAV CD36 shRNA injections led to a number of physiological, metabolic, and molecular changes and reduced neuronal CD36 expression at P21–P28 in both DR and DIO rats, by the time similarly injected DIO rats were examined after 7 wk on chow and 7 wk on 45% fat diet, there was no longer any evidence of VMH CD36 depletion. This suggests the possibility that epigenetic events, such as DNA methylation or histone acetylation, might occur whereby early life interference with CD36-mediated FA sensing causes persistent alterations in physiological and metabolic functions that outlive the initial CD36 depletion. On the other hand, P5 VMH AAV CD36 shRNA injections might also have altered the anatomical development of critical ARC-paraventricular hypothalamic pathways since this circuitry is developing and neurons are still differentiating during the first 2 wk of postnatal life in rodents (7). Such anatomical changes might also cause long-lasting changes in physiological and metabolic functions. These types of epigenetic and/or anatomical changes are in keeping with Baker's hypothesis that stimuli or events that occur during critical periods of development can shape future health and disease (5).
An important outcome of these studies is that, despite the absence of hyperphagia, VMH CD36 depletion caused DR rats to become more obese, i.e., have higher adiposity and leptin levels, than DIO controls and as obese as hyperphagic VMH CD36-depleted DIO rats. The increase in fat mass without an increase in food intake or body weight gain seen in VMH CD36-depleted DR rats suggests that they had decreased energy expenditure. There are many ways this phenomenon could occur. These include reductions in physical activity, resting metabolic rate, diet-induced thermogenesis, and/or sympathetic activity. DR rats are extremely obesity-resistant (34, 37). The only other known manipulation that causes them to become persistently obese is cross-fostering of DR pups to obese DIO dams (16). In that case, the development of obesity was associated with elevated ARC AgRP expression, hyperphagia, and insulin resistance when fed a 31% fat diet. Here, the CD36-depleted DR rats, like VMH CD36-depleted Sprague-Dawley rats in our previous studies (27), deposited a large amount of fat (64% more than controls) primarily in their subcutaneous (inguinal) adipose depots. However, the Sprague-Dawley rats still became markedly insulin-resistant (27), while the DR rats here retained their insulin sensitivity despite additional significant deposition of fat in their visceral (mesenteric) adipose depots (28% more than controls). As in many past studies (32–36, 51), DIO rats deposit much more fat in their visceral depots and become insulin-resistant compared with DR rats when fed a high-fat diet. However, even though VMH CD36-depleted DIO rats also deposited a large amount of fat in their subcutaneous depots, which should have conferred some protection from insulin resistance (43), they still became markedly more insulin-resistant than their controls. Although hepatic lipid deposition was not assessed in DR vs. DIO rats injected at P21, the heavier livers (as a percent of body weight) in both DIO groups vs. DR rats and the marked hepatic triglyceride deposition of DIO rats injected at P5 makes it likely that hepatic steatosis accounts for the insulin resistance of both control and VMH CD36-depleted DIO rats injected at P21 (25, 56). This deposition of excess fat in the liver could be due to increased release of FA from the visceral fat depots into the portal vein (45, 56). Another effect of hyperinsulinemia and hyperglycemia that occurs in DIO rats is the inhibition β-oxidation of FA and the promotion of lipogenesis in the liver (52). Indeed, insulin is the primary stimulator of hepatic lipogenesis through activation of the sterol regulatory element-binding protein-1c transcription factor (13).
In the gut, FAT/CD36 functions as a FA transporter, as well as being a receptor or sensor (15, 40, 41). Thus, although we have shown previously that CD36 is the primary mediator of VMH neuronal FA sensing (27), the loss of its function as a FA transporter might be compensated for by increasing the expression (and function) of other FA transporters such as FATP4 in VMH micropunches and FATP2 in dissociated VMH neurons from both DR and DIO rats. However, it is not known whether CD36 has a FA transport function in neurons, and while increased expression of FATPs might have compensated for loss of CD36-mediated FA transport and downstream FA metabolism, FA oxidation has only a minor role in neuronal FA sensing (28). Thus, it was not surprising that depleting CD36 still altered FA sensing in DR and DIO rats despite increases in FATP expression. VMH CD36 depletion also reduced mRNA expression of the anabolic peptide AgRP and the catabolic peptide POMC in both DR and DIO rats injected at P21. VMH CD36 depletion similarly altered VMH neuronal FA sensing and decreased both AgRP and POMC expression in Sprague-Dawley rats (27). These results lend support to the contention that decreased peptide expression was a direct result of impaired FA sensing by POMC and AgRP neurons. Raised leptin levels in both VMH CD36-depleted DR and DIO rats could not account for these changes since this should have increased rather than decreased POMC expression (4, 57, 58). Also, since expression of both peptides was decreased in both DR and DIO rats, it is unlikely that this altered expression, per se, was responsible for the hyperphagia of CD36-depleted DIO, but not DR rats.
Finally, given the increase in VMH glucokinase expression after long-term depletion of VMH CD36 in both DIO and DR rats, it is possible that VMH neuronal glucosensing was impaired and might have contributed to their systemic metabolic abnormalities (11, 12, 20, 21, 31). However, over shorter periods, P5 VMH AAV CD36 shRNA injections caused no changes in glucokinase expression or neuronal glucosensing at P21–P28. Despite this, the impairments of neuronal FA sensing were totally a function of the glucosensing phenotype of the neurons examined. As in Sprague-Dawley rats (27), CD36 depletion significantly altered FA sensing only in GE neurons in DIO and DR rats. However, since both GE and GI neurons still responded to FA, it is clear that there are alternate pathways mediating VMH neuronal FA sensing. Our previous data (27, 28) suggest that some of these responses are mediated by intraneuronal FA oxidation, some of which is likely to be downstream of increased FA transport produced by the compensatory increase in FATPs seen here. In addition, VMH CD36 depletion stunted linear growth in DIO and DR rats. This suggests a role for VMH CD36-mediated FA sensing in mediating linear growth, possibly by an effect on growth hormone secretion. AgRP neurons contain growth hormone-secretagogue receptor that are activated by ghrelin and that induce growth hormone secretion (8, 62). Thus, the decrease in AgRP expression in VMH CD36-depleted DR and DIO rats might have contributed to their decreased linear growth (9, 49).
Perspectives and Significance
Specialized hypothalamic metabolic sensing neurons respond to changes in ambient brain levels of substrates such as glucose and FAs as signaling molecules to alter their activity (20, 28). While some FA-sensing neurons are regulated by alterations in intracellular FA metabolism, more than half of the signaling effects of long-chain FAs in VMN neurons is initiated by their binding to the FA transporter-receptor, FAT/CD36 (27). Using molecular manipulations to deplete CD36 in the VMH of selectively bred DR and DIO rats, we have demonstrated the importance of CD36 as a key regulator of energy and glucose homeostasis, fat depot repartitioning, and as a regulator of linear growth in a genotype-dependent fashion. For example, neuronal FA sensing in DIO rats was more affected by VMH CD36 depletion than in DR rats, and such depletion caused DIO rats to become more hyperphagic, obese, and insulin-resistant than their controls. On the other hand, VMH CD36-depleted DR rats were not hyperphagic and gained no more weight but still became as obese as control DIO rats on a high-fat diet. These changes occurred with selective redistribution of fat into subcutaneous depot with maintenance of normal insulin sensitivity compared with their controls. Such findings support a critical role for genotype-dependent, VMH CD36-mediated FA sensing in the regulation of both energy and glucose homeostasis, They also suggest that further assessment of energy expenditure and sympathetic activity in liver and adipose tissue are warranted to elucidate the mechanisms that underlie these CD36-induced metabolic alterations. Such studies should provide important insights into the ways in which lipids and high-fat diets affect the regulation of energy and glucose homeostasis and contribute to the growing epidemics of obesity and diabetes in the world.
GRANTS
This work was supported by the Research Service of the Department of Veterans Affairs (to B. E. Levin and A. Dunn-Meynell) and the National Institute of Diabetes and Digestive and Kidney Diseases (DK-53181 to B. E. Levin).
DISCLOSURES
No conflicts of interest, financial or otherwise, are declared by the authors.
AUTHOR CONTRIBUTIONS
Author contributions: C.L.F. and B.E.L. conception and design of research; C.L.F. and A.D.-M. performed experiments; C.L.F. and B.E.L. analyzed data; C.L.F. and B.E.L. interpreted results of experiments; C.L.F. prepared figures; C.L.F. drafted manuscript; C.L.F. and B.E.L. edited and revised manuscript; C.L.F. and B.E.L. approved final version of manuscript.
ACKNOWLEDGMENTS
The authors thank Sunny Lee, Antoinette Moralishvili, and Charlie Salter (all Veterans Affairs Medical Center) for their technical assistance. AAV CD36 shRNA was kindly supplied by S. Mousatov.
REFERENCES
- 1.Al-Almaie SM. Prevalence of obesity and overweight among Saudi adolescents in Eastern Saudi Arabia. Saudi Med J 26: 607–611, 2005. [PubMed] [Google Scholar]
- 2.Anand BK, Chhina GS, Sharma KN, Dua S, Singh B. Activity of single neurons in the hypothalamus feeding centers: effect of glucose. Am J Physiol 207: 1146–1154, 1964. [DOI] [PubMed] [Google Scholar]
- 3.Andersen LF, Lillegaard IT, Overby N, Lytle L, Klepp KI, Johansson L. Overweight and obesity among Norwegian schoolchildren: changes from 1993 to 2000. Scand J Public Health 33: 99–106, 2005. [DOI] [PubMed] [Google Scholar]
- 4.Balthasar N, Coppari R, McMinn J, Liu SM, Lee CE, Tang V, Kenny CD, McGovern RA, Chua SC Jr, Elmquist JK, Lowell BB. Leptin receptor signaling in POMC neurons is required for normal body weight homeostasis. Neuron 42: 983–991, 2004. [DOI] [PubMed] [Google Scholar]
- 5.Barker DJ. The developmental origins of adult disease. Eur J Epidemiol 18: 733–736, 2003. [DOI] [PubMed] [Google Scholar]
- 6.Baskin ML, Ard J, Franklin F, Allison DB. Prevalence of obesity in the United States. Obes Rev 6: 5–7, 2005. [DOI] [PubMed] [Google Scholar]
- 7.Bouret SG. Organizational actions of metabolic hormones. Front Neuroendocrinol 34: 18–26, 2013. [DOI] [PMC free article] [PubMed] [Google Scholar]
- 8.Briggs D, Lemus M, Kua E, Andrews Z. Diet-induced obesity attenuates fasting-induced hyperphagia. J Neuroendocrinol 23: 620–626, 2011. [DOI] [PubMed] [Google Scholar]
- 9.Chanoine JP, De Waele K, Walia P. Ghrelin and the growth hormone secretagogue receptor in growth and development. Int J Obes 33Suppl 1: S48–S52, 2009. [DOI] [PubMed] [Google Scholar]
- 10.Clement L, Cruciani-Guglielmacci C, Magnan C, Vincent M, Douared L, Orosco M, Assimacopoulos-Jeannet F, Penicaud L, Ktorza A. Intracerebroventricular infusion of a triglyceride emulsion leads to both altered insulin secretion and hepatic glucose production in rats. Pflügers Arch 445: 375–380, 2002. [DOI] [PubMed] [Google Scholar]
- 11.Dunn-Meynell AA, Routh VH, Kang L, Gaspers L, Levin BE. Glucokinase is the likely mediator of glucosensing in both glucose excited and glucose inhibited central neurons. Diabetes 51: 2056–2065, 2002. [DOI] [PubMed] [Google Scholar]
- 12.Dunn-Meynell AA, Sanders NM, Compton D, Becker TC, Eiki J, Zhang BB, Levin BE. Relationship among brain and blood glucose levels and spontaneous and glucoprivic feeding. J Neurosci 29: 7015–7022, 2009. [DOI] [PMC free article] [PubMed] [Google Scholar]
- 13.Ferre P, Foufelle F. SREBP-1c transcription factor and lipid homeostasis: clinical perspective. Horm Res 68: 72–82, 2007. [DOI] [PubMed] [Google Scholar]
- 14.Ford ES, Giles WH, Mokdad AH. Increasing prevalence of the metabolic syndrome among us. Adults Diabetes Care 27: 2444–2449, 2004. [DOI] [PubMed] [Google Scholar]
- 15.Glatz JF, Luiken JJ, Bonen A. Involvement of membrane-associated proteins in the acute regulation of cellular fatty acid uptake. J Mol Neurosci 16: 123–132; discussion 151–127, 2001. [DOI] [PubMed] [Google Scholar]
- 16.Gorski J, Levin BE. Effects of cross fostering on body weight, adiposity and insulin sensitivity in selectively bred obesity-prone and resistant rats. Obes Res 12: A103, 2004. [Google Scholar]
- 17.Imagawa A, Hanafusa T, Itoh N, Miyagawa J, Nakajima H, Namba M, Kuwajima M, Tamura S, Kawata S, Matsuzawa Y, Harlan DM. Islet-infiltrating T lymphocytes in insulin-dependent diabetic patients express CD80 (B7–1) and CD86 (B7–2). J Autoimmun 9: 391–396, 1996. [DOI] [PubMed] [Google Scholar]
- 18.Imagawa A, Itoh N, Hanafusa T, Katsura H, Yamaguchi A, Takeda A, Iwahashi H, Nakajima H, Miyagawa J, Namba M, Kuwajima M, Matsuzawa Y. High prevalence of antibodies to glutamic acid decarboxylase compared with islet cell antibodies in patients with long-standing insulin-dependent diabetes mellitus. Res Commun Mol Pathol Pharmacol 92: 43–52, 1996. [PubMed] [Google Scholar]
- 19.Jeha GS, Heptulla RA. Newer therapeutic options for children with diabetes mellitus: theoretical and practical considerations. Pediatr Diabetes 7: 122–138, 2006. [DOI] [PubMed] [Google Scholar]
- 20.Kang L, Dunn-Meynell AA, Routh VH, Gaspers LD, Nagata Y, Nishimura T, Eiki J, Zhang BB, Levin BE. Glucokinase is a critical regulator of ventromedial hypothalamic neuronal glucosensing. Diabetes 55: 412–420, 2006. [DOI] [PubMed] [Google Scholar]
- 21.Kang L, Dunn-Meynell AA, Routh VH, Liu X, Levin BE. Knockdown of GK mRNA with GK RNA interference (RNAi) blocks ventromedial hypothalamic (VMH) neuronal glucosensing. Diabetes 53: A43, 2004. [Google Scholar]
- 22.Kang L, Routh VH, Kuzhikandathil EV, Gaspers L, Levin BE. Physiological and molecular characteristics of rat hypothalamic ventromedial nucleus glucosensing neurons. Diabetes 53: 549–559, 2004. [DOI] [PubMed] [Google Scholar]
- 23.Keinan-Boker L, Noyman N, Chinich A, Green MS, Nitzan-Kaluski D. Overweight and obesity prevalence in Israel: findings of the first national health and nutrition survey (MABAT). Isr Med Assoc J 7: 219–223, 2005. [PubMed] [Google Scholar]
- 24.Koopman R, Schaart G, Hesselink MK. Optimisation of oil red O staining permits combination with immunofluorescence and automated quantification of lipids. Histochem Cell Biol 116: 63–68, 2001. [DOI] [PubMed] [Google Scholar]
- 25.Kraegen EW, Clark PW, Jenkins AB, Daley EA, Chisholm DJ, Storlien LH. Development of muscle insulin resistance after liver insulin resistance in high-fat-fed rats. Diabetes 40: 1397–1403, 1991. [DOI] [PubMed] [Google Scholar]
- 26.Lam TK, Pocai A, Gutierrez-Juarez R, Obici S, Bryan J, Aguilar-Bryan L, Schwartz GJ, Rossetti L. Hypothalamic sensing of circulating fatty acids is required for glucose homeostasis. Nat Med 11: 320–327, 2005. [DOI] [PubMed] [Google Scholar]
- 27.Le Foll C, Dunn-Meynell A, Musatov S, Magnan C, Levin BE. FAT/CD36: a major regulator of neuronal fatty acid sensing and energy homeostasis in rats and mice. Diabetes 62: 2709–2716, 2013. [DOI] [PMC free article] [PubMed] [Google Scholar]
- 28.Le Foll C, Irani BG, Magnan C, Dunn-Meynell AA, Levin BE. Characteristics and mechanisms of hypothalamic neuronal fatty acid sensing. Am J Physiol Regul Integr Comp Physiol 297: R655–R664, 2009. [DOI] [PMC free article] [PubMed] [Google Scholar]
- 29.Le Foll C, Irani BG, Magnan C, Dunn-Meynell AA, Levin BE. Effects of maternal genotype and diet on offspring glucose and fatty acid sensing ventromedial hypothalamic nucleus neurons. Am J Physiol Regul Integr Comp Physiol 297: R1351–R1357, 2009. [DOI] [PMC free article] [PubMed] [Google Scholar]
- 30.Levin BE. Metabolic sensors: viewing glucosensing neurons from a broader perspective. Physiol Behav 76: 397–401, 2002. [DOI] [PubMed] [Google Scholar]
- 31.Levin BE, Becker TC, Eiki J, Zhang BB, Dunn-Meynell AA. Ventromedial hypothalamic glucokinase is an important mediator of the counterregulatory response to insulin-induced hypoglycemia. Diabetes 57: 1371–1379, 2008. [DOI] [PubMed] [Google Scholar]
- 32.Levin BE, Dunn-Meynell AA. Differential effects of exercise on body weight gain and adiposity in obesity-prone and -resistant rats. Int J Obes 30: 722–727, 2006. [DOI] [PubMed] [Google Scholar]
- 33.Levin BE, Dunn-Meynell AA. Reduced central leptin sensitivity in rats with diet-induced obesity. Am J Physiol Regul Integr Comp Physiol 283: R941–R948, 2002. [DOI] [PubMed] [Google Scholar]
- 34.Levin BE, Dunn-Meynell AA, Balkan B, Keesey RE. Selective breeding for diet-induced obesity and resistance in Sprague-Dawley rats. Am J Physiol Regul Integr Comp Physiol 273: R725–R730, 1997. [DOI] [PubMed] [Google Scholar]
- 35.Levin BE, Dunn-Meynell AA, Ricci MR, Cummings DE. Abnormalities of leptin and ghrelin regulation in obesity-prone juvenile rats. Am J Physiol Endocrinol Metab 285: E949–E957, 2003. [DOI] [PubMed] [Google Scholar]
- 36.Levin BE, Govek EK, Dunn-Meynell AA. Reduced glucose-induced neuronal activation in the hypothalamus of diet-induced obese rats. Brain Res 808: 317–319, 1998. [DOI] [PubMed] [Google Scholar]
- 37.Levin BE, Keesey RE. Defense of differing body weight set-points in diet-induced obese and resistant rats. Am J Physiol Regul Integr Comp Physiol 274: R412–R419, 1998. [DOI] [PubMed] [Google Scholar]
- 38.Levin BE, Magnan C, Migrenne S, Chua SC Jr, Dunn-Meynell AA. The F-DIO obesity-prone rat is insulin resistant prior to obesity onset. Am J Physiol Regul Integr Comp Physiol 289: R704–R711, 2005. [DOI] [PubMed] [Google Scholar]
- 39.Levin BE, Strack AM. Diet-induced obesity in animal models and what they tell us about human obesity. In: Neurobiology of Obesity, edited by Harvey J and Withers DJ. Cambridge, MA: Cambridge University Press, 2008, p. 164–195. [Google Scholar]
- 40.Little TJ, Isaacs NJ, Young RL, Ott R, Nguyen NQ, Rayner CK, Horowitz M, Feinle-Bisset C. Characterization of duodenal expression and localization of fatty acid-sensing receptors in humans: relationships with body mass index. Am J Physiol Gastrointest Liver Physiol 307: G958–G967, 2014. [DOI] [PubMed] [Google Scholar]
- 41.Martin C, Chevrot M, Poirier H, Passilly-Degrace P, Niot I, Besnard P. CD36 as a lipid sensor. Physiol Behav 105: 36–42, 2011. [DOI] [PubMed] [Google Scholar]
- 42.Matsuda M, DeFronzo R. Insulin sensitivity indices obtained from oral glucose tolerance testing: comparison with the euglycemic insulin clamp. Diabetes Care 22: 1462–1470, 1999. [DOI] [PubMed] [Google Scholar]
- 43.McLaughlin T, Lamendola C, Liu A, Abbasi F. Preferential fat deposition in subcutaneous versus visceral depots is associated with insulin sensitivity. J Clin Endocrinol Metab 96: E1756–E1760, 2011. [DOI] [PMC free article] [PubMed] [Google Scholar]
- 44.Migrenne S, Cruciani-Guglielmacci C, Kang L, Wang R, Rouch C, Lefevre AL, Ktorza A, Routh VH, Levin BE, Magnan C. Fatty acid signaling in the hypothalamus and the neural control of insulin secretion. Diabetes 55Suppl 2: S139–S144, 2006. [Google Scholar]
- 45.Nguyen NL, Randall J, Banfield BW, Bartness TJ. Central sympathetic innervations to visceral and subcutaneous white adipose tissue. Am J Physiol Regul Integr Comp Physiol 306: R375–R386, 2014. [DOI] [PMC free article] [PubMed] [Google Scholar]
- 46.Obici S, Feng Z, Morgan K, Stein D, Karkanias G, Rossetti L. Central administration of oleic acid inhibits glucose production and food intake. Diabetes 51: 271–275, 2002. [DOI] [PubMed] [Google Scholar]
- 47.Oomura Y, Kimura K, Ooyama H, Maeo T, Iki M, Kuniyoshi N. Reciprocal activities of the ventromedial and lateral hypothalamic area of cats. Science 143: 484–485, 1964. [DOI] [PubMed] [Google Scholar]
- 48.Oomura Y, Nakamura T, Sugimori M, Yamada Y. Effect of free fatty acid on the rat lateral hypothalamic neurons. Physiol Behav 14: 483–486, 1975. [DOI] [PubMed] [Google Scholar]
- 49.Pantel J, Legendre M, Cabrol S, Hilal L, Hajaji Y, Morisset S, Nivot S, Vie-Luton MP, Grouselle D, de Kerdanet M, Kadiri A, Epelbaum J, Le Bouc Y, Amselem S. Loss of constitutive activity of the growth hormone secretagogue receptor in familial short stature. J Clin Invest 116: 760–768, 2006. [DOI] [PMC free article] [PubMed] [Google Scholar]
- 50.Pocai A, Lam TK, Obici S, Gutierrez-Juarez R, Muse ED, Arduini A, Rossetti L. Restoration of hypothalamic lipid sensing normalizes energy and glucose homeostasis in overfed rats. J Clin Invest 116: 1081–1091, 2006. [DOI] [PMC free article] [PubMed] [Google Scholar]
- 51.Ricci MR, Levin BE. Ontogeny of diet-induced obesity in selectively-bred Sprague-Dawley rats. Am J Physiol Regul Integr Comp Physiol 285: R610–R618, 2003. [DOI] [PubMed] [Google Scholar]
- 52.Samuel VT, Liu ZX, Qu X, Elder BD, Bilz S, Befroy D, Romanelli AJ, Shulman GI. Mechanism of hepatic insulin resistance in non-alcoholic fatty liver disease. J Biol Chem 279: 32,345–32,353, 2004. [DOI] [PubMed] [Google Scholar]
- 53.Simpson JL. Genetics of diabetes mellitus (DM) and anomalies in offspring of diabetic mothers. Semin Perinatol 2: 383–394, 1978. [PubMed] [Google Scholar]
- 54.Song Z, Levin BE, McArdle JJ, Bakhos N, Routh VH. Convergence of pre- and postsynaptic influences on glucosensing neurons in the ventromedial hypothalamic nucleus (VMN). Diabetes 50: 2673–2681, 2001. [DOI] [PubMed] [Google Scholar]
- 55.Stunkard AJ, Harris JR, Pedersen NL, McClearn GE. The body-mass index of twins who have been reared apart. N Engl J Med 322: 1483–1487, 1990. [DOI] [PubMed] [Google Scholar]
- 56.Tessari P, Coracina A, Cosma A, Tiengo A. Hepatic lipid metabolism and non-alcoholic fatty liver disease. Nutr Metab Cardiovasc Dis 19: 291–302, 2009. [DOI] [PubMed] [Google Scholar]
- 57.van de Wall E, Leshan R, Xu AW, Balthasar N, Coppari R, Liu SM, Jo YH, MacKenzie RG, Allison DB, Dun NJ, Elmquist J, Lowell BB, Barsh GS, de Luca C, Myers MG Jr, Schwartz GJ, Chua SC Jr. Collective and individual functions of leptin receptor modulated neurons controlling metabolism and ingestion. Endocrinology 149: 1773–1785, 2008. [DOI] [PMC free article] [PubMed] [Google Scholar]
- 58.Van Den Top M, Lee K, Whyment AD, Blanks AM, Spanswick D. Orexigen-sensitive NPY/AgRP pacemaker neurons in the hypothalamic arcuate nucleus. Nat Neurosci 7: 493–494, 2004. [DOI] [PubMed] [Google Scholar]
- 59.Wang R, Liu X, Hentges ST, Dunn-Meynell AA, Levin BE, Wang W, Routh VH. The regulation of glucose-excited neurons in the hypothalamic arcuate nucleus by glucose and feeding-relevant peptides. Diabetes 53: 1959–1965, 2004. [DOI] [PubMed] [Google Scholar]
- 60.Wang Y. Cross-national comparison of childhood obesity: the epidemic and the relationship between obesity and socioeconomic status. Int J Epidemiol 30: 1129–1136, 2001. [DOI] [PubMed] [Google Scholar]
- 61.Weiss PA, Scholz HS, Haas J, Tamussino KF, Seissler J, Borkenstein MH. Long-term follow-up of infants of mothers with type 1 diabetes: evidence for hereditary and nonhereditary transmission of diabetes and precursors. Diabetes Care 23: 905–911, 2000. [DOI] [PubMed] [Google Scholar]
- 62.Willesen MG, Kristensen P, Romer J. Co-localization of growth hormone secretagogue receptor and NPY mRNA in the arcuate nucleus of the rat. Neuroendocrinology 70: 306–316, 1999. [DOI] [PubMed] [Google Scholar]