

Abstract
An elevated vancomycin MIC is associated with poor outcomes in Staphylococcus aureus bacteremia (SAB) and is reported in patients with methicillin-susceptible S. aureus (MSSA) bacteremia in the absence of vancomycin treatment. Here, using DNA microarray and phenotype analysis, we investigated the genetic predictors and accessory gene regulator (agr) function and their relationship with elevated vancomycin MIC using blood culture isolates from a multicenter binational cohort of patients with SAB. Specific clonal complexes were associated with elevated (clonal complex 8 [CC8] [P < 0.001]) or low (CC22 [P < 0.001], CC88 [P < 0.001], and CC188 [P = 0.002]) vancomycin MIC. agr dysfunction (P = 0.014) or agr genotype II (P = 0.043) were also associated with an elevated vancomycin MIC. Specific resistance and virulence genes were also linked to an elevated vancomycin MIC, including blaZ (P = 0.002), sea (P < 0.001), clfA (P < 0.001), splA (P = 0.001), and the arginine catabolic mobile element (ACME) locus (P = 0.02). These data suggest that inherent organism characteristics may explain the link between elevated vancomycin MICs and poor outcomes in patients with SAB, regardless of the antibiotic treatment received. A consideration of clonal specificity should be included in future research when attempting to ascertain treatment effects or clinical outcomes.
INTRODUCTION
Multiple factors have been implicated in patients with poor outcomes from Staphylococcus aureus bacteremia (SAB), including treatment with vancomycin, particularly in methicillin-susceptible S. aureus (MSSA) bacteremia (1–4). Elevated vancomycin MIC has also been associated with treatment failure and mortality in a recent meta-analysis of methicillin-resistant S. aureus (MRSA) infections (5). We previously reported an association between elevated vancomycin MIC and 30-day mortality in patients with SAB (6). Interestingly, this association was observed even in patients with MSSA bacteremia treated with flucloxacillin, a finding also noted by other authors (7); this persisted despite adjustment for potential clinical confounders (8). Preliminary data on a small subset of our original cohort demonstrated a heterogeneity of genotypes among MSSA and methicillin-resistant S. aureus (MRSA) isolates and those with low or elevated vancomycin MICs (6). However, specific organism characteristics, such as resistance or virulence determinants and accessory gene regulator (agr) type or function, are increasingly linked with elevated vancomycin MIC. For example, MRSA strains with staphylococcal cassette chromosome mec element (SCCmec) types II/III typically have higher vancomycin MICs than strains with SCCmec types IV/V (9). agr type II has been associated with reduced vancomycin susceptibility (10), even in MSSA (11), and agr dysfunction has been associated with mortality (12) and other suboptimal outcomes (13). Specific genotypes have also been associated with elevated vancomycin MIC, such as non-CC22/30 clones in a study of MRSA bacteremia (14), or infection syndromes that have increased mortality, such as endocarditis or other invasive disease (14–16). Other organism characteristics, such as the presence of specific enterotoxins and adhesins, have been implicated in invasive infection and may potentially influence clinical outcomes (15).
We therefore performed a detailed microbial genetic characterization on a subset of bacterial isolates from our original cohort in order to identify links between organism factors and elevated vancomycin MIC that may in turn explain the increased mortality observed.
(This study was presented in part at the 15th International Symposium on Staphylococci and Staphylococcal Infections [ISSSI], poster no. P 16-312, Lyon, France, 26 to 30 August 2012 [17].)
MATERIALS AND METHODS
Study population.
The study population was derived from a prospectively collected multicenter cohort of adult and pediatric patients with SAB in Australia and New Zealand, the Australian and New Zealand Cooperative on Outcomes in Staphylococcal Sepsis (ANZCOSS) (4). A substudy was previously created from eight geographically diverse hospitals that contributed to this collaboration, and additional clinical, microbiological, and pharmacological data were collected (6, 8). In brief, basic demographics from the initial cohort and detailed microbiologic testing of stored blood culture isolates (6) were combined with extended clinical data that analyzed detailed comorbidities, comorbidity burden using the Charlson comorbidity index, and disease severity scores using the Acute Physiology and Chronic Health Evaluation (APACHE) II, Simplified Acute Physiology Score (SAPS), and Pitt bacteremia scores (8) measured within 24 h of SAB onset.
Selection of bacterial isolates.
The first (index) positive blood culture isolate from each patient in our original substudy was stored at −80°C, and vancomycin MICs using broth microdilution (BMD) and Etest were performed previously (6). Only isolates collected from patients for whom expanded clinical data were available were considered for inclusion in this analysis. We deliberately selected all blood culture isolates with very low vancomycin Etest MICs (0.38 to 0.75 mg/liter, n = 15) and very high vancomycin Etest MICs (2.0 to 3.0 mg/liter, n = 134) for further characterization. The remaining isolates (n = 93) comprised randomly selected isolates with a vancomycin Etest MIC of 1.0 to 1.5 mg/liter.
Outcome measures.
The primary outcome was vancomycin Etest MIC, categorized into low (≤1.5 mg/liter) or elevated (>1.5 mg/liter) groups, as defined by our previous findings (6). Secondary outcomes included persistent bacteremia (defined as blood cultures positive for S. aureus taken ≥7 days after the index positive blood culture), and recurrent bacteremia (defined as a new episode of SAB after having documented negative blood cultures occurring within 30 days of the index positive blood culture) (18).
Delta-hemolysin assay for agr function.
The S. aureus accessory gene regulator (agr) activity was measured by delta-hemolysin production on Trypticase soy agar with 5% sheep blood using S. aureus strain RN4220, as previously described (13, 19, 20). Evidence of enhanced hemolysis between RN4220 and a test isolate was considered positive for delta-hemolysin production (20). The presence of agr dysfunction was defined as an absence or severe depression of delta-hemolysin production (21). The positive control was JKD6159, a fully sequenced S. aureus reference isolate known to have a functional agr operon, and the negative control was TPS3105, a sequenced S. aureus isolate with defective agr function (22).
DNA microarray.
The isolates were characterized using the StaphyType S. aureus DNA microarray (Alere Technologies, Jena, Germany). This microarray detects 334 target sequences from 185 genes and allelic variants, including resistance determinants and pathogenicity markers, and it infers the genotype according to clonal complex (CC) or sequence type (ST). The microarray was performed as per the manufacturer's instructions, with the arrays and reagents obtained from Alere (11, 23–25).
Genotyping.
A phylogram was constructed with the microarray data using SplitsTree version 4.13.1 (26). The tree was constructed as an unrooted tree without any reference isolates in order to visualize the represented genotypes, and no inference of phylogenetic evolutionary direction was made.
Statistical analysis.
Statistical analyses were performed using Stata version 11.1 (StataCorp, College Station, TX, USA). Categorical variables were compared using the χ2 test or Fisher's exact test, while the Mann-Whitney U test was used for continuous variables. A P value of <0.05 was considered to be statistically significant. Statistical corrections for multiple comparisons were not performed, as this was a hypothesis-generating study to ascertain possible organism characteristics.
Ethics.
Human ethics committee approval was obtained at each participating site.
RESULTS
Clinical characteristics.
Two hundred forty-two isolates were tested, representing almost half (45.5%) of the 532 isolates collected from the original multicenter cohort. The demographics of the tested patient population (Table 1) revealed no statistically significant differences between patients in the low- or elevated-vancomycin MIC groups. There were no differences between the vancomycin MIC group and common clinical manifestations. The proportion of MRSA was overrepresented in the elevated-vancomycin MIC group compared with the low-vancomycin MIC group (52.2% versus 31.5%, P = 0.001).
TABLE 1.
Demographics and clinical features of patients with SAB and microbial characterization of bacterial isolates according to low versus elevated vancomycin MIC
| Variablea | Low MIC (n = 108) | Elevated MIC (n = 134) | P valueb |
|---|---|---|---|
| Demographics | |||
| Age (median [IQR]) (yr) | 64 (44.5–77.5) | 67.5 (50–76) | 0.886 |
| Male sex | 81 (75.0) | 91 (67.9) | 0.227 |
| Caucasian ethnicity | 91 (84.3) | 110 (82.1) | 0.655 |
| Hospital onset | 48 (44.4) | 74 (55.2) | 0.095 |
| Device-associated (no./total evaluablec [%]) | 47/103 (45.6) | 65/129 (50.4) | 0.471 |
| MRSA | 34 (31.5) | 70 (52.2) | 0.001 |
| Vancomycin treatment | 51 (47.2) | 79 (59.0) | 0.069 |
| Relapse (no./total infected [%]) | 8/103 (7.77) | 9/130 (6.9) | 0.806 |
| Persistent bacteremia (no./total evaluablec [%]) | 5/82 (6.1) | 8/115 (7.0) | 0.811 |
| Clinical features | |||
| DNR order (no./total evaluablec [%]) | 34/95 (35.8) | 51/122 (41.8) | 0.368 |
| ICU admission (no./total evaluablec [%]) | 34/107 (31.8) | 40/132 (30.3) | 0.807 |
| Infective endocarditis | 8 (7.4) | 8 (6.0) | 0.655 |
| Sepsis syndrome | 14 (13.0) | 18 (13.4) | 0.915 |
| Pneumonia | 7 (6.5) | 7 (5.2) | 0.677 |
| Osteoarticular | 7 (6.5) | 9 (6.7) | 0.942 |
| Skin and skin structure | 13 (12.0) | 23 (17.2) | 0.265 |
| Disease severity | |||
| APACHE II score (median [IQR]) | 15 (10–19) | 15.5 (11–20) | 0.577 |
| SAPS II score (median [IQR]) | 26 (19–35) | 27 (20–37) | 0.354 |
| Charlson comorbidity index (median [IQR]) | 1 (0–2) | 2 (1–3) | 0.097 |
| Pitt bacteremia score (median [IQR]) | 3 (1–3) | 3 (1–3) | 0.845 |
| Genotype (n)d | |||
| CC8 (69) | 11 (10.2) | 58 (43.3) | <0.001 |
| CC5 (26) | 7 (6.5) | 19 (14.2) | 0.055 |
| CC22 (20) | 20 (18.5) | 0 (0) | <0.001 |
| CC45 (18) | 9 (8.3) | 9 (6.7) | 0.634 |
| CC30 (15) | 8 (7.4) | 7 (5.2) | 0.484 |
| CC1 (14) | 6 (5.6) | 8 (6.0) | 0.891 |
| CC15 (11) | 2 (1.9) | 9 (6.7) | 0.071 |
| CC88 (11) | 11 (10.2) | 0 (0) | <0.001 |
| CC188 (11) | 10 (9.3) | 1 (0.7) | 0.002 |
| agr type (n) | |||
| I (146) | 64 (59.3) | 82 (61.2) | 0.760 |
| II (45) | 14 (13.0) | 31 (23.1) | 0.043 |
| III (48) | 29 (26.9) | 19 (14.2) | 0.014 |
| IV (3) | 1 (0.9) | 2 (1.5) | 0.692 |
| agr dysfunction present | 45 (41.7) | 79 (59.0) | 0.007 |
| Polysaccharide capsule | |||
| cap5 | 42 (38.9) | 27 (20.1) | 0.001 |
| cap8 | 64 (59.3) | 107 (80.0) | <0.001 |
| Antimicrobial resistance gene (antibiotic) | |||
| blaZ (penicillin) | 84 (77.8) | 124 (92.5) | 0.002 |
| ermA (erythromycin) | 10 (9.3) | 63 (47.0) | <0.001 |
| aacA-aphD (gentamicin) | 3 (2.8) | 58 (44.3) | <0.001 |
| mupR (mupirocin) | 0 (0) | 1 (0.8) | 0.368 |
| tetK (tetracycline) | 2 (1.9) | 39 (30.0) | <0.001 |
| fosB (fosfomycin) | 42 (38.9) | 107 (79.9) | <0.001 |
| qacA (quaternary ammonia compounds) | 12 (11.3) | 50 (37.3) | <0.001 |
| Leukocidins or exotoxins | |||
| PVL | 5 (71.4) | 2 (28.6) | 0.148 |
| tst | 7 (46.7) | 8 (53.3) | 0.870 |
| Enterotoxins | |||
| sea | 19 (19.4) | 79 (80.6) | <0.001 |
| seb | 11 (10.9) | 4 (3.0) | 0.015 |
| sec | 23 (21.3) | 2 (1.5) | <0.001 |
| seg | 50 (46.7) | 40 (30.1) | 0.008 |
| Exfoliative toxin etA | 2 (1.9) | 1 (0.8) | 0.435 |
| Adhesion factors | |||
| clfA | 22 (27.9) | 57 (72.2) | <0.001 |
| cna | 63 (41.2) | 90 (58.8) | 0.216 |
| Miscellaneous | |||
| ACME locus | 5 (21.7) | 18 (78.3) | 0.020 |
| sak | 99 (46.1) | 116 (53.9) | 0.210 |
| CHIPS | 61 (57.0) | 46 (43.0) | 0.001 |
| isaB | 68 (54.4) | 57 (45.6) | 0.002 |
| splA | 67 (37.0) | 114 (63.0) | 0.001 |
Data are represented as number (%), unless otherwise indicated. IQR, interquartile range; MRSA, methicillin-resistant S. aureus. DNR, do not resuscitate; ICU, intensive care unit; APACHE, Acute Physiology and Chronic Health Evaluation; SAPS, Simplified Acute Physiology Score; ACME, arginine catabolic mobile element; CHIPS, chemotaxis inhibiting protein of S. aureus.
P values are uncorrected for multiple analyses (as described in Materials and Methods).
“Total evaluable” represents the total number of patients for whom the indicated variable was recorded.
The most common genotypes are recorded. The remaining isolates belonged to CC6 (5), CC7 (2), CC9 (2), CC12 (5), CC20 (6), CC25 (2), CC50 (1), CC59 (3), CC78 (4), CC80 (1), CC93 (3), CC97 (3), CC101 (5), CC361 (2), CC398 (2), unassigned CC on DNA microarray (1; mapped to CC188 on phylogram).
Genotype.
There were 25 different CCs among the 242 isolates. The DNA microarray was unable to assign a CC for one isolate. Greater clonal diversity was noted among the MSSA isolates than with the MRSA isolates (24 versus 10, respectively). Figure 1 shows the unrooted phylogenetic relationship between the isolates. CC8 was the most common genotype (n = 69), followed by CC5 (n = 26), CC22 (n = 20), CC45 (n = 18), and CC30 (n = 15). The isolate with an unassigned CC on the microarray clustered phylogenetically with the CC188 isolates. Two isolates clustered within the livestock-associated S. aureus CC398 (ST398 and ST291). There were differences in the vancomycin MIC groups according to CC (Fig. 2), with seven CCs having a geometric mean vancomycin MIC of >1.5 mg/liter (CC8, CC15, CC6, CC5, CC20, CC45, and CC1). Table 1 also identifies specific clones associated with low (CC22, CC88, and CC188) or elevated vancomycin MICs (CC8 and CC5), and Table 2 shows the vancomycin MIC values for the more common clonal complexes. Clones with higher geometric mean vancomycin MICs also had higher MIC50s and MIC90s (see Fig. S1 in the supplemental material). Notably, CC22 was predominantly composed of ST22-MRSA-IV (known as epidemic MRSA [EMRSA]-15) (19/20) and was exclusively associated with a low vancomycin MIC. CC22 was also negatively associated with persistent bacteremia (P = 0.020). The majority of the isolates within CC8 were ST239-MRSA-III (60/69), an epidemic health care-associated MRSA clone, most of which had elevated vancomycin MIC. These ST239-MRSA-III isolates originated from five different hospitals in diverse geographic regions in Australia and New Zealand. Staphylococcal chromosomal cassette (SCC) mec type II/III was associated with a high vancomycin MIC (P < 0.001) and was exclusively found in the isolates from CC8, whereas SCCmec type IV/V was associated with a low vancomycin MIC (P < 0.001) and predominantly comprised ST22-MRSA-IV isolates. CC8 was associated not only with a high vancomycin MIC (Table 1) but also persistent bacteremia (8/13, P = 0.014), recurrent bacteremia (9/17, P = 0.025), and sepsis syndrome (P = 0.04). CC188, a clone with a low vancomycin MIC, was associated with reduced 30-day mortality (0/72, P = 0.026) and community-onset infections (10/120, P = 0.005) and it comprised MSSA only. There were 11 different clones that caused endocarditis, and no single clone predominated.
FIG 1.

Unrooted phylogram of 242 MSSA and MRSA bacteremia isolates and relationship to vancomycin MIC group, onset of SAB, methicillin susceptibility, and 30-day mortality. CC, clonal complex; ST, sequence type; LA-MSSA, livestock-associated MSSA.
FIG 2.

Vancomycin Etest MIC according to clonal complex. Black circles indicate geometric mean MICs, boxes indicate interquartile range, error bars represent range between 10th and 90th percentiles, colored circles represent values outside the 10th to 90th percentiles, and the dotted line indicates vancomycin Etest MIC of 1.5 mg/liter. The y axis is on a log2 scale. “Other” indicates the remaining clones (n = 21): CC7, CC9, CC25, CC50, CC59, CC80, ST93, CC97, CC361, CC398. CC188 includes one isolate for which a clonal complex was unassigned on microarray but clustered with CC188 on phylogenetic analysis. #, P < 0.001 for comparison of geometric mean MIC for CC8 versus CC22.
TABLE 2.
Vancomycin Etest MICs among the common MSSA and MRSA bacteremia clones in the cohort
| CCa | Vancomycin Etest MIC (mg/liter) |
Total | |||||||
|---|---|---|---|---|---|---|---|---|---|
| Geometric mean | 0.38 | 0.5 | 0.75 | 1 | 1.5 | 2 | 3 | ||
| 8 | 2.04 | 2 | 3 | 6 | 40 | 18 | 69 | ||
| 15 | 1.90 | 2 | 9 | 11 | |||||
| 6 | 1.89 | 1 | 4 | 5 | |||||
| 5 | 1.82 | 1 | 6 | 19 | 26 | ||||
| 20 | 1.70 | 1 | 1 | 4 | 6 | ||||
| 45 | 1.61 | 3 | 6 | 9 | 18 | ||||
| 1 | 1.59 | 1 | 2 | 3 | 8 | 14 | |||
| 30 | 1.51 | 1 | 3 | 4 | 7 | 15 | |||
| 101 | 1.35 | 1 | 2 | 2 | 5 | ||||
| 12 | 1.25 | 3 | 1 | 1 | 5 | ||||
| 88 | 1.12 | 8 | 3 | 11 | |||||
| 188 | 1.01 | 1 | 1 | 7 | 1 | 1 | 11 | ||
| 22 | 0.89 | 1 | 1 | 5 | 11 | 2 | 20 | ||
Clones with ≥5 isolates are represented.
agr dysfunction.
agr dysfunction was detected in more than half of the isolates (124/242 [51.2%]), with high rates in agr type III (34/48 [70.83%], P = 0.002) and lower rates in agr type II (12/45 [26.7%], P < 0.001). Of note, agr dysfunction was more common in the isolates with elevated vancomycin MICs (Table 1, P = 0.007). We also noted that agr dysfunction was present in 55.7% (68/122) of the hospital-onset SAB (P = 0.158) and 65.4% (68/104) of the MRSA (P < 0.001) isolates. Among the commonly encountered clinical presentations, agr dysfunction was associated with pneumonia (12/14, P = 0.008). agr dysfunction was not associated with 30-day mortality (P = 0.662), persistent bacteremia (P = 0.563), or recurrent bacteremia (P = 0.530). agr function according to each clone is represented in Fig. 3, and agr dysfunction was frequently observed in CC8 (50/69, P < 0.001) and CC30 (15/15, P < 0.001). Interestingly, the majority of the CC30 isolates were MSSA (13/15), and agr dysfunction in these isolates was present in both community- and hospital-onset infections.
FIG 3.
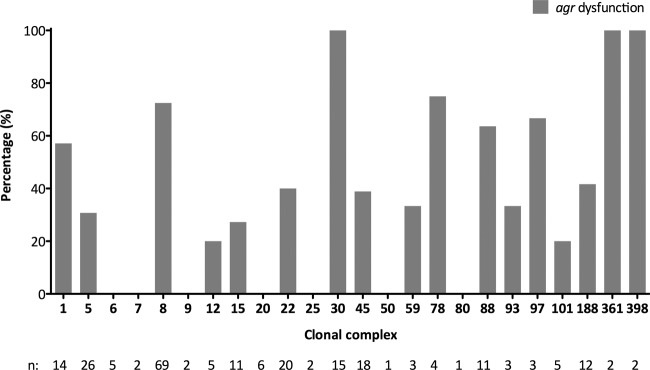
agr dysfunction (as measured by delta-hemolysin assay) according to clonal complex. n, number of isolates from each CC. CC188 includes one isolate for which a clonal complex was unassigned on microarray but clustered with CC188 on phylogenetic analysis.
Virulence determinants.
There was significant heterogeneity of resistance genes, toxin profiles, and other virulence determinants among the isolates. The frequency of genes encoding Panton-Valentine leukocidin (lukF/lukS-PV) and staphylococcal toxic shock syndrome toxin 1 (tst) were low (7/242 and 15/242, respectively). Selected genes within the most common bacteremia clones in our cohort are shown in Table 3, and there were some striking differences between the clones. Capsule type 5 was restricted to CC5 and CC22. These same clones also carried enterotoxin gene cluster (egc) genes (e.g., seg), which were not seen in other dominant clones. CC8 contained multiple antimicrobial resistance genes and adhesion factors frequently compared with other clones, and it accounted for the majority of isolates with the arginine catabolic mobile element (ACME) locus (18/21), as well as all of the isolates containing clumping factor A (clfA). However, compared with the other clones associated with a high vancomycin MIC, hospital-onset bacteremia, or MRSA, CC8 isolates rarely contained the chemotaxis inhibitory protein (CHIPS). There were few resistance genes present among the MSSA and MRSA non-CC8 clones apart from fosB. Although the prevalence of tst was low, it was almost exclusively linked with CC30 (12/15, P < 0.001). The gene encoding enterotoxin A (sea) was common among the isolates with a high vancomycin MIC, such as CC8 (50/69) and CC5 (15/26), and it was completely absent among the isolates with a low vancomycin MIC, such as CC22, CC88, and CC188. Genes encoding exfoliative toxins, such as etA, were present infrequently. agr type II was associated with an elevated vancomycin MIC (Table 1) and was predominantly found in CC5 (26/45) and CC15 (11/45), whereas agr type III was associated with a low vancomycin MIC (Table 1) and was predominantly found in CC1 (14/48) and CC30 (15/48). Although the gene encoding serine protease-like protein A (splA) was found in a range of isolates (Table 3), its presence was associated with elevated vancomycin MIC (Table 1). The virulence determinants according to methicillin susceptibility can be found in Table S1 in the supplemental material, although our focus was on clonal origin and vancomycin MICs, irrespective of methicillin susceptibility, in accordance with the association identified in our original manuscript (6).
TABLE 3.
Comparison of selected genes detected by microarray among the common MSSA and MRSA bacteremia clones in the cohorta
| Variableb | Data by clonal complex: |
Totalc | ||||||||
|---|---|---|---|---|---|---|---|---|---|---|
| 8 | 5 | 22 | 45 | 30 | 1 | 15 | 88 | 188d | ||
| No. (%) | 69 (35.4) | 26 (13.3) | 20 (10.3) | 18 (9.2) | 15 (7.7) | 14 (7.2) | 11 (5.6) | 11 (5.6) | 11 (5.6) | 195 |
| agr type | ||||||||||
| I | 69 (100) | 0 | 20 (100) | 16 (88.9) | 0 | 0 | 0 | 0 | 11 (100) | 116 |
| II | 0 | 26 (100) | 0 | 0 | 0 | 0 | 11 (100) | 0 | 0 | 37 |
| III | 0 | 0 | 0 | 0 | 15 (100) | 14 (100) | 0 | 11 (100) | 0 | 40 |
| IV | 0 | 0 | 0 | 2 (11.1) | 0 | 0 | 0 | 0 | 0 | 2 |
| Polysaccharide capsule | ||||||||||
| cap5 | 8 (11.6) | 26 (100) | 20 (100) | 0 | 0 | 0 | 0 | 0 | 0 | 54 |
| cap8 | 61 (88.4) | 0 | 0 | 17 (94.4) | 15 (100) | 14 (100) | 11 (100) | 11 (100) | 11 (100) | 140 |
| Antimicrobial resistance | ||||||||||
| blaZ | 66 (95.7) | 22 (84.6) | 19 (95) | 14 (77.8) | 15 (100) | 10 (71.4) | 10 (90.9) | 10 (90.9) | 10 (90.9) | 176 |
| mecA | 59 (85.5) | 6 (23.1) | 18 (90) | 6 (33.3) | 2 (13.3) | 4 (28.6) | 0 | 2 (18.2) | 0 | 97 |
| ermA | 61 (88.4) | 0 | 0 | 1 (5.6) | 5 (33.3) | 0 | 0 | 3 (27.3) | 0 | 70 |
| aacC-aphD | 58 (84.1) | 0 | 0 | 0 | 0 | 0 | 0 | 0 | 0 | 58 |
| mupR | 1 (1.4) | 0 | 0 | 0 | 0 | 0 | 0 | 0 | 0 | 1 |
| tetK | 34 (49.3) | 0 | 0 | 5 (27.8) | 0 | 0 | 0 | 0 | 0 | 39 |
| fosB | 69 (100) | 26 (100) | 0 | 0 | 15 (100) | 0 | 11 (100) | 1 (9.1) | 0 | 122 |
| qacA | 48 (69.6) | 3 (11.5) | 0 | 0 | 0 | 1 (7.1) | 0 | 5 (45.5) | 0 | 57 |
| Leukocidins or exotoxins | ||||||||||
| PVL | 0 | 0 | 0 | 0 | 2 (13.3) | 1 (7.1) | 0 | 0 | 1 (9.1) | 4 |
| tst | 1 (1.4) | 2 (7.7) | 0 | 0 | 12 (80) | 0 | 0 | 0 | 0 | 15 |
| Enterotoxins | ||||||||||
| sea | 50 (72.5) | 15 (57.7) | 0 | 0 | 9 (60.0) | 10 (71.4) | 0 | 0 | 0 | 84 |
| seb | 1 (1.4) | 2 (7.7) | 2 (10.0) | 0 | 0 | 1 (7.1) | 0 | 1 (9.1) | 1 (9.1) | 8 |
| sec | 0 | 0 | 14 (70.0) | 5 (27.8) | 1 (6.7) | 0 | 0 | 5 (45.5) | 0 | 25 |
| sege | 2 (2.9) | 26 (100) | 20 (100) | 18 (100) | 14 (93.3) | 0 | 0 | 0 | 0 | 80 |
| Exfoliative toxin etA | 0 | 0 | 0 | 0 | 0 | 0 | 1 (9.1) | 2 (18.2) | 0 | 3 |
| Adhesion factors | ||||||||||
| clfA | 59 (85.5) | 0 | 0 | 0 | 0 | 0 | 0 | 0 | 0 | 59 |
| cna | 61 (88.4) | 0 | 20 (100) | 18 (100) | 14 (93.3) | 14 (100) | 0 | 1 (9.1) | 11 (100) | 139 |
| Miscellaneous | ||||||||||
| ACME locus | 18 (26.1) | 0 | 3 (15.0) | 0 | 0 | 0 | 0 | 0 | 0 | 21 |
| sak | 62 (89.9) | 25 (96.2) | 17 (85.0) | 18 (100) | 15 (100) | 13 (92.9) | 1 (9.1) | 11 (100) | 11 (100) | 173 |
| CHIPS | 4 (5.8) | 17 (65.4) | 17 (85.0) | 18 (100) | 13 (86.7) | 0 | 11 (100) | 0 | 11 (100) | 91 |
| isaB | 8 (11.6) | 26 (100) | 0 | 0 | 1 (6.7) | 14 (100) | 11 (100) | 11 (100) | 11 (100) | 82 |
| splA | 68 (98.6) | 25 (96.2) | 0 | 0 | 0 | 14 (100) | 11 (100) | 11 (100) | 11 (100) | 140 |
| agr dysfunction presentf | 50 (72.5) | 8 (30.8) | 8 (40.0) | 7 (38.9) | 15 (100) | 8 (57.1) | 3 (27.3) | 7 (63.6) | 5 (45.5) | 111 |
MSSA, methicillin-susceptible S. aureus; MRSA, methicillin-resistant S. aureus.
Data are represented as number (%), unless otherwise indicated. PVL, Panton-Valentine leukocidin; ACME, arginine catabolic mobile element; CHIPS, chemotaxis inhibitory protein of S. aureus.
These isolates represent 80.6% of the total tested cohort (195/242 isolates).
This does not include the isolate for which clonal complex was unassigned on microarray but clustered with CC188 on phylogenetic analysis.
Part of enterotoxin gene cluster (egc).
As measured by delta-hemolysin assay.
DISCUSSION
Elevated vancomycin MIC is associated with poor outcomes in MRSA bacteremia (5) and may relate to difficulties in achieving pharmacodynamic targets. However, the association between elevated vancomycin MICs and poor outcome in patients with MSSA bacteremia in the absence of vancomycin therapy (6, 7) is more challenging to explain. In this study, we explored the hypothesis that elevated vancomycin MIC may be a signal of or marker for other intrinsic bacterial characteristics that directly lead to poor patient outcomes in SAB. Our data support this hypothesis. A high vancomycin MIC in S. aureus (MSSA or MRSA) predicts infection with particular S. aureus clones that harbor a specific repertoire of virulence and antibiotic resistance genes, as well as agr genotypes and phenotypes. The combination of these clone-specific features may be critical in determining clinical outcomes irrespective of the vancomycin MIC of the isolate and may explain the observation in high-vancomycin MIC MSSA infections not treated with vancomycin.
Methicillin resistance was strongly linked with elevated vancomycin MICs, as was demonstrated in a recent meta-analysis (5). However, within MRSA isolates, there was clonal variation in vancomycin MICs. MRSA clones with SCCmec type II/III were associated with elevated vancomycin MICs, whereas clones with SCCmec types IV/V had lower vancomycin MICs, similar to the results reported by Jang et al. (9). This is consistent with the high rates of heterogeneous VISA (hVISA) observed in ST239-MRSA-III, whereas hVISA is less frequent in MRSA harboring SCCmec types IV/V (9, 27).
CC8 was strongly associated with elevated vancomycin MICs. It predominantly was found to contain ST239-MRSA-III, a successful multiresistant epidemic health care-associated MRSA clone. Not surprisingly, this clone frequently contained other determinants that may impact vancomycin MIC and mortality, such as the presence of multiple resistance genes or adhesion factors. As our CC8 isolates also comprised community-onset S. aureus isolates distinct from hospital-onset ST239-MRSA-III, this also supports the observations by Miller et al. (28) that CC8 may carry genetic features supporting its persistence in the community as well as in the hospital environment. In contrast, CC22 was associated with low vancomycin MICs and was almost exclusively EMRSA-15, an epidemic health care-associated MRSA clone originally seen in the United Kingdom. Low vancomycin MICs have been reported in CC22 isolates from the United Kingdom, and Hope et al. (29) reported no association between vancomycin Etest MICs and mortality in their MRSA bacteremia cohort. Unlike Miller et al. (14), we found no CC22 isolates with high vancomycin MICs. Despite the common clonal ancestry of these isolates, the clone itself is clearly not the only factor determining vancomycin MIC or clinical outcomes and may suggest an additional effect of geographic adaptation. Interestingly, our CC30 isolates had a much higher median vancomycin MIC than did those from the Miller cohort (14). Importantly, some CCs had elevated vancomycin MICs even though they were predominantly MSSA, for example, CC5, CC6, CC15, and CC20. Different clones have also been associated with invasive disease, e.g., CC30 and CC45 (15, 16), and this potentially explains the differences in clinical outcomes and elevated vancomycin MICs.
We confirmed previous findings that agr type II and agr dysfunction were associated with elevated vancomycin MIC and reduced vancomycin susceptibility (10, 13, 27), and these have also been linked to poor outcomes (12). However, the association between elevated vancomycin MIC and mortality may not necessarily be explained by agr dysfunction alone, as these isolates have been shown to be less virulent in an invertebrate model (30). The different clonal backgrounds of isolates within the same agr type or with agr dysfunction may provide alternative hypotheses. For example, common clones containing agr type II in our cohort were CC5 and CC15; both of these clones exhibited a high geometric mean vancomycin MIC (Table 2) and may possess other characteristics that contribute to virulence and impact vancomycin susceptibility or clinical outcomes. agr dysfunction was prevalent in CC8 and CC30 and was previously reported in other studies (11, 31). Although these are successful endemic MRSA clones (32), agr dysfunction also occurred in the community-onset and MSSA isolates, and this suggests that other features of these genotypes must contribute to reduced vancomycin susceptibility and clinical outcomes. Unlike Chong et al. (31), we did not find a significant proportion of CC5 isolates with agr dysfunction. We were unable to find an association between agr dysfunction and persistent bacteremia, as was previously reported (33); however, this may be due to the low frequency of persistent bacteremia in our cohort (6.6%).
Isolates containing the sea gene were associated with elevated vancomycin MICs, whereas those containing egc were associated with low vancomycin MICs. These findings are similar to those previously reported, in which the presence of the sea gene was associated with the severity of infection (34) or invasive disease (15), and egc was inversely related to septic shock (35). This suggests that reduced vancomycin susceptibility may indeed be a marker of other organism characteristics that are implicated in inferior clinical outcomes, even in patients not receiving vancomycin. tst was almost exclusively associated with the CC30 MSSA isolates, and this was also noted by Blomfeldt et al. (36). Although clfA has been shown to be important in nasal colonization (37) and endocarditis (38), the S. aureus isolates in our cohort containing this gene all belonged to CC8; it is therefore uncertain whether elevated vancomycin MIC is due to clfA itself or other features of this clonal complex. The high frequency of ACME carriage in CC8 ST239-MRSA-III (39) may also explain the association between the ACME locus and elevated vancomycin MIC in our cohort. splA is essential for dissemination after initial colonization (40) and was found in the high-vancomycin MIC genotypes CC8 and CC5; the presence of this gene may be associated with poor clinical outcomes as a result of metastatic infection.
Antimicrobial resistance genes were frequently associated with elevated vancomycin MICs. The high prevalence of blaZ is not unexpected, as S. aureus remains penicillin susceptible in approximately 10% of isolates (4, 41, 42). Although blaZ was statistically associated with elevated vancomycin MICs, this may reflect the higher proportion of MRSA among these isolates. Other antimicrobial resistance genes, such as ermA, aaC-aphD, tetK, and qacA, which were also associated with elevated vancomycin MICs, were found mostly in the CC8 isolates; the association may therefore reflect the underlying clonal background rather than individual resistance determinants such as these. Three MRSA isolates did not have the mecA gene detected by microarray; these isolates were confirmed to be methicillin resistant by susceptibility testing and belonged to typical MRSA clones (ST239-MRSA-III, EMRSA-15, and Panton-Valentine leukocidin [PVL]-positive ST93). We do not know if these isolates lost the mecA cassette or if there is an alternative explanation, and this is currently under further investigation and is beyond the scope of this paper. In a study of this size, it was not practical to test every gene allele for multiple individual clinical conditions due to the large number of variables, so instead, we focused on a smaller number of grouped alleles (as represented by CC or ST type) and the relationship with vancomycin MIC, an important predictor of clinical outcome. The increasing availability of whole-genome sequencing will allow for more detailed analysis of the isolates and may help to identify features of specific clones that lead to an elevated vancomycin MIC. Significant heterogeneity exists, even within a clonal complex, in organism factors, such as resistance genes and virulence determinants. It is difficult to ascertain if different genetic or organism factors directly influence vancomycin MIC, or if an elevated vancomycin MIC is a consequence of various virulence factors that allow subsequent antibiotic selection pressure. We believe that an elevated vancomycin MIC may be a proxy for organism factors that may explain our previous association between elevated vancomycin MICs and mortality in patients with SAB. This is particularly relevant, as it highlights the importance of bacterial factors and potential host-pathogen interactions in determining clinical outcomes, and it may also explain the results seen in patients with MSSA bacteremia treated with flucloxacillin. Future clinical trials and research may require considerations of the clonal origin of S. aureus isolates, especially when trying to establish the magnitude of treatment effect or assess clinical outcomes.
Supplementary Material
ACKNOWLEDGMENTS
We acknowledge Shi Yi Goo (medical student at Princess Alexandra Hospital) for assistance in reviewing patient charts at the hospital.
J.D.T. has received financial support from Pfizer Australia, Astra Zeneca Australia, and Novartis Australia. W.J.M. has received financial support to attend the “Susceptibility and resistance: selecting appropriate therapy for serious Gram-positive infections” educational seminar sponsored by Novartis Australia.
N.E.H., J.O.R., T.M.K., M.V.N.O., T.L.A., S.A.R., S.J.C.W., G.W.C., H.-L.T., W.G., P.D.R.J., and B.P.H. have nothing to declare.
This work was supported by the Australian Society for Antimicrobials for microbiological testing of the isolates. N.E.H. is supported by a National Health and Medical Research Council Postgraduate Scholarship. B.P.H is supported by a National Health and Medical Research Council Career Development Fellowship.
Footnotes
Published ahead of print 16 July 2014
Supplemental material for this article may be found at http://dx.doi.org/10.1128/JCM.01320-14.
REFERENCES
- 1.Chang FY, Peacock JE, Jr, Musher DM, Triplett P, MacDonald BB, Mylotte JM, O'Donnell A, Wagener MM, Yu VL. 2003. Staphylococcus aureus bacteremia: recurrence and the impact of antibiotic treatment in a prospective multicenter study. Medicine (Baltimore) 82:333–339. 10.1097/01.md.0000091184.93122.09. [DOI] [PubMed] [Google Scholar]
- 2.Khatib R, Johnson LB, Fakih MG, Riederer K, Khosrovaneh A, Shamse Tabriz M, Sharma M, Saeed S. 2006. Persistence in Staphylococcus aureus bacteremia: incidence, characteristics of patients and outcome. Scand. J. Infect. Dis. 38:7–14. 10.1080/00365540500372846. [DOI] [PubMed] [Google Scholar]
- 3.Stryjewski ME, Szczech LA, Benjamin DK, Jr, Inrig JK, Kanafani ZA, Engemann JJ, Chu VH, Joyce MJ, Reller LB, Corey GR, Fowler VG., Jr 2007. Use of vancomycin or first-generation cephalosporins for the treatment of hemodialysis-dependent patients with methicillin-susceptible Staphylococcus aureus bacteremia. Clin. Infect. Dis. 44:190–196. 10.1086/510386. [DOI] [PubMed] [Google Scholar]
- 4.Turnidge JD, Kotsanas D, Munckhof W, Roberts S, Bennett CM, Nimmo GR, Coombs GW, Murray RJ, Howden B, Johnson PD, Dowling K, Australia New Zealand Cooperative on Outcomes in Staphylococcal Sepsis 2009. Staphylococcus aureus bacteraemia: a major cause of mortality in Australia and New Zealand. Med. J. Aust. 191:368–373. [DOI] [PubMed] [Google Scholar]
- 5.van Hal SJ, Lodise TP, Paterson DL. 2012. The clinical significance of vancomycin minimum inhibitory concentration in Staphylococcus aureus infections: a systematic review and meta-analysis. Clin. Infect. Dis. 54:755–771. 10.1093/cid/cir935. [DOI] [PubMed] [Google Scholar]
- 6.Holmes NE, Turnidge JD, Munckhof WJ, Robinson JO, Korman TM, O'Sullivan MV, Anderson TL, Roberts SA, Gao W, Christiansen KJ, Coombs GW, Johnson PD, Howden BP. 2011. Antibiotic choice may not explain poorer outcomes in patients with Staphylococcus aureus bacteremia and high vancomycin minimum inhibitory concentrations. J. Infect. Dis. 204:340–347. 10.1093/infdis/jir270. [DOI] [PubMed] [Google Scholar]
- 7.Aguado JM, San-Juan R, Lalueza A, Sanz F, Rodríguez-Otero J, Gómez-Gonzalez C, Chaves F. 2011. High vancomycin MIC and complicated methicillin-susceptible Staphylococcus aureus bacteremia. Emerg. Infect. Dis. 17:1099–1102. 10.3201/eid/1706.101037. [DOI] [PMC free article] [PubMed] [Google Scholar]
- 8.Holmes NE, Turnidge JD, Munckhof WJ, Robinson JO, Korman TM, O'Sullivan MV, Anderson TL, Roberts SA, Warren SJ, Gao W, Johnson PD, Howden BP. 2013. Vancomycin minimum inhibitory concentration, host comorbidities and mortality in Staphylococcus aureus bacteraemia. Clin. Microbiol. Infect. 19:1163–1168. 10.1111/1469-0691.12168. [DOI] [PubMed] [Google Scholar]
- 9.Jang HC, Kang SJ, Choi SM, Park KH, Shin JH, Choy HE, Jung SI, Kim HB. 2012. Difference in agr dysfunction and reduced vancomycin susceptibility between MRSA bacteremia involving SCCmec types IV/IVa and I–III. PLoS One 7:e49136. 10.1371/journal.pone.0049136. [DOI] [PMC free article] [PubMed] [Google Scholar]
- 10.Moise PA, Smyth DS, Robinson DA, El-Fawal N, McCalla C, Sakoulas G. 2009. Genotypic and phenotypic relationships among methicillin-resistant Staphylococcus aureus from three multicentre bacteraemia studies. J. Antimicrob. Chemother. 63:873–876. 10.1093/jac/dkp047. [DOI] [PMC free article] [PubMed] [Google Scholar]
- 11.Viedma E, Sanz F, Orellana MA, San Juan R, Aguado JM, Otero JR, Chaves F. 2014. Relationship between agr dysfunction and reduced vancomycin susceptibility in methicillin-susceptible Staphylococcus aureus causing bacteraemia. J. Antimicrob. Chemother. 69:51–58. 10.1093/jac/dkt337. [DOI] [PubMed] [Google Scholar]
- 12.Schweizer ML, Furuno JP, Sakoulas G, Johnson JK, Harris AD, Shardell MD, McGregor JC, Thom KA, Perencevich EN. 2011. Increased mortality with accessory gene regulator (agr) dysfunction in Staphylococcus aureus among bacteremic patients. Antimicrob. Agents Chemother. 55:1082–1087. 10.1128/AAC.00918-10. [DOI] [PMC free article] [PubMed] [Google Scholar]
- 13.Sakoulas G, Eliopoulos GM, Moellering RC, Jr, Wennersten C, Venkataraman L, Novick RP, Gold HS. 2002. Accessory gene regulator (agr) locus in geographically diverse Staphylococcus aureus isolates with reduced susceptibility to vancomycin. Antimicrob. Agents Chemother. 46:1492–1502. 10.1128/AAC.46.5.1492-1502.2002. [DOI] [PMC free article] [PubMed] [Google Scholar]
- 14.Miller CE, Batra R, Cooper BS, Patel AK, Klein J, Otter JA, Kypraios T, French GL, Tosas O, Edgeworth JD. 2012. An association between bacterial genotype combined with a high-vancomycin minimum inhibitory concentration and risk of endocarditis in methicillin-resistant Staphylococcus aureus bloodstream infection. Clin. Infect. Dis. 54:591–600. 10.1093/cid/cir858. [DOI] [PMC free article] [PubMed] [Google Scholar]
- 15.Nienaber JJ, Sharma Kuinkel BK, Clarke-Pearson M, Lamlertthon S, Park L, Rude TH, Barriere S, Woods CW, Chu VH, Marín M, Bukovski S, Garcia P, Corey GR, Korman T, Doco-Lecompte T, Murdoch DR, Reller LB, Fowler VG, Jr, International Collaboration on Endocarditis-Microbiology Investigators 2011. Methicillin-susceptible Staphylococcus aureus endocarditis isolates are associated with clonal complex 30 genotype and a distinct repertoire of enterotoxins and adhesins. J. Infect. Dis. 204:704–713. 10.1093/infdis/jir389. [DOI] [PMC free article] [PubMed] [Google Scholar]
- 16.Wertheim HF, van Leeuwen WB, Snijders S, Vos MC, Voss A, Vandenbroucke-Grauls CM, Kluytmans JA, Verbrugh HA, van Belkum A. 2005. Associations between Staphylococcus aureus genotype, infection, and in-hospital mortality: a nested case-control study. J. Infect. Dis. 192:1196–1200. 10.1086/444427. [DOI] [PubMed] [Google Scholar]
- 17.Holmes NE, Turnidge JD, Munckhof WJ, Robinson JO, Korman TM, O'Sullivan MVN, Anderson TL, Roberts SA, Coombs GW, Gao W, Johnson PDR, Howden BP. 2012. Organism factors associated with elevated vancomycin minimum inhibitory concentration (MIC) in Staphylococcus aureus bacteraemia. 15th International Symposium on Staphylococci and Staphylococcal Infections (ISSSI), poster no. P 16–312 Lyon, France, 26 to 30 August 2012. [Google Scholar]
- 18.Holmes NE, Turnidge JD, Munckhof WJ, Robinson JO, Korman TM, O'Sullivan MV, Anderson TL, Roberts SA, Warren SJ, Gao W, Howden BP, Johnson PD. 2013. Vancomycin AUC/MIC ratio and 30-day mortality in patients with Staphylococcus aureus bacteremia. Antimicrob. Agents Chemother. 57:1654–1653. 10.1128/AAC.01485-12. [DOI] [PMC free article] [PubMed] [Google Scholar]
- 19.Sakoulas G, Moellering RC, Jr, Eliopoulos GM. 2006. Adaptation of methicillin-resistant Staphylococcus aureus in the face of vancomycin therapy. Clin. Infect. Dis. 42(Suppl 1):S40–S50. 10.1086/491713. [DOI] [PubMed] [Google Scholar]
- 20.Traber KE, Lee E, Benson S, Corrigan R, Cantera M, Shopsin B, Novick RP. 2008. agr function in clinical Staphylococcus aureus isolates. Microbiology 154(Pt 8):2265–2274. 10.1099/mic.0.2007/011874-0. [DOI] [PMC free article] [PubMed] [Google Scholar]
- 21.Butterfield JM, Tsuji BT, Brown J, Ashley ED, Hardy D, Brown K, Forrest A, Lodise TP. 2011. Predictors of agr dysfunction in methicillin-resistant Staphylococcus aureus (MRSA) isolates among patients with MRSA bloodstream infections. Antimicrob. Agents Chemother. 55:5433–5437. 10.1128/AAC.00407-11. [DOI] [PMC free article] [PubMed] [Google Scholar]
- 22.Chua KYL, Monk IR, Lin YH, Seemann T, Tuck KL, Porter JL, Stepnell J, Coombs GW, Davies JK, Stinear TP, Howden BP. 2014. Hyperexpression of α-hemolysin explains enhanced virulence of sequence type 93 community-associated methicillin-resistant Staphylococcus aureus. BMC Microbiol. 14:31. 10.1186/1471-2180-14-31. [DOI] [PMC free article] [PubMed] [Google Scholar]
- 23.Monecke S, Slickers P, Ehricht R. 2008. Assignment of Staphylococcus aureus isolates to clonal complexes based on microarray analysis and pattern recognition. FEMS Immunol. Med. Microbiol. 53:237–251. 10.1111/j.1574-695X.2008.00426.x. [DOI] [PubMed] [Google Scholar]
- 24.Monecke S, Jatzwauk L, Weber S, Slickers P, Ehricht R. 2008. DNA microarray-based genotyping of methicillin-resistant Staphylococcus aureus strains from Eastern Saxony. Clin. Microbiol. Infect. 14:534–545. 10.1111/j.1469-0691.2008.01986.x. [DOI] [PubMed] [Google Scholar]
- 25.Nethercott C, Mabbett AN, Totsika M, Peters P, Ortiz JC, Nimmo GR, Coombs GW, Walker MJ, Schembri MA. 2013. Molecular characterization of endocarditis-associated Staphylococcus aureus. J. Clin. Microbiol. 51:2131–2138. 10.1128/JCM.00651-13. [DOI] [PMC free article] [PubMed] [Google Scholar]
- 26.Coombs GW, Monecke S, Ehricht R, Slickers P, Pearson JC, Tan HL, Christiansen KJ, O'Brien FG. 2010. Differentiation of clonal complex 59 community-associated methicillin-resistant Staphylococcus aureus in Western Australia. Antimicrob. Agents Chemother. 54:1914–1921. 10.1128/AAC.01287-09. [DOI] [PMC free article] [PubMed] [Google Scholar]
- 27.Howden BP, Davies JK, Johnson PDR, Stinear TP, Grayson ML. 2010. Reduced vancomycin susceptibility in Staphylococcus aureus, including vancomycin-intermediate and heterogeneous vancomycin-intermediate strains: resistance mechanisms, laboratory detection, and clinical implications. Clin. Microbiol. Rev. 23:99–139. 10.1128/CMR.00042-09. [DOI] [PMC free article] [PubMed] [Google Scholar]
- 28.Miller LG, Perdreau-Remington F, Bayer AS, Diep B, Tan N, Bharadwa K, Tsui J, Perlroth J, Shay A, Tagudar G, Ibebuogu U, Spellberg B. 2007. Clinical and epidemiologic characteristics cannot distinguish community-associated methicillin-resistant Staphylococcus aureus infection from methicillin-susceptible S. aureus infection: a prospective investigation. Clin. Infect. Dis. 44:471–482. 10.1086/511033. [DOI] [PubMed] [Google Scholar]
- 29.Hope R, Blackburn RM, Verlander NQ, Johnson AP, Kearns A, Hill R, Hopkins S, Sheridan E, Livermore DM, Vancomycin Outcome Study Group; UK Clinical Infection Research Group 2013. Vancomycin MIC as a predictor of outcome in MRSA bacteraemia in the UK context. J. Antimicrob. Chemother. 68:2641–2647. 10.1093/jac/dkt234. [DOI] [PubMed] [Google Scholar]
- 30.Peleg AY, Monga D, Pillai S, Mylonakis E, Moellering RC, Jr, Eliopoulos GM. 2009. Reduced susceptibility to vancomycin influences pathogenicity in Staphylococcus aureus infection. J. Infect. Dis. 199:532–536. 10.1086/596511. [DOI] [PMC free article] [PubMed] [Google Scholar]
- 31.Chong YP, Kim ES, Park SJ, Park KH, Kim T, Kim MN, Kim SH, Lee SO, Choi SH, Woo JH, Jeong JY, Kim YS. 2013. Accessory gene regulator (agr) dysfunction in Staphylococcus aureus bloodstream isolates from South Korean patients. Antimicrob. Agents Chemother. 57:1509–1512. 10.1128/AAC.01260-12. [DOI] [PMC free article] [PubMed] [Google Scholar]
- 32.Enright MC, Robinson DA, Randle G, Feil EJ, Grundmann H, Spratt BG. 2002. The evolutionary history of methicillin-resistant Staphylococcus aureus (MRSA). Proc. Natl. Acad. Sci. U. S. A. 99:7687–7692. 10.1073/pnas.122108599. [DOI] [PMC free article] [PubMed] [Google Scholar]
- 33.Fowler VG, Jr, Sakoulas G, McIntyre LM, Meka VG, Arbeit RD, Cabell CH, Stryjewski ME, Eliopoulos GM, Reller LB, Corey GR, Jones T, Lucindo N, Yeaman MR, Bayer AS. 2004. Persistent bacteremia due to methicillin-resistant Staphylococcus aureus infection is associated with agr dysfunction and low-level in vitro resistance to thrombin-induced platelet microbicidal protein. J. Infect. Dis. 190:1140–1149. 10.1086/423145. [DOI] [PubMed] [Google Scholar]
- 34.Ferry T, Thomas D, Genestier AL, Bes M, Lina G, Vandenesch F, Etienne J. 2005. Comparative prevalence of superantigen genes in Staphylococcus aureus isolates causing sepsis with and without septic shock. Clin. Infect. Dis. 41:771–777. 10.1086/432798. [DOI] [PubMed] [Google Scholar]
- 35.Tristan A, Ferry T, Durand G, Dauwalder O, Bes M, Lina G, Vandenesch F, Etienne J. 2007. Virulence determinants in community and hospital meticillin-resistant Staphylococcus aureus. J. Hosp. Infect. 65(Suppl 2):S105–S109. 10.1016/S0195-6701(07)60025-5. [DOI] [PubMed] [Google Scholar]
- 36.Blomfeldt A, Aamot HV, Eskesen AN, Müller F, Monecke S. 2013. Molecular characterization of methicillin-sensitive Staphylococcus aureus isolates from bacteremic patients in a Norwegian University Hospital. J. Clin. Microbiol. 51:345–347. 10.1128/JCM.02571-12. [DOI] [PMC free article] [PubMed] [Google Scholar]
- 37.Wertheim HF, Walsh E, Choudhurry R, Melles DC, Boelens HAM, Miajlovic H, Verbrugh HA, Foster T, van Belkum A. 2008. Key role for clumping factor B in Staphylococcus aureus nasal colonization of humans. PLoS Med. 5:e17. 10.1371/journal.pmed.0050017. [DOI] [PMC free article] [PubMed] [Google Scholar]
- 38.Piroth L, Que YA, Widmer E, Panchaud A, Piu S, Entenza JM, Moreillon P. 2008. The fibrinogen- and fibronectin-binding domains of Staphylococcus aureus fibronectin-binding protein A synergistically promote endothelial invasion and experimental endocarditis. Infect. Immun. 76:3824–3831. 10.1128/IAI.00405-08. [DOI] [PMC free article] [PubMed] [Google Scholar]
- 39.Espedido BA, Steen JA, Barbagiannakos T, Mercer J, Paterson DL, Grimmond SM, Cooper MA, Gosbell IB, van Hal SJ, Jensen SO. 2012. Carriage of an ACME II variant may have contributed to methicillin-resistant Staphylococcus aureus sequence type 239-like strain replacement in Liverpool Hospital, Sydney, Australia. Antimicrob. Agents Chemother. 56:3380–3383. 10.1128/AAC.00013-12. [DOI] [PMC free article] [PubMed] [Google Scholar]
- 40.Stec-Niemczyk J, Pustelny K, Kisielewska M, Bista M, Boulware KT, Stennicke HR, Thogersen IB, Daugherty PS, Enghild JJ, Baczynski K, Popowicz GM, Dubin A, Potempa J, Dubin G. 2009. Structural and functional characterization of SplA, an exclusively specific protease of Staphylococcus aureus. Biochem. J. 419:555–564. 10.1042/BJ20081351. [DOI] [PubMed] [Google Scholar]
- 41.Nimmo GR, Bell JM, Mitchell D, Gosbell IB, Pearman JW, Turnidge JD, AGAR 2003. Antimicrobial resistance in Staphylococcus aureus in Australian teaching hospitals, 1989–1999. Microb. Drug Resist. 9:155–160. 10.1089/107662903765826741. [DOI] [PubMed] [Google Scholar]
- 42.Nissen JL, Skov R, Knudsen JD, Ostergaard C, Schønheyder HC, Frimodt-Møller N, Benfield T. 2013. Effectiveness of penicillin, dicloxacillin and cefuroxime for penicillin-susceptible Staphylococcus aureus bacteraemia: a retrospective, propensity-score-adjusted case-control and cohort analysis. J. Antimicrob. Chemother. 68:1894–1900. 10.1093/jac/dkt108. [DOI] [PubMed] [Google Scholar]
Associated Data
This section collects any data citations, data availability statements, or supplementary materials included in this article.