

Abstract
Antibiotic resistance in Gram-negative microorganisms is an increasing health care problem. The rapid detection of such resistance is crucial for starting an early specific therapy and to enable initiation of the required hygiene measures. With continued emphasis on reducing the cost of laboratory testing, only economical/low-cost approaches have a chance of being implemented. During recent years, matrix-assisted laser desorption ionization–time of flight mass spectrometry (MALDI-TOF MS) has been developed to be a standard method in microbiology laboratories for the rapid and cost-efficient identification of microorganisms. Extending the usage of MALDI-TOF MS in the clinical microbiology laboratory to the area of resistance testing is an attractive option. Quantitative MALDI-TOF MS using an internal standard facilitates the measurement of the quantity of peptides and small proteins within a spectrum. These quantities correlate to the number of microorganisms and therefore to the growth of a microorganism. The comparison of growth in the presence or absence of an antibiotic allows for analysis of the susceptibility behavior of a strain. Here, we describe a novel method and its application in the analysis of 108 Klebsiella sp. isolates. After 1 h of incubation at a meropenem concentration of 8 μg/ml, a sensitivity of 97.3% and a specificity of 93.5% were achieved (compared to Etest results).
INTRODUCTION
The increasing number of Gram-negative bacteria with resistance to multiple antibiotics is an increasing health care problem (1). Fast and economical approaches are required to detect resistant microorganisms and to introduce suitable measures for therapy and infection control. Established routine methods such as Etest or disk diffusion assays require 18 to 24 h before a result can be obtained. With automated analysis systems, such as Phoenix (BD Diagnostic Systems, Heidelberg, Germany), MicroScan (Siemens Healthcare Diagnostics GmbH, Eschborn, Germany), or Vitek 2 (bioMérieux, Nürtingen, Germany), results are available after approximately 5 h for fast-growing bacteria (2). Molecular biology methods, such as PCR, are fast but provide only genetic information on the presence or absence of a resistance-related gene, which is not always directly mirrored by the phenotype. Additionally, novel resistance mechanisms may be overlooked, and DNA-based methods are expensive, a fact that restricts their general use (3).
Matrix-assisted laser desorption ionization–time of flight mass spectrometry (MALDI-TOF MS) has become an established tool for the rapid identification of microorganisms in microbiology laboratories (4–6). The comparison of a profile spectrum acquired from a microorganism to profile signatures stored in a reference library enables quick and reliable species determination. Additionally, initial promising approaches have been developed for performing antibiotic resistance detection by MALDI-TOF MS (7). Generally, these approaches significantly accelerate the time it takes to detect resistance compared to that of the established methods. The mass spectrometric β-lactamase (MSBL) assay is widely used by numerous research groups to analyze bacterially induced hydrolysis of β-lactam antibiotics (8–10). In most cases, hydrolysis results are available for analysis after 1 to 3 h. Despite the limitation that alternative resistance mechanisms might conceal β-lactamase activity, this assay may be a rapid and cost-efficient tool for hygiene monitoring and for the analysis of species that rarely exhibit alternative resistance mechanisms (11). Recently, a MALDI-TOF MS-based assay which overcomes the problem of alternative resistance mechanisms was published (12, 13). The MBT-RESIST (resistance test with stable isotope-labeled amino acids) assay employs stable (nonradioactive) isotopes that are incorporated into newly synthesized proteins. With this method, culture medium without the respective amino acids is supplemented with either the “normal” or the corresponding “heavy” amino acid. The amount of labeled amino acid incorporated into newly synthesized proteins in the presence of an antibiotic is used to decide whether a strain is susceptible or resistant. This assay has been successfully used for detecting methicillin-resistant Staphylococcus aureus (MRSA) using oxacillin and cefoxitin as the antibiotics (12). In further studies, the resistance behaviors of Pseudomonas aeruginosa isolates against ciprofloxacin, meropenem, and tobramycin have been successfully tested (13). A limitation of this approach is the requirement for a preconfigured culture medium without the respective amino acid that is used as a heavy marker.
Here, we present a novel approach, the MALDI Biotyper antibiotic susceptibility test rapid assay (MBT-ASTRA), which does not use stable amino acids but, rather, quantitative MALDI-TOF MS. As with the MBT-RESIST assay, bacteria are incubated in culture medium in the presence or absence of antibiotics. In contrast to the MBT-RESIST assay, a culture medium most suitable for the respective species can be used. After an adequate short incubation to facilitate cell proliferation, cells are lysed and spiked with an internal standard to facilitate the quantitative comparison of the acquired mass spectra. After normalization of the spectra to the highest peak, the peak intensities correlate to the amounts of bacterial peptides, which in turn correlate to bacterial growth. Comparison of spectra derived from identical bacterial isolates cultured in the presence or absence of an antibiotic enables the evaluation of resistance status by comparing growth rates.
This novel MALDI-TOF MS-based resistance test is described here, and its applicability to the detection of resistance of Klebsiella species against meropenem is demonstrated. Additionally, an algorithm that facilitates the automated analysis of large data sets is described.
MATERIALS AND METHODS
Bacterial strains and cultivation.
Clinical isolates of Klebsiella pneumoniae and Klebsiella oxytoca from 12 different institutions and six different countries were used in this study. The respective origins are listed in Table S2 in the supplemental material; the results of molecular characterizations of the resistant strains are summarized Table S1 in the supplemental material. Bacteria were cultivated without selective agents on Columbia blood agar plates (BD, Germany) overnight at 37°C. Fresh overnight cultures were used for the tests.
Routine resistance assay.
The MIC of meropenem was determined by Etest. Briefly, MIC test strips (Liofilchem, Italy) were placed on 85-mm Mueller-Hinton agar plates (BD Diagnostics Systems) that had been inoculated with a 0.5 McFarland standard suspension of test isolates. All the plates were incubated at 37°C for 20 to 24 h before being examined. The MIC was determined to be the value at which the elliptical growth margin intersected the MIC test strip. The determination of resistance was made according to the current EUCAST guideline for Enterobacteriaceae (clinical breakpoints for bacteria [v 4.0]: susceptible, ≤2 μg/ml; resistant, >8 μg/ml [http://www.eucast.org/fileadmin/src/media/PDFs/EUCAST_files/Breakpoint_tables/Breakpoint_table_v_4.0.pdf]).
MALDI-TOF MS quantitative resistance profiling assay.
For determining the optimal incubation time, fresh bacterial isolates were incubated in brain-heart infusion (BHI) medium (Heipha, Germany) at a cell density of 0.5 McFarland standard. For each strain, two different 200-μl setups containing no antibiotics and 64 μg/ml meropenem (Sigma-Aldrich, Germany) were prepared. The preparations were incubated at 37°C in ambient air under agitation in a ThermoMixer (Eppendorf, Germany) for 1, 2, and 3 h. After incubation, cells were centrifuged and washed once with 150 μl pure water and once with 100 μl 70% ethanol. Subsequently, bacteria were lysed according to the MALDI Biotyper standard protocol (14) with 10 μl 70% formic acid and 10 μl 100% acetonitrile containing RNase B (4 × 10⁻³ g/liter; Sigma-Aldrich, Germany) as an internal standard.
For titration of the breakpoint concentration, fresh bacterial isolates were incubated for 1 h without or with meropenem at concentrations ranging from 0.025 to 32 μg/ml. Further processing was performed according to the procedure described above. For the analysis of clinical isolates, each strain was incubated for 1 h in the absence or presence of meropenem (8 μg/ml) and processed as described above.
For the analysis of samples derived from blood cultures, blood culture bottles (BD Bactec Plus Aerobic/F; Becton Dickinson, Germany) were inoculated with 10 ml of whole blood and the respective Klebsiella pneumoniae strain. Incubation was performed in a Bactec automated blood culture instrument (Becton Dickinson, Heidelberg, Germany) until the culture was flagged as positive. A 0.5-ml sample of blood culture fluid was taken from each culture bottle with a syringe, cells were isolated by centrifugation (12,000 × g for 2 min), and the pellet was directly resuspended in 400 μl BHI medium. Then, 200 μl of this suspension was incubated without meropenem, and 200 μl was incubated in the presence of 8 μg/ml meropenem for 1 h at 37°C under agitation. After incubation, the remaining blood cells were removed using the MALDI Sepsityper kit (Bruker Daltonik GmbH, Germany). Briefly, 40 μl of lysis buffer was directly added to the incubation setups. After centrifugation (12,000 × g for 1 min), the cells were washed once with washing solution. Subsequently, bacterial cell lysis was performed as described above.
MALDI-TOF MS analysis.
One microliter of the cell lysates was directly spotted onto a polished steel MALDI target plate. Each lysate was spotted 4 times. Dried spots were overlaid with MALDI matrix (10 mg/ml of α-cyano-4-hydroxy-cinnamic acid [α-HCCA] in 50% acetonitrile–2.5% trifluoroacetic acid; Bruker Daltonik, Bremen, Germany). After drying of the matrix, MALDI-TOF MS measurements were performed with a Microflex LT/SH bench-top mass spectrometer (Bruker Daltonik GmbH) equipped with a 60-Hz nitrogen laser. The parameter settings were optimized for a mass range between 2,000 and 20,000 Da (parameter settings: ion source 1 [IS1], 20 kV; IS2, 17.5 kV; lens, 6.5 kV; detector gain, 7.4 V; and gating, none). Spectra were recorded in the positive linear mode with the maximum laser frequency. An external calibration standard (bacterial test standard [BTS]; Bruker Daltonik GmbH) was used for instrument calibration.
Data evaluation.
Pseudogel view representations were performed with the gel view display of the MALDI Biotyper 3.1 software (Bruker Daltonik GmbH, Germany). Automated analyses of the spectra were performed with a prototype software tool written with the freely available software package R (15, 16). First, spectra were baseline subtracted and normalized to the maximum peak. The relative intensity range between 0 and 1 was subdivided into 100 equally spaced thresholds (Δ = 0.01). Peak picking was performed, and the total number of peaks above each threshold was counted. The resulting numbers of peaks were normalized and plotted against the relative intensity threshold. The area under the resulting concentration-time (AUC) curve was determined for each spectrum. Subsequently, the relative growth (RG) was calculated as the ratio of the AUCs of identical samples incubated with and without meropenem: relative growth = AUCBHI + meropenem/AUCBHI.
The relative growth was calculated for each combination of spectra obtained from the samples incubated with and without the antibiotic. This means that for each of the four measurements belonging to one setup, the AUCs and the ratios for each combination of BHI and BHI-meropenem were calculated. The resulting 16 values are displayed in a box plot diagram (see Fig. 2).
FIG 2.
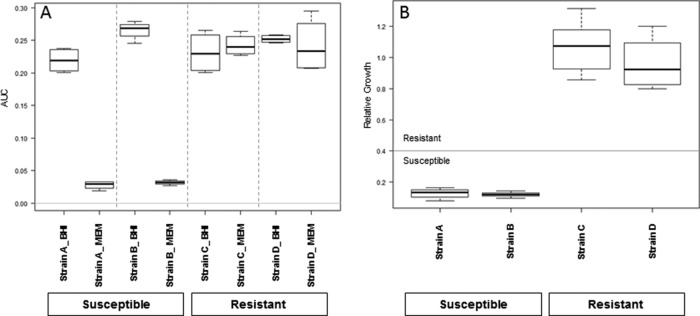
Box plots of the results of the automated evaluation. (A) AUC values obtained for four selected K. pneumoniae strains in the absence or presence of meropenem (64 μg/ml) for 1 h. Results were obtained from four spectra from two separate spots. Susceptible strains show a clear reduction of AUC in the presence of antibiotic. (B) The ratio of the AUC in the presence of antibiotic to that in the absence of antibiotic provides the relative growth. The horizontal line indicates the susceptibility/resistance threshold, the medians are indicated by bold lines, the minima and maxima are indicated by whiskers, and the 25th and 75th percentiles are indicated by boxes.
RESULTS
Optimization of the analysis protocol and model creation.
Investigation of the incubation time revealed that the distinction between susceptible and resistant strains was already possible after 1 h of incubation time in the presence of 64 μg/ml meropenem (Fig. 1). This was the meropenem concentration necessary to achieve a reliable separation of susceptible and resistant strains with the MBT-RESIST assay (K. Sparbier, personal communication). The incubations in the absence of meropenem (Fig. 1, lower panels) show the familiar peak pattern already known from the mass spectrometric identification for the susceptible and resistant strains plus internal standard peaks.
FIG 1.
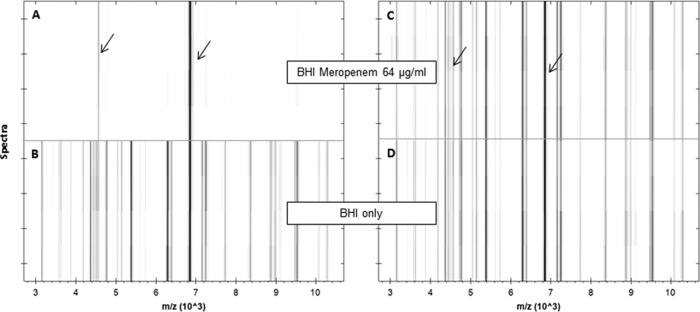
Pseudogel views of the mass range between 3 and 10 kDa of a susceptible (A, B) and a resistant (C, D) K. pneumoniae strain after incubation in the absence (lower panels) or presence (upper panels) of meropenem (64 μg/ml) for 1 h. For each incubation, four spectra acquired from two different spots are shown. Internal standard peaks are marked by arrows.
In contrast, the incubations in the presence of meropenem gave different results for the two strains. The resistant strain (Fig. 1C) showed a spectrum equivalent to that obtained from the sample incubated in the absence of meropenem. The susceptible strain spectrum (Fig. 1A) contained only the peaks of the internal standard and only a few very small peaks derived from the bacterium. A visual inspection of the spectra displayed in the pseudogel view enabled a clear separation between the susceptible and resistant strains. Because the analysis of larger data sets is feasible only with an automated software tool, a prototype algorithm was developed in R. Figure 2 shows the AUC values for two susceptible and two resistant strains incubated in the presence or absence of meropenem (Fig. 2A); for the resistant strains (C and D), all the AUCs were more or less equal for the BHI and the BHI-meropenem setups. The BHI values define the maximum growth of the respective strain under the applied conditions.
For the susceptible strains (A and B), the AUCs of the incubations in the absence of meropenem were in the same range as those obtained for the resistant strains. In contrast, the AUCs obtained for the susceptible strains in the presence of meropenem were greatly decreased. The relative growth (RG) values for the four test strains shown in Fig. 2A are displayed in Fig. 2B. A clear distinction between the susceptible and resistant strains was found. The RG values of the resistant strains were around 1.0, and the RG values of the susceptible strains were <0.4.
In the next step, the antibiotic concentration necessary for a clear classification of resistance was determined. For this, five known susceptible and five known resistant Klebsiella pneumoniae strains were tested with increasing meropenem concentrations (Fig. 3). The best separation between the susceptible and resistant strains was achieved at a concentration of 8 μg/ml and a relative growth cutoff value of 0.4. A relative growth rate of >0.4 was interpreted as indicating resistance. The complete titration curve for three different resistant K. pneumoniae strains and two different susceptible K. pneumoniae strains with increasing concentrations (from 0.025 to 32 μg/ml) of meropenem after 1 h of incubation is shown in Fig. 3. No effects of the increasing meropenem concentrations were observed for the relative growth of strains 1 and 4, which had MIC values of >32 μg/ml and 4 μg/ml, respectively, as determined by Etest analysis. The two susceptible strains (strains 3 and 5) showed a clear reduction of relative growth with increasing meropenem concentrations. At 8 μg/ml, the relative growth was below the cutoff value of 0.4. Etest analysis of strain 2, which is an OXA-48-containing strain, revealed various MIC values between 1.5 and 12 μg/ml meropenem.
FIG 3.
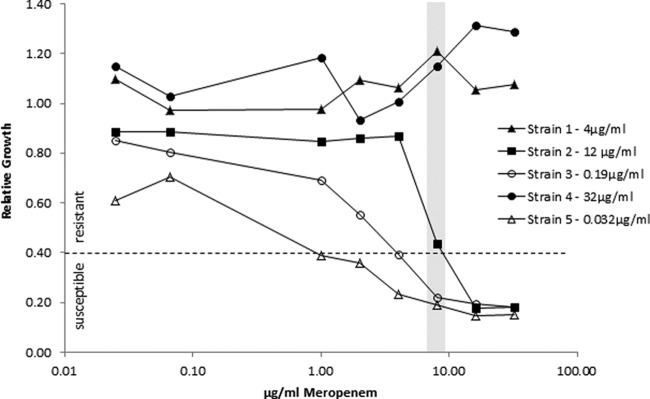
Determination of breakpoint concentrations by meropenem titration (0.025, 0.075, 1, 2, 4, 8, 16, and 32 μg/ml) for five different K. pneumoniae strains. Etest-derived MICs are given in the legend for each strain. The gray bar indicates the concentration of 8 μg/ml used for the analysis of the clinical isolates. The susceptibility/resistance threshold used for the analysis of the clinical isolates is indicated by the dashed line.
Reproducibility.
The reproducibility of the method was tested for five different K. pneumoniae strains on four different days (Fig. 4). In all the analyses, strains 1 and 4 were found to be resistant, with a relative growth above the cutoff value of 0.4, which was in accordance with the previously obtained routine results. Strains 3 and 5 were tested to be susceptible by Etest analysis, with MIC values of 0.19 μg/ml and 0.032 μg/ml meropenem, respectively. The MS-based approach indicated that meropenem concentrations of 4 μg/ml for strain 5 and 8 μg/ml for strain 3 were necessary for a consistent susceptible evaluation. Strain 2 was an OXA-48-containing K. pneumoniae isolate that showed ambiguous behavior—even in the Etest assays—with MIC values varying between 1.5 μg/ml and 12 μg/ml. Similar results were observed in the MS-based approach. In two of the four repetition experiments, relative growth values above the cutoff value of 0.4 were found at a concentration of 8 μg/ml meropenem. The other two experiments gave RG values of <0.4, resulting in a susceptible evaluation.
FIG 4.

Reproducibility of the MBT-ASTRA. RG values were obtained for five different strains at the indicated meropenem concentration on four different days. Although absolute values varied, classification results were consistent.
Analysis of clinical isolates.
Subsequently, the determined breakpoint conditions of 1 h of incubation time and 8 μg/ml meropenem were applied to a set of clinical isolates (Fig. 5). In total, 94 K. pneumoniae strains and 14 K. oxytoca strains were analyzed in parallel using the quantitative MALDI-TOF MS approach and the established routine method (Etest) for susceptibility against meropenem. All the K. oxytoca strains were susceptible, showing MIC values between 0.032 and 0.064 μg/ml meropenem in the routine assay. The corresponding MS-derived values (RG values) ranged between 0.09 and 0.13, indicating susceptibility to meropenem. For the K. pneumoniae strains, 58 were found to be susceptible and 36 were found to be resistant against meropenem by Etest. The MS approach confirmed the routine classification in most cases, with five false-positive results and one false-negative result obtained. The relative growth values of the false-positive strains were very close to the cutoff value of 0.4. Therefore, the analysis of these strains was repeated. These experiments showed relative growth values clearly below the 0.4 cutoff value, leading to classification of these strains as susceptible. These values were also in concordance with the visual inspection of the spectra. The reason for this divergent behavior was not clear. The false-negative strain showed heterogeneous growth with distinct colonies in the inhibition area during the Etest analysis. Repetition of the analysis with a colony picked from the inhibition area led to a resistant classification. Disregarding the repeated measurements, a sensitivity of 97.3% and a specificity of 93.5% were obtained for the new MS-based approach in our experiments.
FIG 5.

Analysis of resistance status of 108 Klebsiella strains. For each strain, the MIC obtained from Etest results (x axis) was plotted against the RG value from the MS-based resistance test (y axis). The susceptibility/resistance threshold for the MS-based assay was set at a relative growth value of 0.4 (dashed line). The MIC-based definition of resistance was determined according to EUCAST guidelines (gray vertical line). Except for five susceptible strains and one resistant strain, classification of the strains was in agreement for the two tests.
Analysis of positive blood cultures.
Finally, the applicability of the new MS approach was tested for positive blood cultures. For this, blood culture bottles were spiked with 10 known susceptible and 8 known resistant randomly selected isolates derived from the previously analyzed clinical isolates. After the bottles had been flagged positive, the MS analysis was performed. After 1 h of incubation in the presence of 8 μg/ml meropenem, 17 of the 18 isolates were correctly classified (Fig. 6). One of the susceptible strains showed very poor growth after 1 h, precluding an evaluation. After 2 h of incubation, growth was sufficient to enable a valid classification as susceptible.
FIG 6.

Analysis of 18 positive blood cultures using the MS-based resistance test. Samples were incubated for 1 h at 37°C with 8 μg/ml meropenem. All strains except one (highlighted in gray) were correctly classified. A prolonged incubation time enabled correct classification for this incorrectly classified strain. In the box plots, medians are indicated by bold lines, the minima and maxima are indicated by whiskers, and the 25th and 75th percentiles are indicated by boxes.
DISCUSSION
The number of resistant microorganisms is constantly increasing. In particular, Gram-negative Enterobacteriaceae species with resistance against carbapenem antibiotics represent an increasing health care problem. Effective hygiene and monitoring measures are required to prevent the further spread of resistant strains. Early intervention and adequate antibiotic therapy have a direct impact on the mortality of patients (17, 18). These requirements can be fulfilled only by rapid analysis methods. The new MALDI-TOF MS-based method represents a simple and quick workflow for the detection of meropenem-resistant Klebsiella isolates. Compared to established routine methods, the assay described here (MBT-ASTRA) is much faster, providing results after a short incubation time of a few hours.
As with other resistance assays, the MS-based resistance assay indirectly measures the growth of bacterial strains. Quantitative MALDI-TOF MS is more sensitive than most optical or visual approaches, reducing the time to results. Using an internal quantitative standard in combination with normalization to the maximum peak of the MALDI spectrum allowed direct comparison of peak intensities. These intensities correlate to the amount of protein in the respective setup and therefore correlate to bacterial growth. Visual inspection of the spectra from cultures incubated in the presence or absence of antibiotics revealed a clear distinction between the susceptible and the resistant strains with respect to peak numbers and intensities. Spectra derived from susceptible strains incubated in the presence of antibiotic mainly contained only peaks arising from the spiked standard, indicating a low number of bacterial cells (Fig. 1). In contrast, resistant strains incubated in the presence of meropenem and setups incubated without antibiotic presented many peaks derived from bacterial ribosomal proteins (19). Direct examination of spectra is very time-consuming and not applicable in routine settings. Therefore, an algorithm was developed to allow automated evaluation. First, the area under the curve correlating to the growth was calculated for each setup (Fig. 2A). In a second step, the ratios of the AUCs of the corresponding setups with and without antibiotic were calculated to provide the relative growth values (Fig. 2B). Calculation of the relative growth enables direct comparison of the values from different setups and different analyses. Furthermore, differences due to different growth rates of the strains are eliminated, and the important information on the resistance status of a sample is delivered by a single value.
Here, we optimized a protocol for the detection of meropenem-resistant Klebsiella species. Discrimination of susceptible and resistant isolates was achieved after an incubation time of 1 h at a meropenem concentration of 8 μg/ml with a relative growth cutoff value of 0.4 (Fig. 3). Including the preanalysis setup, incubation, postincubation processing/extraction, and data analysis, the total time required to perform the assay is about 2 to 3 h, which is much faster than that of established routine assays. Automated approaches require at least 5 h until a result is delivered, even for fast-growing organisms. The time to result of the MALDI-TOF MS-based approach is in the same range as that of PCR analysis. However, PCR has clear disadvantages in that only previously known resistance genes can be detected and no information about the actual expression of the genes is provided. Additionally, PCR analysis is relatively expensive, restricting its general use in routine workflows. The recently described Carba NP test (20, 21) for the detection of carbapenemase-producing strains is based on the unspecific color change of a pH indicator. Interpretation is based on visual inspection of the incubation setups, and there is no automated or traceable data evaluation. Although this assay provides results after a few hours, its applicability is restricted to the detection of carbapenem resistance.
The new mass spectrometric assay represents a valuable extension to the recently described MBT-RESIST assay (11, 12). The MBT-ASTRA compares growth under two different growth conditions, with and without antibiotics, and takes all peaks of the spectrum into account. In contrast, the MBT-RESIST assay compares single peak shifts derived from the specific incorporation of heavy amino acids during protein synthesis with the normal peak of a profile spectrum. This requires a species-specific evaluation algorithm for MBT-RESIST that is not required for MBT-ASTRA. Nevertheless, MBT-RESIST is a very useful tool for the fast detection of resistance against antibiotics that block protein biosynthesis. The applicability, advantages, and disadvantages of these two methods will be compared in future studies.
The assay described here used an incubation time of 1 h. Preliminary results suggested that to achieve maximum robustness in routine use, the incubation time may need to be increased. Prolonged incubation times up to 3 h did not negatively impact the results (data not shown). The meropenem concentration of 8 μg/ml used in the assay is close to the clinical breakpoint applied for routine tests. Titration of the antibiotic concentration revealed that a concentration of 4 μg/ml meropenem was also used to achieve discrimination of susceptible and resistant strains, but in this case, the cutoff value for differentiation between susceptible and resistant strains would increase from 0.4 to 0.6, and the resistant and susceptible strain RG values would not be as well separated as when using 8 μg/ml meropenem. Once again, prolonging the incubation may overcome this problem. Additional experiments are required to optimize the conditions for a robust routine applicable assay.
The reproducibility study showed variance in the absolute values of the relative growth of the different strains, but in all experiments with an antibiotic concentration of 8 μg/ml, the classifications were correct. Strain 2, an OXA-48-expressing K. pneumoniae strain, showed varying results in the Etest and in the MBT-ASTRA with respect to its resistance status. The classification of OXA-48-expressing strains seems to be problematic. Other groups using different analysis methods reported poor OXA-48 detection due to the weak carbapenemase activity (2, 22). Our study included five OXA-48 strains. Four of these strains showed an unambiguous resistant classification. Unfortunately, this number is not sufficient to draw any conclusion as to whether the new MS-based resistance test provides better sensitivity for OXA-48 detection. For resistant strains 1 and 4, all MBT-ASTRA values were above the cutoff value independent of antibiotic concentration. Although the MIC values of these strains were quite different at 4 μg/ml and >32 μg/ml, respectively, no differences were observed for the relative growth values plotted against increasing meropenem concentrations (Fig. 3). Susceptible strains 3 and 5 gave relative growth values above the susceptibility threshold at low antibiotic concentrations. The individual breakpoint concentration can be regarded as the concentration at which the respective strains' relative growth is equal to the cutoff value. The breakpoint meropenem concentration was found to be 4 μg/ml for strain 3 (MIC 0.19 μg/ml) and 1 μg/ml for strain 5 (MIC 0.032 μg/ml). These titration experiments revealed that each strain displayed a breakpoint at a meropenem concentration 20 to 30 times higher than the breakpoint concentration determined by Etest. This indicates that for resistant strains 1 and 4, the meropenem concentrations required to inhibit growth were higher than the concentrations used in the titration experiment. Consequently, no differences in susceptibilities were observed between strains 1 (MIC 4 μg/ml) and 4 (MIC 32 μg/ml).
The observed increase in the breakpoint meropenem concentration may be a result of the short incubation time used for the MS-based method. It is assumed that to achieve inhibition of growth within this short incubation time, higher concentrations of meropenem than those for the Etest analysis are required. This might explain why no direct correlation between the MICs and the mass spectrometric relative growth values was observed in this study. Using other interpretation standards, such as CLSI standards, instead of EUCAST standards may require an adaptation of the applied antibiotic concentration and the relative growth threshold. To investigate this issue, we will need further comparisons of strains' MICs and their corresponding breakpoint meropenem concentration. When using the mass spectrometric assay at a fixed meropenem concentration, the only possible interpretations are susceptible or resistant, similar to disk diffusion assay results. In principle, different antibiotic concentrations can be employed in the MBT-ASTRA to determine a mass spectrometric breakpoint. A defined breakpoint concentration is a prerequisite for adapting the therapeutic dosage.
The MBT-ASTRA was applied to investigate the resistance status of 108 different Klebsiella isolates against meropenem. The MIC determination by Etest revealed 36 meropenem-resistant and 72 meropenem-susceptible isolates. All 11 K. oxytoca isolates tested were susceptible to meropenem. The MBT-ASTRA classified 40 Klebsiella isolates as resistant and 68 as susceptible. Compared to the Etest results, the MBT-ASTRA delivered one false-negative and five false-positive results. The strain that gave the false-negative result displayed heterogeneous growth behavior in the Etest. After 6 h, an inhibition zone with many small colonies inside was visible. After 18 h, those colonies were no longer detectable as single colonies, and no inhibition by meropenem was detected. This means that the strain was a mixture of fast- and slow-growing resistant bacteria that gave rise to a susceptible classification in the MBT-ASTRA. The isolation of colonies from the inhibition zone and subsequent analysis by the MBT-ASTRA delivered the expected resistant classification. Reanalysis of the five false-positive strains and of those resistant strains with relative growth values between 0.4 and 0.7 revealed relative growth values clearly below the cutoff for the susceptible strains and of >0.7 for the resistant strains. The reason for those divergent results is not known. Since repetition of the experiments revealed results that were in concordance with the Etest results, technical variations may have been the reason. Disregarding the replicates, a specificity of 93.5% and a sensitivity of 97.3% were achieved using the MBT-ASTRA. Most of the analyzed strains were K. pneumoniae carbapenemase-positive isolates (28 of 36 strains). The general applicability of the MBT-ASTRA for other carbapenemase-positive strains, such as OXA-48, NDM, or VIM strains, must be investigated by further studies that include higher numbers of OXA-48, NDM, or VIM strains.
The MBT-ASTRA was successfully used for the analysis of positive blood cultures. The assay conditions used were the same as those used for the analysis of cells derived from culture plates. It should be noted that only a small number of isolates was tested, and the cell number was not determined or adjusted during the assay. All the isolates except one were correctly classified. The reason for this misclassification was poor growth of this strain, which was indicated by the very low growth value of the control setup without antibiotic. A longer incubation time of 2 h resulted in sufficient growth in the control setup to enable a meaningful relative growth value that provided a correct classification to be obtained. This experiment demonstrates the importance of the level of growth in the control setup and the necessity for defining a minimum AUC value for setups without antibiotics. The conditions required for a robust routine analysis will be investigated in further optimization experiments and in the analysis of more isolates. In the case of mixed blood cultures, a resistant result should only be reported when there is actual bacterial growth. Therefore, when resistant bacteria are present in a mixed culture, they also must be considered to be of clinical concern, and the reported resistance cannot be regarded as “false.” Mixed blood culture may present a problem when a species with an intrinsic resistance against a certain antibiotic is mixed with another species that is usually sensitive. In such cases, the MBT-ASTRA would detect the growth of the resistant species and provide a classification as resistant. Consequently, optimized strategies may be necessary for applying the MBT-ASTRA to mixed cultures. MALDI Biotyper software can detect species from mixed cultures, and such blood cultures can be recognized and flagged.
Compared to traditional methods, the combination of rapid species identification using the MALDI Biotyper and the identification of antibiotic resistance using the MBT-ASTRA can greatly reduce the time to results, thus enabling much earlier reevaluation of antibiotic therapy, especially for the analysis of positive blood cultures. Because MALDI-TOF has become a well-established tool in microbiology labs, no additional technical investment would be necessary to introduce this approach into a routine lab. Even the instrument settings are similar to those used for species identification. Additionally, the setup without antibiotic can be used to identify or confirm the identity of a species. Due to the spiked standard, log scores might be slightly reduced compared to those of normal profile spectra. In principle, the approach should be applicable to other antibiotics and other species. Preliminary experiments have revealed that the conditions described here must be optimized for other antibiotics and other species (data not shown). Nevertheless, this new MS-based approach shows great promise, thanks to its simple setup, short incubation time, and excellent outcomes with respect to sensitivity and specificity.
Supplementary Material
ACKNOWLEDGMENTS
We thank Beatrix Wegemann for excellent technical assistance and Richard Rascher-Friesenhausen for valuable discussions. We are grateful to Jason Smith for his review of our manuscript.
This study was supported by a grant from the Bayerische Forschungsstiftung, Forschungsverbund “ForBIMed—Biomarker in der Infektionsmedizin” to M.K. and S.S.
K.S., C.L., and M.K. are employed at the mass spectrometry company Bruker Daltonik GmbH, Germany.
Footnotes
Published ahead of print 17 September 2014
Supplemental material for this article may be found at http://dx.doi.org/10.1128/JCM.01872-14.
REFERENCES
- 1.WHO. 2014. Antimicrobial resistance: global report on surveillance 2014. WHO, Geneva, Switzerland. [Google Scholar]
- 2.Woodford N, Eastaway AT, Ford M, Leanord A, Keane C, Quayle RM, Steer JA, Zhang J, Livermore DM. 2010. Comparison of BD Phoenix, Vitek 2, and MicroScan automated systems for detection and inference of mechanisms responsible for carbapenem resistance in Enterobacteriaceae. J. Clin. Microbiol. 48:2999–3002. 10.1128/JCM.00341-10. [DOI] [PMC free article] [PubMed] [Google Scholar]
- 3.Van der Zee A, Steer N, Thijssen E, Nelson J, van't Veen A, Buiting A. 2003. Use of multienzyme multiplex PCR amplified fragment length polymorphism typing in analysis of outbreaks of multiresistant Klebsiella pneumoniae in an intensive care unit. J. Clin. Microbiol. 41:798–802. 10.1128/JCM.41.2.798-802.2003. [DOI] [PMC free article] [PubMed] [Google Scholar]
- 4.Mellmann A, Bimet F, Bizet C, Borovskaya AD, Drake RR, Eigner U, Fahr AM, He Y, Ilina EN, Kostrzewa M, Maier T, Mancinelli L, Moussaoui W, Prévost G, Putignani L, Seachord CL, Tang YW, Harmsen D. 2009. High interlaboratory reproducibility of matrix-assisted laser desorption ionization–time of flight mass spectrometry-based species identification of nonfermenting bacteria. J. Clin. Microbiol. 47:3732–3734. 10.1128/JCM.00921-09. [DOI] [PMC free article] [PubMed] [Google Scholar]
- 5.Seng P, Drancourt M, Gouriet F, La Scola B, Fournier P-E, Rolain JM, Raoult D. 2009. Ongoing revolution in bacteriology: routine identification of bacteria by matrix-assisted laser desorption ionization time-of-flight mass spectrometry. Clin. Infect. Dis. 49:543–551. 10.1086/600885. [DOI] [PubMed] [Google Scholar]
- 6.Sauer S, Kliem M. 2010. Mass spectrometry tools for the classification and identification of bacteria. Nat. Rev. Microbiol. 8:74–82. 10.1038/nrmicro2243. [DOI] [PubMed] [Google Scholar]
- 7.Kostrzewa M, Sparbier K, Maier T, Schubert S. 2013. MALDI-TOF MS: an upcoming tool for rapid detection of antibiotic resistance in microorganisms. Proteomics Clin. Appl. 7:767–778. 10.1002/prca.201300042. [DOI] [PubMed] [Google Scholar]
- 8.Hrabák J, Walková R, Studentová V, Chudácková E, Bergerová T. 2011. Carbapenemase activity detection by matrix-assisted laser desorption ionization-time of flight mass spectrometry. J. Clin. Microbiol. 49:3222–3227. 10.1128/JCM.00984-11. [DOI] [PMC free article] [PubMed] [Google Scholar]
- 9.Burckhardt I, Zimmermann S. 2011. Using matrix-assisted laser desorption ionization–time of flight mass spectrometry to detect carbapenem resistance within 1 to 2.5 hours. J. Clin. Microbiol. 49:3321–3324. 10.1128/JCM.00287-11. [DOI] [PMC free article] [PubMed] [Google Scholar]
- 10.Sparbier K, Schubert S, Weller U, Boogen C, Kostrzewa M. 2012. Matrix-assisted laser desorption ionization–time of flight mass spectrometry-based functional assay for rapid detection of resistance against β-lactam antibiotics. J. Clin. Microbiol. 50:927–937. 10.1128/JCM.05737-11. [DOI] [PMC free article] [PubMed] [Google Scholar]
- 11.Tenover FC. 2006. Mechanisms of antimicrobial resistance in bacteria. Am. J. Med. 119:S3–S10; discussion S62–S70. 10.1016/j.amjmed.2006.03.011. [DOI] [PubMed] [Google Scholar]
- 12.Sparbier K, Lange C, Jung J, Wieser A, Schubert S, Kostrzewa M. 2013. MALDI Biotyper-based rapid resistance detection by stable-isotope labeling. J. Clin. Microbiol. 51:3741–3748. 10.1128/JCM.01536-13. [DOI] [PMC free article] [PubMed] [Google Scholar]
- 13.Jung JS, Eberl T, Sparbier K, Lange C, Kostrzewa M, Schubert S, Wieser A. 2014. Rapid detection of antibiotic resistance based on mass spectrometry and stable isotopes. Eur. J. Clin. Microbiol. Infect. Dis. 33:949–955. 10.1007/s10096-013-2031-5. [DOI] [PubMed] [Google Scholar]
- 14.Sauer S, Freiwald A, Maier T, Kube M, Reinhardt R, Kostrzewa M, Geider K. 2008. Classification and identification of bacteria by mass spectrometry and computational analysis. PLoS One 3:e2843. 10.1371/journal.pone.0002843. [DOI] [PMC free article] [PubMed] [Google Scholar]
- 15.R Foundation for Statistical Computing. 2011. R: a language and environment for statistical computing. R Foundation for Statistical Computing, Vienna, Austria. [Google Scholar]
- 16.Gibb S, Strimmer K. 2012. MALDIquant: a versatile R package for the analysis of mass spectrometry data. Bioinformatics 28:2270–2271. 10.1093/bioinformatics/bts447. [DOI] [PubMed] [Google Scholar]
- 17.Schwaber MJ, Carmeli Y. 2009. The effect of antimicrobial resistance on patient outcomes: importance of proper evaluation of appropriate therapy. Crit. Care 13:106. 10.1186/cc7136. [DOI] [PMC free article] [PubMed] [Google Scholar]
- 18.Kumar A, Ellis P, Arabi Y, Roberts D, Light B, Parrillo JE, Dodek P, Wood G, Kumar A, Simon D, Peters C, Ahsan M, Chateau D, Cooperative Antimicrobial Therapy of Septic Shock Database Research Group 2009. Initiation of inappropriate antimicrobial therapy results in a fivefold reduction of survival in human septic shock. Chest 136:1237–1248. 10.1378/chest.09-0087. [DOI] [PubMed] [Google Scholar]
- 19.Teramoto K, Sato H, Sun L, Torimura M, Tao H. 2007. A simple intact protein analysis by MALDI-MS for characterization of ribosomal proteins of two genome-sequenced lactic acid bacteria and verification of their amino acid sequences. J. Proteome Res. 6:3899–3907. 10.1021/pr070218l. [DOI] [PubMed] [Google Scholar]
- 20.Dortet L, Poirel L, Nordmann P. 2012. Rapid identification of carbapenemase types in Enterobacteriaceae and Pseudomonas spp. by using a biochemical test. Antimicrob. Agents Chemother. 56:6437–6440. 10.1128/AAC.01395-12. [DOI] [PMC free article] [PubMed] [Google Scholar]
- 21.Bernabeu S, Poirel L, Nordmann P. 2012. Spectrophotometry-based detection of carbapenemase producers among Enterobacteriaceae. Diagn. Microbiol. Infect. Dis. 74:88–90. 10.1016/j.diagmicrobio.2012.05.021. [DOI] [PubMed] [Google Scholar]
- 22.Tijet N, Boyd D, Patel SN, Mulvey MR, Melano RG. 2014. Reply to “Further proofs of concept for the Carba NP test.” Antimicrob. Agents Chemother. 58:1270. 10.1128/AAC.02285-13. [DOI] [PMC free article] [PubMed] [Google Scholar]
Associated Data
This section collects any data citations, data availability statements, or supplementary materials included in this article.