

Abstract
Purpose: Ultrasound (US) overestimates stone size when compared with CT. The purpose of this work was to evaluate the overestimation of stone size with US in an in vitro water bath model and investigate methods to reduce overestimation.
Materials and Methods: Ten human stones (3–12 mm) were measured using B-mode (brightness mode) US by a sonographer blinded to the true stone size. Images were captured and compared using both a commercial US machine and software-based research US device. Image gain was adjusted between moderate and high stone intensities, and the transducer-to-stone depth was varied from 6 to 10 cm. A computerized stone-sizing program was developed to outline the stone width based on a grayscale intensity threshold.
Results: Overestimation with the commercial device increased with both gain and depth. Average overestimation at moderate and high gain was 1.9±0.8 and 2.1±0.9 mm, respectively (p=0.6). Overestimation increased an average of 22% with an every 2-cm increase in depth (p=0.02). Overestimation using the research device was 1.5±0.9 mm and did not vary with depth (p=0.28). Overestimation could be reduced to 0.02±1.1 mm (p<0.001) with the computerized stone-sizing program. However, a standardized threshold consistent across depth, system, or system settings could not be resolved.
Conclusion: Stone size is consistently overestimated with US. Overestimation increased with increasing depth and gain using the commercial machine. Overestimation was reduced and did not vary with depth, using the software-based US device. The computerized stone-sizing program shows the potential to reduce overestimation by implementing a grayscale intensity threshold for defining the stone size. More work is needed to standardize the approach, but if successful, such an approach could significantly improve stone-sizing accuracy and lead to automation of stone sizing.
Introduction
Stone size is an important factor in the clinical management of nephrolithiasis.1–4 Nonobstructing renal stones smaller than 5 mm have high spontaneous passage rates and are often observed.1,2 Larger stones are less likely to pass spontaneously, and thus, it is often recommended that patients consider treatment with elective surgery. Underestimation of true stone size may result in observation of a stone that is unlikely to pass, possibly leading to a stone event; overestimation of true stone size could result in surgery for stones that would have passed without intervention. The appropriate choice of diagnostic imaging and the precise determination of stone size during the initial evaluation are critical for clinical decision-making and patient counseling.4
In the United States, CT is the most common imaging modality for renal colic and the diagnostic standard for the initial imaging of patients with suspected nephrolithiasis.5,6 CT, however, is associated with ionizing radiation exposure and higher cost compared with other imaging modalities. Ultrasound (US) is an alternative imaging technology that is portable, ubiquitous, and poses no risk of radiation exposure. Its use in stone management is limited by decreased sensitivity, specificity, user dependence, and inaccurate stone sizing.7,8 Improvements in the diagnostic accuracy of US would encourage greater use of US in the workup of nephrolithiasis.
The purpose of this study was to investigate factors that could affect the accuracy of kidney stone sizing with US in an in vitro model. We sought to improve stone-sizing accuracy by studying the effect of gain in a commercial US unit, custom imaging algorithms in a research US unit, and a computerized stone-outlining technique.
Materials and Methods
Ten human calcium oxalate monohydrate stones ranging from 3 to 12 mm were used for this study. All stones were rehydrated for at least 48 hours before measurement. Stones were imaged by a commercial US device as well as a stand-alone software-based research US system. The effects of stone depth and US system gain were evaluated. The system settings were predefined and the same settings were used for all 10 stones, other than the specific settings we sought to investigate. Finally, to reduce user variability, a computerized stone-outlining algorithm was investigated. Repeated measure ANOVA with a random intercept was used to compare groups. Statistical significance was defined as p<0.05.
US imaging system
B-mode images were captured using a commercial ultrasound instrument (HDI5000; Philips Ultrasound, Bothell, WA) and a separate programmable research instrument based on the Verasonics data acquisition system (Verasonics, Inc., Redmond, WA). The research instrument utilized custom stone-specific algorithms. This included an alternative US transmit pattern known as flash angle (plane wave) imaging. Flash angle imaging activates all transducer array elements simultaneously, resulting in a plane unfocused wave of US travelling through the media. In contrast, traditional B-mode US imaging activates individual elements to direct the acoustic energy to a focus.
The manner in which the raw US data are compressed was customized. The dynamic range of native US data is greater than the grayscale range available with most computer monitors or perceivable with the human eye. To reduce this, the data are compressed. The compression can be uniform across the entire range or can be adjusted across bands of brightness. For this study, parameters were adjusted to give less compression to high-intensity signals, allowing bright objects, such as stones, greater separation in intensity from the background signal.
Finally, the use of smoothing algorithms was reduced for the research system. Conventional US processing includes a number of filtering and smoothing algorithms to reduce the speckle pattern introduced by the scattering of US through the media. Although this process does improve the quality of the image, it can also blur discontinuities, such as a stone boundary, by averaging bright regions with lower intensity neighboring regions.
True stone size measurement
True stone size was determined through MATLAB (Mathworks, Waltham, MA) using photographs of the stones (D40 camera with 18 to 200 mm f/3.5 to 5.6 lens; Nikon, Inc., Melville, NY) taken with a millimeter ruler for reference. The linear size of the stone was calculated as the maximum width dimension.
Stone measurement protocol
Stones were immersed and imaged through a water bath. Stones were placed on an attenuative gel phantom (Jeltrate; DENTSPLY Caulk, Milford, DE) to reduce scatter from the US. The transducer was mounted and oriented, such that the maximum measured width of the stone was aligned with the long axis of the US probe (Fig. 1). Image guidance was used to optimize the probe alignment with the stone and to verify stone depth. By the method used, it is estimated that the true depth is within±2 mm from the theoretical depth. B-mode images were captured using a commercial ultrasound instrument (HDI5000; Philips Ultrasound) as well as a software-controlled research instrument (Verasonics, Inc.,). All stones were imaged with both systems and neither the stone nor the transducer position was altered between acquisitions from the two systems; the probe connection was moved from one system to the other. The commercial US instrument utilized preprogrammed settings for abdominal imaging with spatial compounding turned off. The research-based instrument utilized custom stone-specific settings based on flash angle (plane wave) imaging. Images were collected at three depths from the transducer: 6, 8, and 10 cm. The collected images were then loaded into MATLAB, where a researcher marked the left and right edges of the stone with calipers.
FIG. 1.

Experimental setup. Stones were immersed in a water bath and placed on an attenuative gel phantom. The C4-2 transducer was mounted above the stone and oriented such that the maximum measured width of the stone was aligned with the long axis of the ultrasound (US) probe.
Gain setting
Images captured with the commercial US unit included both moderate and high gain settings. Images with the research device were only captured at moderate gain. A precise control was not available to reliably and accurately switch to a high gain setting, therefore, images were only captured at the default gain setting. High gain was defined as ∼80% peak saturation of the stone. Moderate gain was defined as ∼65% peak saturation of the stone. The settings were consistent for all 10 stones within a given experimental setup, and the stone position was not moved between acquisitions from the two images.
Stone outlining algorithm
A stone-sizing program was developed to determine if B-mode grayscale intensity could be used to consistently and accurately measure stone size. To be successful, a single threshold or threshold equation that worked across all systems and system settings would need to be established. To determine an optimal grayscale intensity threshold, true stone size was used as an input parameter and the grayscale intensity that minimized the error in stone size was the output. The results across stone depth, size, system, and system settings could then be compared.
Each B-mode image was loaded into MATLAB and the user manually identified the approximate center of the stone. The program interrogated a 15×15 mm region surrounding the central coordinate using a preset threshold value based on the US grayscale signal intensity (which ranged from 0 to 255). Above the threshold, the pixel was identified and assigned as stone. MATLAB's built-in contour program was then used to outline the stone (Fig. 2). The size of the stone was calculated as the distance between the left and right edge coordinates. The threshold was adjusted from an intensity value of 30 to 180, in intervals of 5, to determine the intensity value that returned the least error in stone size for each stone individually. The average threshold for each group of 10 stones was used to calculate an average error and standard deviation.
FIG. 2.

Stone-outlining algorithm. The magenta line shows the contour outline generated by the compute at a grayscale intensity of 50. This represents the stone edge manually identified by the researcher. The blue line shows the contour outline at a grayscale level of 125, which represents the true stone size.
Results
The US-measured size of (the same) 10 stones ranging from 3 to 12 mm were compared using a commercial US system and research US system. The stone size measured manually was overestimated an average of 1.9±0.8 mm (commercial US at moderate gain), 2.1±0.9 mm (commercial US at high gain), and 1.5±1.0 mm (research US at moderate gain) (Table 1). There was no difference between commercial and research US at low depths (6 and 8 cm), but there was a significant improvement in the accuracy of the research US at higher depths (10 cm; p=0.02) (Table 1). Figure 3 shows a representative example of the measurements with the three system per gain settings.
Table 1.
Average Difference in Measured and True Stone Size as a Function of Depth (Manual Measurement)
| Depth (cm) | Commercial system (moderate gain), mm | Commercial system (high gain), mm | Research system (moderate gain), mm | p-Value |
|---|---|---|---|---|
| 6 | 1.37±0.69 | 1.67±0.78 | 1.35±1.05 | 0.28 |
| 8 | 1.77±0.55 | 2.14±0.75 | 1.64±0.84 | 0.47 |
| 10 | 2.41±0.69 | 2.64±0.78 | 1.40±0.83 | 0.02 |
FIG. 3.
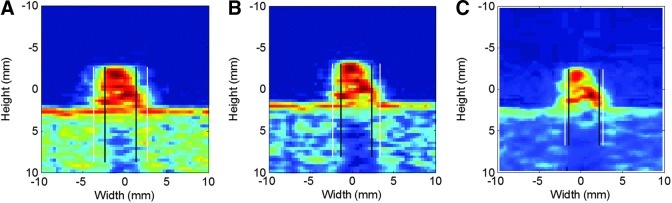
Demonstration of stone overestimation. White line represents the manual measurement and the black lines represent true stone size. (A) Commercial system high gain, (B) commercial system moderate gain, (C) research device with flash imaging.
Depth
With the commercial system, overestimation increased with increasing depth (p=0.02). At moderate gain, the stone size measurement increased by 23% from 6 to 8 cm and 27% from 8 to 10 cm (Fig. 4). The results were similar for the high gain setting (p=0.02); stone size measurement increased by 22% from 6 to 8 cm and 19% from 8 to 10 cm.
FIG. 4.
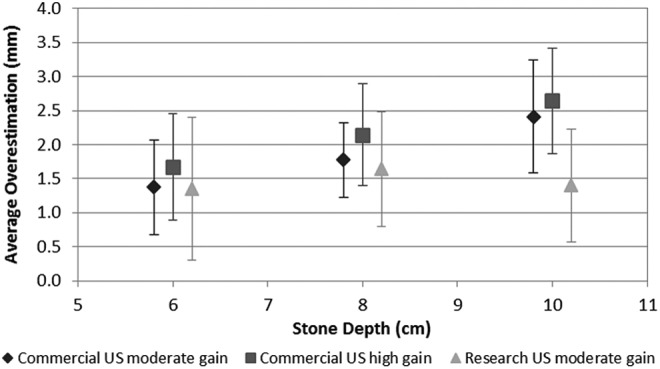
Average stone size overestimation using a commercial system at high gain, moderate gain, and research device programmed at moderate gain.
With the research US machine, the stone size measurement did not significantly change as a function of depth (p=0.99). The stone size measurement increased by 18% from 6 to 8 cm and decreased by 15% from 8 to 10 cm.
Gain setting
Stone measurement as a function of gain was examined with the commercial system (Table 1). Increasing the gain at a given depth resulted in greater overestimation of stone size, but was not statistically significant (p=0.6). Stone size overestimation increased by 18% from the moderate to high gain setting at both 6 and 8 cm depths. Overestimation increased by 9% from the moderate to high gain setting at a 10 cm depth.
Computerized stone sizing
Using the true stone size as an input parameter, a grayscale intensity threshold that minimized stone size error was obtained for each stone (Fig. 5). Unfortunately, we found substantial threshold variation with this approach. As such, we were unable to utilize a single grayscale intensity threshold that could improve sizing accuracy across all conditions. The threshold settings were not consistent across stone, depth, system, or gain settings (Fig. 5). Using grayscale intensity thresholds, however, we found that the stone size obtained using the computerized algorithm has the potential to be significantly more accurate than the manual measurement (p<0.001). Average discrepancy between the computer calculated stone size and true stone size was minimized to −0.01±0.5 mm (commercial US at moderate gain), 0.01±1.2 mm (commercial US at high gain), and −0.01±1.5 mm (research US) (Table 2).
FIG. 5.

Variability in grayscale intensity threshold needed to minimize stone size overestimation for each group of 10 stones.
Table 2.
Average Difference in Measured and True Stone Size as a Function of Depth (Computerized Measurement)
| Depth (cm) | Commercial system (moderate gain), mm | Commercial system (high gain), mm | Research system (moderate gain), mm |
|---|---|---|---|
| 6 | 0.01±0.66 | 0.01±1.09 | −0.002±1.36 |
| 8 | 0.01±0.36 | 0.07±1.15 | −0.03±1.94 |
| 10 | −0.03±0.58 | −0.05±1.31 | 0.002±1.34 |
Discussion
This article describes the first study to evaluate US stone-sizing accuracy in an in vitro model and proposes techniques to improve accuracy. Prior studies assessing US stone-sizing accuracy compared US against CT, which is also subject to inherent error.9–12 Kishore and associates demonstrated a mean overestimation of 1.1 mm when comparing the true stone size to CT measured stone size of distal ureteral stones that were passed.9 Eisner and associates found that stones were underestimated by as much as 1.9 mm depending on whether stones were measured with bone windows versus standard soft-tissue windows.10 Our study found that US tended to overestimate true stone size. These results are similar to the findings of both Fowler and associates and Ray and associates, who compared the diagnostic accuracy of US stone sizing to CT imaging.11,12 We found that the depth and gain are factors that affect accurate stone sizing. By modifying both the US system and system settings, we were able to improve diagnostic accuracy. The use of a stone outlining program has the potential to significantly reduce stone overestimation, but a standardized approach based just on grayscale intensity was not consistent across experimental settings.
Images produced by US are inherently dependent on both the system and system settings. This can have significant clinical implications in any situation where a measurement is dependent on the image produced.13,14 This study demonstrates that this is also the case for kidney stone sizing, where a higher gain increased stone size overestimation. By increasing gain, sonographers may improve stone detection by increasing the signal contrast between the stone and surrounding tissue, but this may artificially expand the stone border and lead to overestimation. We propose that when sizing kidney stones, a low to moderate gain setting be utilized for improved accuracy.
We also determined that with the commercial US machine, increasing depth led to a significant decrease in stone-sizing accuracy. This can be explained as an inherent limitation of traditional US technology. Abdominal US probes operate at a frequency near 3 MHz and the radiating beam is shaped like an hourglass, with the idealized resolution occurring at the waist, ∼4 to 6 cm from the probe. Resolution decreases beyond the waist due to beam divergence, which blurs the stone boundaries, leading to increased overestimation with increased depth. Our finding correlated with Ray and associates, whose article demonstrated that increased skin-to-stone distance was significantly associated with US and CT discordance.11 The custom flash angle imaging algorithms, utilized in the software-based research US machine, did not show an increase in overestimation of stone size with increasing depth. This type of imaging modality leads to an unfocused wave of US travelling through the media, and therefore, in theory, is not dependent on the depth of penetration. Use of this imaging technique demonstrates that alternative beam techniques could improve stone-sizing accuracy in patients with greater skin-to-stone distances.
Finally, in an attempt to reduce user variability, a computerized stone-outlining algorithm was tested. Similar techniques have been used in CT imaging to improve accuracy in stone sizing. Duan and associates were able to use computer threshold techniques to quantify stone volume and improve accuracy in stone sizing by up to 19.6%.15 The algorithm we developed was to reduce the error in stone size, based on thresholding the grayscale intensity. The problem for any computerized model is that we must know the threshold parameter a priori. In this case, we show that the threshold is highly variable across stones, systems, and depths. The results, however, provide a measure of the range in intensity threshold levels that could be used to explore other parameters such as the grayscale intensity gradient.
There are several limitations to our study. Our sample size was small and we did not have stones of all sizes, which may make the results of our study difficult to generalize and lowers the power in our statistical analysis. For example, a larger sample would probably have resulted in a statistical significance, with our gain settings. Furthermore, all stones analyzed were calcium oxalate monohydrate. The measurement error may be different for stone types of different ultrasonic impedance, introduced by changes in density or sound speed. We did not account for the attenuative and refractive effects of tissue found in a human patient due to the in vitro nature of our study. The in vitro model provides a ground truth to the minimum overestimation that would occur. A more realistic model to simulate tissue effects would introduce further distortion of the stone size. The in vitro model also provides a predictable test bed for analyzing methods to improve stone sizing. Only one type of commercial system was tested. It is unclear if all systems would have similar results. Finally, a consistent and predictable grayscale intensity threshold that worked for all cases could not be established for the computerized stone-sizing algorithm. Further refinement is needed to identify a parameter that could be used to define the stone boundary across all stones, stone depths, US system settings, and US systems.
Despite these limitations, our study demonstrates the importance of both depth and system gain settings on the overestimation of stones and introduces potential techniques to improve stone-sizing accuracy. The consistency of our results with in-vivo studies validates our in vitro model as a viable test bed and represents the first evaluation of the accuracy of US sizing compared with the true stone size. It is also the first study to propose both US system and setting changes to improve stone size accuracy. Eventual use of this technology could be applied to all US machines as the algorithms are computer codes that can be easily adopted into commercial machines. However, additional studies will need to first be developed to validate these findings in vivo and in a consistent manner. Additional studies are needed to determine the effects of gain and depth in vivo, in addition to the feasibility of using a computer stone-sizing algorithm.
Conclusion
There are inherent and adjustable factors in US that lead to overestimation of the stone size that might have important implications in clinical management. Overestimation increased with increasing depth and gain (although not statistically significant) using a commercial US machine. This preliminary study shows that alternative US imaging modes, such as flash angle imaging, may be useful in improving stone-sizing accuracy and may decrease the effect of depth. In addition, a computerized stone-sizing program shows promise for potential automation of stone size calculation and reduction in user variability, although a single threshold value is still needed to optimize this technology.
Abbreviations Used
- ANOVA
analysis of variance
- B-Mode
beam mode
- CT
computed tomography
- US
ultrasound
Acknowledgments
Funding was provided through the NIH DK43881, DK092197, and NSBRI through NASA NCC 9–58. This material is the result of work supported by the resources from the VA Puget Sound Health Care System, Seattle, Washington. Funds and resources have also been provided by the University of Washington C4C, the Institute of Translational Health Sciences, Coulter Institute, Washington Biotechnology & Biomedical Association (WBBA), and the Washington Research Foundation. Thanks to Ziyue Liu, PhD at Indiana University, for statistical analysis.
Disclosure Statement
No competing financial interests exist.
References
- 1.Coe F, Keck E. The natural history of calcium urolithiasis. JAMA 1977;238:1519–1523 [PubMed] [Google Scholar]
- 2.Ueno A, Kawamura T, Ogawa A. Relation of spontaneous passage of ureteral calculi to size. Urology 1977;10:544–546 [DOI] [PubMed] [Google Scholar]
- 3.Sterrett S, Nakada S. Medical expulsive therapy. Curr Opin Urol 2008;18:210–213 [DOI] [PubMed] [Google Scholar]
- 4.Miller O, Kane C. Time to stone passage for observed ureteral calculi: A guide for patient education. J Urol 1999;162:688–691 [DOI] [PubMed] [Google Scholar]
- 5.Fwu C, Eggers P, Kimmel P, et al. Emergency room visits, use of imaging and drugs for urolithiasis have increased in the United States. Kidney Int 2013;83: 479–486 [DOI] [PMC free article] [PubMed] [Google Scholar]
- 6.Moore C, Scoutt L. Sonography first for acute flank pain? J Ultrasound Med 2012;31:1703–1711 [DOI] [PubMed] [Google Scholar]
- 7.Sorensen M, Harper J, Hsi R, et al. B-mode ultrasound versus color Doppler twinkling artifact in detecting kidney stones. J Endourol 2013;27:149–153 [DOI] [PMC free article] [PubMed] [Google Scholar]
- 8.Ulusan S, Koc Z, Tokmak N. Accuracy of sonography for detecting renal stone: Comparison with CT. J Clin Ultrasound 2007;35: 256–261 [DOI] [PubMed] [Google Scholar]
- 9.Kishore T, Pedro R, Hinck B. Estimation of size of distal ureteral stones: Noncontrast CT scan versus actual size. Urology 2008;72:761–764 [DOI] [PubMed] [Google Scholar]
- 10.Eisner B, Kambadakone A, Monga M, et al. Computerized tomography magnified bone windows are superior to standard soft tissue windows for accurate measurement of stone size: An in vitro and clinical study. J Urol 2009;181:1710–1715 [DOI] [PubMed] [Google Scholar]
- 11.Ray AA, Ghiculete D, Pace KT, Honey RJD. Limitations to ultrasound in the detection and measurement of urinary tract calculi. Urology 2010;76:295–300 [DOI] [PubMed] [Google Scholar]
- 12.Fowler KAB, Locken JA, Duchesne JH, Williamson MR. US for detecting renal calculi with nonehnanced CT as a reference standard. Radiology 2002;222:109–113 [DOI] [PubMed] [Google Scholar]
- 13.Chen P, Chen M, Leung T, et al. Effect of image settings on nuchal translucency thickness measurements by a semi-automated system. Ultrasound Obstet Gynecol 2012;39:169–174 [DOI] [PubMed] [Google Scholar]
- 14.Potter K, Reed C, Green D, et al. Ultrasound settings significantly alter arterial lumen and wall thickness measurements. Cardiovasc Ultrasound 2008;22:1–11 [DOI] [PMC free article] [PubMed] [Google Scholar]
- 15.Duan X, Wang J, Qu M, et al. Kidney stone volume estimation from computerized tomography images using a model based method of correcting for the point spread function. J Urol 2012;188:989–995 [DOI] [PMC free article] [PubMed] [Google Scholar]