Abstract
Aim:
The aim was to construct a visual acuity chart and find its effectiveness at screening visual acuity deficits.
Materials and Methods:
Two phases were involved in this study. Construction of the screener: Ten Sloan letters (C, D, H, K, N, O, R, S, V, and Z) were selected and the letters were constructed and reduced to 0.2 logMAR acuity size (6.92 mm) for viewing at 3 m. The screener contains three lines with seven letters in each. Few combinations of the seven letter sequences were chosen based on the row legibility scores. Three seven letter combinations close to the median of all combinations were selected, such that maximum difficulty score difference between the lines are <1%. Finding the effectiveness of the screener: 100 literate subjects with unaided visual acuity better than or equal to 6/60 were recruited for the study. Unaided visual acuity was tested using both the newly constructed Pocket Vision Screener and a logMAR visual acuity chart and the time taken to measure the visual acuity using both the charts was noted.
Results:
The mean age of the subjects was 43 ± 17 years. Subjects were classified as normal or deficient based on the logMAR visual acuity measurement. The screener was found to have 81% sensitivity, 94% specificity. The positive and negative predictive values were found to be 91% and 87%, respectively. A significant difference (P < 0.001) was found in the time taken to record visual acuity using both the charts.
Conclusion:
The Pocket Vision Screener can be used as a quick and accurate tool to screen subjects for visual acuity deficits, being highly sensitive, specific, and cost-effective.
Keywords: Crowding, logMAR chart, refractive error, screening, visual acuity
World Health Organization (WHO) estimates that nearly 285 million people in the world are visually impaired. Of these, 39 million are estimated to be blind. About 80% of this visual impairment are avoidable.[1] Visual impairment due to infectious diseases has declined but longer life expectancy has resulted in an increase in the number of people becoming visually impaired due to age-related disease.
In India, blindness has been recognized as an important public health problem.[2] Uncorrected refractive error is estimated to be the major cause of low vision and the second most prevalent cause of blindness.[3] Some of the ocular diseases if not detected and treated early could lead to permanent vision loss.
Measurement of visual acuity is usually the first step in the evaluation of the visual system. Hence, visual acuity is also used as the first filter in any vision screening program. A cut off of <6/9 in either eye is used to define abnormal vision in India. Children failing this test are referred for further evaluation.[4] Many charts using different types of targets or optotypes are available for measuring visual acuity.[5] However, charts of these types would be too time-consuming to be of much use in large scale vision screening programs, where more number of people are required to be screened in a given time. We have designed a compact chart for screening general population incorporating logMAR chart design principles. This chart, which we named the “Pocket Vision Screener,” aids in quick and accurate screening for visual acuity deficits.
Materials and Methods
The study was done by following the tenets of declaration of Helsinki and as per the protocol of Vision research foundation.
Selection of letters and construction of the chart
Modern chart construction uses the principles of geometric progression of letter sizes, usage of letters of equal legibility, and normalization of crowding.[6] The 10 Sloan letters [C, D, H, V, R, N, S, O, K, and Z] are known to have equal legibility. They are also considered to be equivalent to the gold standard Landolt C optotype.[7] The Early Treatment Diabetic Retinopathy Study (ETDRS) charts were constructed using these ten Sloan letters and logMAR construction design.[8]
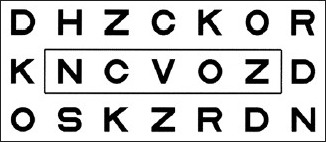
The Pocket Vision Screener reported in this study was also constructed using the Sloan letters. The screener contains three lines with seven letters in each line. The task for the subject would be to read the middle five letters in the middle line [Fig. 1]. The central five letters in each line were created using the letters in the 6/9 line of the ETDRS charts. The remaining two letters were randomly chosen from the Sloan letters. Multiple combinations of these seven letter sequences were generated. From these, only those combinations that differed in their row legibility values by at most 1% were used for the construction of the chart. Row legibility values were calculated by adding up the legibility scores of the individual letters in that line. These calculations were done using the difficulty scores given by Sloan.[7]
Figure 1.

A version of the Pocket Vision Screener. The subject's task is to read the letter NCVOZ from a distance of 3 m. The box is included in this picture for clarity; it does not appear in the Pocket Vision Screener
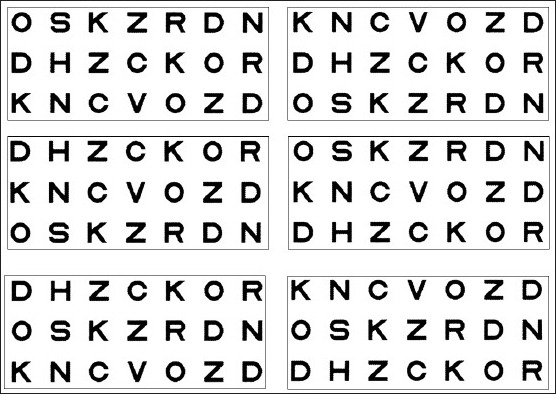
Six versions of the screener were constructed. Two of these had the middle line with letters chosen from the ETDRS chart 1, two with letters chosen from ETDRS chart 2 and two from ETDRS chart R. The two charts with the same middle line had their first and third lines interchanged [Fig. 2].
Figure 2.

The six versions of the Pocket Vision Screener. Each row has the same middle line. In each row, the left and right screeners have their first and the third lines interchanged
Each of the 10 Sloan letters were constructed separately on a 5 × 5 grid using the image processing software Adobe Photoshop 7.0 (Adobe Systems, Inc, California, USA). The size of the letters was calculated to be 6.92 mm × 6.92 mm for viewing at 3 m distance corresponding to a logMAR visual acuity of 0.2 (or approximately 6/9 Snellen acuity). The letters were arranged using the software CorelDraw 10 (Corel Corporation, Ontario, Canada). The spacing between the rows and the spacing between adjacent letters in a row were set equal to 6.92 mm (the letter size). The letters were printed as black letters on a white background. The white background was extended to one letter size on all the four sides; beyond this the screener was completely black. The overall size of the screener was 12 cm (width) ×6.2 cm (height). It is an externally illuminated chart intended to be used in a standard illumination of 130–215 lux. The screeners were printed on a 250 gsm, matt finished paper using a laser printer with the cost of production INR 10.
Effectiveness of the Pocket Vision Screener
Subjects were recruited from the Outpatient Department of the Rural Eye Hospital, Sankara Nethralaya, Chennai. One hundred consecutive patients who could read English alphabets and who had unaided visual acuity better than or equal to 6/60 so as to exclude people with severe visual impairment. Consecutive patients visiting the optometrist room, which was standardized for testing and who met the required criteria were included in the study. After obtaining oral consent from the subjects, unaided visual acuity was tested by a trained optometrist using both the newly constructed Pocket Vision Screener and logMAR visual acuity chart. All visual acuity testing was performed by a single examiner. For each subject, right eye was chosen as the testing eye and the other eye was occluded. The chart to be read first was chosen randomly. The randomization was done using the pseudo-random number generator in Microsoft Excel. Subjects were seated at a distance of 3 m from the chart. In the case of visual acuity measurement using the logMAR chart, the subjects were instructed to read from the top left and stop reading until they were not able to read anymore letters. Every correctly read letter was assigned a score of 0.02 and every incorrectly read or unread letter was assigned a score of 0.00. Visual acuity (logMAR) for each subject was determined using the formula:
VA (logMAR) =1.1–0.02 × number of correctly read letters
In the case of the Pocket Vision Screener, the subjects were instructed to read all the letters in the middle line. Correct response of any three letters out of the middle five in the middle line was considered to have passed the screening as more than 50% of the letters were rightly identified. The time taken to measure visual acuity was recorded using a stopwatch for both the logMAR chart and Pocket Vision Screener.
Data analysis was done using Microsoft Office Excel 2003 (Microsoft) and SPSS version 12.0 (SPSS Inc.).
Results
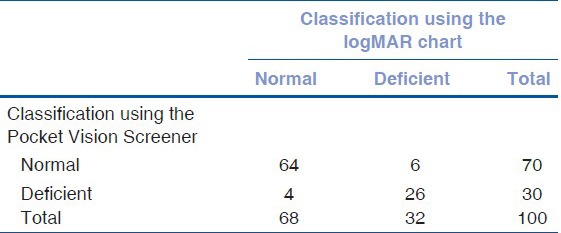
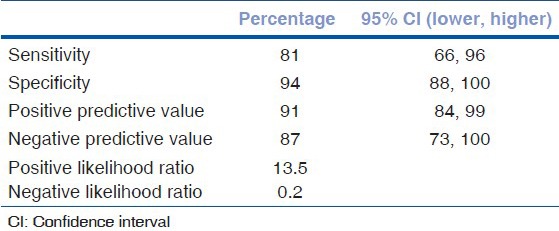
There were 100 subjects of whom 57 were male. The age of the subjects ranged from 7 to 71 years (43 ± 17 years). We tested the ability of the Pocket Vision Screener to correctly identify visual acuity deficits. Anyone who could not read correctly three letters of the middle five in the middle line were considered to have a visual acuity deficit. Similarly, for the logMAR chart, anyone who had a visual acuity logMAR value >0.24 was considered to a visual acuity deficit. Subjects were classified as normal or deficient based on the logMAR visual acuity measurement. Constructing the 2 × 2 truth table [Table 1], the sensitivity, specificity, positive and negative predictive values, and likelihood ratios of the Pocket Vision Screener in correctly classifying the subjects were calculated [Table 2]. The sensitivity and specificity were found to be 81% and 94%, respectively. The positive and negative predictive values were found to be 91% and 87%, respectively.
Table 1.
Truth table for the measurement made with the Pocket Vision Screener

Table 2.
Sensitivity, specificity, positive and negative predictive value, positive and negative likelihood ratio for the Pocket Vision Screener in correctly classifying subjects

The time taken by both the methods was compared using Wilcoxon signed rank test as recorded times did not fall under a normal distribution. There was a significant difference (P < 0.001) in the time taken to measure visual acuity comparing charts, with the Pocket Vision Screener taking less time [Table 3].
Table 3.
Time taken for the logMAR chart and the Pocket Vision Screener

Discussion
Screening is defined as “The systematic application of a test or inquiry, to identify individuals at sufficient risk of a specific disorder to warrant further investigation or direct preventive action, among persons who have not sought medical attention on account of symptoms of that disorder.”[9] A screening test is said to be valid depending on the frequency with which the result of the test is confirmed by a gold-standard diagnostic procedure. An ideal test should have the ability to classify persons with disease as positives (sensitivity) and those without the disease as negatives (specificity).[10] Sensitivity and specificity can be varied reciprocally, according to the setting, that is, the cut-off value used for further referral. Above 90% of specificity are usually used in school vision screening programs in view of the cost involved in confirmatory examinations.[10] The Pocket Vision Screener meets these qualities as it is efficient in detecting those with visual acuity worse than 6/9 (sensitivity) and ruling out those who do not have defective visual acuity (specificity). It is highly acceptable and subject-friendly, as it can be administered with ease, and consumes less time.
Population-based studies from India show that among children in the age group of 7–15 years, the prevalence of uncorrected visual acuity of 6/12 or worse in the better eye is 6.4% in the urban population and 2.7% in the rural population, and the prevalence of best-corrected visual acuity worse than 6/12 among the same population was 0.81% and 0.78%, respectively.[10,11] Refractive errors were the leading cause of visual impairment in 61% of eyes in rural population and 81.7% of eyes in urban population with amblyopia being the second major cause in both populations.[11,12] As estimated by Naidoo et al., 5% of the school children between 6 and 20 years had refractive error.[13] When provided with appropriate refractive services and spectacles, 70% of all children in the rural areas who had baseline visual acuity worse than 6/12 and 80% of children from urban population were found to benefit.[11,12] Dandona and Dandona 2006 estimated that the total number of persons with visual impairment worldwide, including that due to uncorrected refractive error was 259 million, 61% higher than the WHO estimate.[14]
The current ophthalmologist to population ratio in India is estimated to be nearly 1:100,000.[15] 115,000 4-year trained optometrists are required to meet the demand of providing comprehensive care to all the people in the country.[16] There is a huge burden of providing eye care services in India, as the number of eye care providers is insufficient for the population. Novel initiatives such as training teachers to screen school children have shown to reduce the workload of eye care specialists. However, the false positive rates were found high among those referred by teachers.[17,18] Considering the simplicity of instructions and less time required for administration, the model of training teachers and other volunteers could be tried in future.
Low cost of production, compact size, ease of use, and the less screening time makes this screener an ideal tool for mass vision screening.
Conclusion
The Pocket Vision Screener is highly sensitive and specific and has a good positive and negative predictive value. Therefore, this can be used as quick and accurate tool to screen subjects with visual acuity worse than 6/9. The Pocket Vision Screener is a compact and simple tool to use in addition to being very cost effective.
Acknowledgment
Mr. N. R. Raj Kumar, Ms. P. Sakunthala.
Footnotes
Source of Support: Medical/Vision Research Foundation, Chennai
Conflict of Interest: None declared.
References
- 1.Visual Impairment and Blindness. World Health Organisation, Fact Sheet No. 282. [Last updated on August 2014; Last cited on 2014 Feb 10]. Available from: http://www.who.int/mediacentre/factsheets/fs282/en/
- 2.Murthy GV, Gupta SK, Bachani D, Jose R, John N. Current estimates of blindness in India. Br J Ophthalmol. 2005;89:257–60. doi: 10.1136/bjo.2004.056937. [DOI] [PMC free article] [PubMed] [Google Scholar]
- 3.Resnikoff S, Pascolini D, Mariotti SP, Pokharel GP. Global magnitude of visual impairment caused by uncorrected refractive errors in 2004. Bull World Health Organ. 2008;86:63–70. doi: 10.2471/BLT.07.041210. [DOI] [PMC free article] [PubMed] [Google Scholar]
- 4.Murthy GV. Vision testing for refractive errors in schools: ‘screening’ programmes in schools. Community Eye Health. 2000;13:3–5. [PMC free article] [PubMed] [Google Scholar]
- 5.Bailey IL. Visual Acuity. In: Benjamin WJ, editor. Borish's Clinical Refraction. 2nd ed. Missouri: Butterworth Heinemann Elsevier; 2006. p. 229. [Google Scholar]
- 6.Bailey IL, Lovie JE. New design principles for visual acuity letter charts. Am J Optom Physiol Opt. 1976;53:740–5. doi: 10.1097/00006324-197611000-00006. [DOI] [PubMed] [Google Scholar]
- 7.Sloan LL. New test charts for the measurement of visual acuity at far and near distances. Am J Ophthalmol. 1959;48:807–13. doi: 10.1016/0002-9394(59)90626-9. [DOI] [PubMed] [Google Scholar]
- 8.Ferris FL, 3rd, Kassoff A, Bresnick GH, Bailey I. New visual acuity charts for clinical research. Am J Ophthalmol. 1982;94:91–6. [PubMed] [Google Scholar]
- 9.Gray M, Troop P. National Screening Committee, Health Departments of the United Kingdom. 1998 Apr [Google Scholar]
- 10.Wilson JM, Jungner G. World Health Organization. Geneva: World Health Organization; 1968. Principles and Practice of Screening for Disease. Public Health Papers, No 34. [Google Scholar]
- 11.Murthy GV, Gupta SK, Ellwein LB, Muñoz SR, Pokharel GP, Sanga L, et al. Refractive error in children in an urban population in New Delhi. Invest Ophthalmol Vis Sci. 2002;43:623–31. [PubMed] [Google Scholar]
- 12.Dandona R, Dandona L, Srinivas M, Sahare P, Narsaiah S, Muñoz SR, et al. Refractive error in children in a rural population in India. Invest Ophthalmol Vis Sci. 2002;43:615–22. [PubMed] [Google Scholar]
- 13.Naidoo K, Ravilla D. Delivering refractive error services: Primary eye care centres and outreach. Community Eye Health. 2007;20:42–4. [PMC free article] [PubMed] [Google Scholar]
- 14.Dandona L, Dandona R. What is the global burden of visual impairment? BMC Med. 2006;4:6. doi: 10.1186/1741-7015-4-6. [DOI] [PMC free article] [PubMed] [Google Scholar]
- 15.Thomas R, Paul P, Rao GN, Muliyil JP, Mathai A. Present status of eye care in India. Surv Ophthalmol. 2005;50:85–101. doi: 10.1016/j.survophthal.2004.10.008. [DOI] [PubMed] [Google Scholar]
- 16.De Souza N, Cui Y, Looi S, Paudel P, Shinde L, Kumar K, et al. The role of optometrists in India: An integral part of an eye health team. Indian J Ophthalmol. 2012;60:401–5. doi: 10.4103/0301-4738.100534. [DOI] [PMC free article] [PubMed] [Google Scholar]
- 17.Nirmalan PK, Katz J, Robin AL, Krishnadas R, Ramakrishnan R, Thulasiraj RD, et al. Utilisation of eye care services in rural south India: The Aravind comprehensive eye survey. Br J Ophthalmol. 2004;88:1237–41. doi: 10.1136/bjo.2004.042606. [DOI] [PMC free article] [PubMed] [Google Scholar]
- 18.Sudhan A, Nirmalan PK, Katz J, Robin AL, Krishnadas R, Ramakrishnan R, et al. Effectiveness of using teachers to screen eyes of school going children in Satna district of Madhya Pradesh, India. Indian J Ophthalmol. 2009;57:455–58. doi: 10.4103/0301-4738.57157. [DOI] [PMC free article] [PubMed] [Google Scholar]


