Abstract
This paper models and experimentally measures the acoustic interference from two low intensity 3MHz continuous ultrasound transducers of the sam® wearable ultrasound device. Resulting data show that placement configuration, which dictates interference depth, and frequency phase variation are the main factors to acoustic pressure distribution. Mathematical analysis reveals that the acoustic pressure distribution from continuous ultrasound is modulated by near field variations at shallow tissue depths. This observation is useful in the application of sam® and in the further research of its therapeutic benefits.
I. Introduction
Therapeutic ultrasound used for diathermy preferably uses continuous mode ultrasound for sustained heating [1, 2]. However, in continuous mode, ultrasound therapy has a potential to generate standing-waves and interference patterns in tissue. Ultrasonic interference typically increases the pressure peaks of an acoustic field leading to increased sensations of heat, tingling, and in some cases mild pain [3]. This is also the result of standing waves, the addition of two or more acoustic pressures arriving at one location in the interference pattern. In the case of applying two or more continuous transducers to the same anatomical region, the presence of interference and standing wave patterns infers nonhomogeneous heating (and treatment) of soft tissues. Anatomical placement configuration and phase difference between two transducers are key factors in the overall physiological effect of ultrasonic interference pressures.
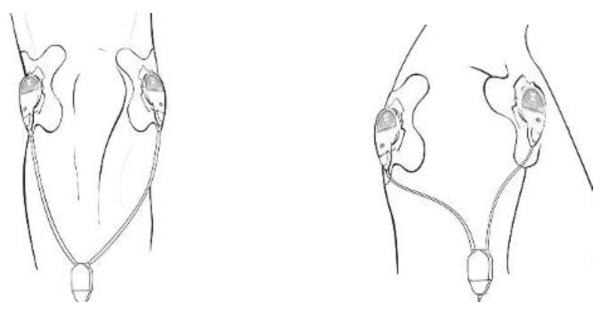
The importance of configuration can be demonstrated by mathematical modeling and ultrasonic beam scanning via hydrophone measurement of two sam® Applicators, drawn in Fig. 1. The sam® Applicator is the first FDA cleared class II device to provide continuous ultrasound therapy for four consecutive hours. Two sam® Applicators can be worn on one anatomical region, introducing interference. The sam® Applicators have low intensity (less than 0.2 W/cm2) 3MHz ± 20% frequency 5°divergent, ultrasonic transducers. The modeling and hydrophone measurements examine the acoustic interference pattern in overlapping ultrasonic beams from two sam® Applicators separated by 6 cm (center to center) and in the following configurations: rotated 30°, 60°, and 90° to each other. This range of angles is representative of possible configurations when treating a limb.
Figure 1.

Taken from the sam® user manual, these images show the application of dual sam® applicators on the knee and shoulder.
Fig. 2 depicts an example of the separation and rotation configuration. Ultrasonic beam measurements by hydrophone are done for the same configurations. Additionally, mathematical modeling considers completely in-phase and out-of-phase transducers.
Figure 2.

In this diagram, rectangles indicate a cylindrical transducer from a side view. The rotation angle is incident from a line parallel to the flat side of the transducer where ultrasound propagates. Center to center distance is always 6 cm, 2.5 cm less than the recommended with sam® Applicators.
II. Ultrasonic Modeling
A. Designing the Model
Models are simulated in Mathcad engineering calculation software. The parameters of the simulation apply the wave equation and model ultrasound traversing through a lossless medium [4]. Absorption is ignored to consider the worst case. Transducers can be programmed for any frequency, divergence, and phase. The simulation plots acoustic pressure at depth and width from two transducers that were configured to face each other at 30°, 60°, and 90° rotations.
B. 30° Configuration
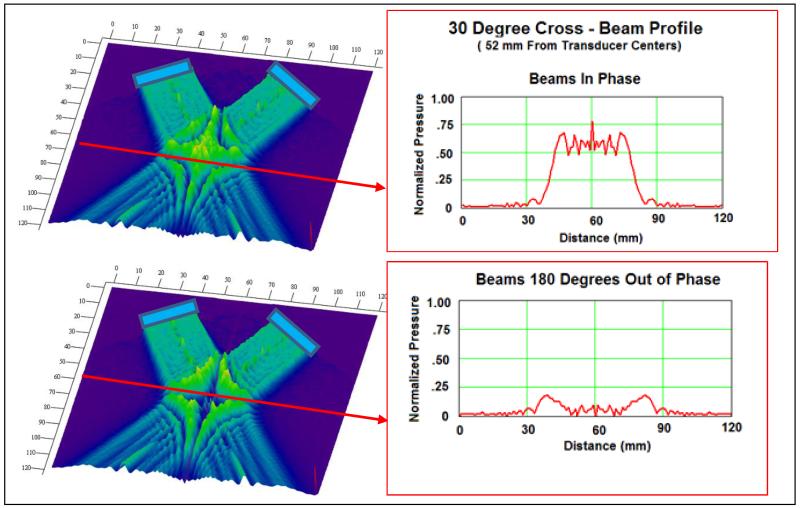
The 30° rotation of two transducers toward each other creates an overlapping beam region centered at 5.2 cm in depth. In this region, the interference pressures are dependent on the phase of the two transducers. Fig. 3 highlights this by graphing normalized acoustic pressure at cross-sectional depth of 52 mm from the centers of the transducers. Transducers with frequency in-phase create the maximum constructive pressure intensities while out-of-phase transducers generate minimal pressure intensities.
Figure 3.
Mathcad modeling generates the images of acoustic pressure from two transducers (indicated by blue rectangles) rotated 30° towards each other. The interference region is brightest green and appears roughly 52 mm from the center of the transducers. At a cross-sectional depth (indicated by a red arrow), the pressure over width plots are shown for both in-phase and out-of-phase transducer pairs. The out-of-phase interference pressures are notably less than the in-phase.
C. 60° Configuration
At 60° rotation, the transducer frequency phase has much less impact on the interference pressures. Fig. 4 shows that the in-phase and out-of-phase transducer pairs both generate approximately 50% of the pressure, normalized to data peak. The overlapping beam region is centered less in depth, appearing at approximately 1 cm in depth and closer to the transducer centers.
Figure 4.
In these plots, Mathcad modeling two transducers rotated at 60° towards each other. Compared to the 30° configuration, the interference region is only 17mm in depth from the center of the transducer. And the difference between in-phase and out-of-phase cross-sectional graphs of pressure over width is much less pronounced; pressure varies around a normalized 0.45 pressure regardless of phase.
D. 90° Configuration
A 90° (face-to-face) rotation creates acoustic interference in the entire region between the two sam® Applicators. When in-phase, the two transducers can generate maximum pressures along the center axis that are twice the pressure of a single transducer, but only at standing wave peaks. The remaining region is approximately the pressure of a single transducer. When out-of-phase, destructive interference occurs at most of the overlapping beam region, with maximum pressure along the center axis reaching the pressure of a single transducer.
E. Modeling Discussion
Phase affects interference patterns differently for each configuration. This difference is attributed to the change in behavior of ultrasound beams at the near and far fields. The near field has additional acoustic pressure variation due to its proximity to the transducer where constructive and destructive interference predominate [5]. The ultrasound beam will not form a relatively uniform wave front until it reaches the far field. Therefore, ultrasound beam regions nearer to the transducers are more variable and more conducive to interference. The random variations of the near field disrupt the ability of the waveforms from each transducer to combine together to enhance a local pressure, independent of phase.
Two actual transducers will not likely be entirely in-phase or out-of-phase. Their interference pressures will be between modeled in-phase and out-of-phase transducers.
III. Ultrasonic Experimental Measurements
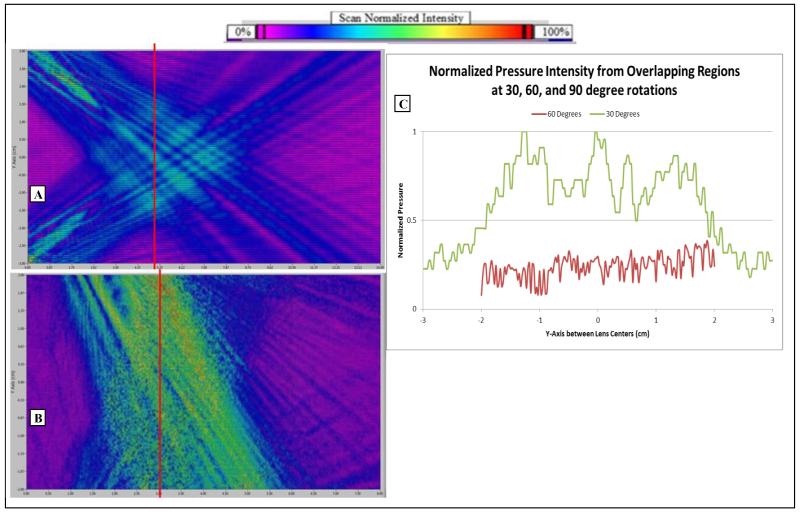
For ultrasonic field mapping of the dual sam® applicators, a 1 mm hydrophone probe from precision acoustics is attached to motors that drive a raster scan in width and depth measuring acoustic pressure. Scan resolution was small enough to meet the Nyquist limit of the transducer frequencies. The two sampled sam® Applicators have average intensity of 0.132 W/cm2 and frequency of 3MHz ± 20%. They are configured 6 cm apart (from transducer center), submerged in a water tank filled with deionized and degassed water, and scanned in a plane that reflects the models. The results for the 30° and 60° configurations are imaged in Fig. 5.
Figure 5.
(A) This image displays the pressure intensity data in a 6 cm by 14 cm plane between two 3MHz transducers rotated 30° to each other. (B) This image is 4 cm by 8 cm between the same transducers now rotated at 60° to each other. The images display the beam scan data as color coded pressure intensity, with red/green intensities greater than blue/indigo. Transducers were located at the top and bottom left corners of the scans. (C) The graph shows the cross-sectional pressures (taken at the red lines of the beam scans) of the interference regions of both scans. 30° configuration shows significantly greater interference pressure intensities.
A. 30° Configuration Scan
A scan of 6 cm in width and 14 cm in depth captured the interference region between the two transducers. The resolution in depth and width is 0.5 mm. The center of the inference region is approximately 5 cm in depth, similar to the modeling. A mesh-like pattern of interference is noticeable in the scan.
B. 60° Configuration Scan
For 60° rotated transducers, the 0.25 mm resolution scan was smaller in dimension: 4 cm in width and 8 cm in depth (starting the scan above the sam® Applicators). The width was limited because the transducers obstructed the pathway of the hydrophone; the scan range still captures the majority of the interference region between the two transducer pressure fields. No interference pattern is easily detected, suggesting the acoustic variation and noise of the near field.
C. 90° Configuration Scan
For 90° rotated transducers, the 0.25 mm resolution scan was 5 cm in width and 6 cm in depth. Again, obstruction of the hydrophone prevented a larger measurement range. Like the modeling, the center axis has the greatest pressure. There is some indication of standing wave peaks, but they do not reach twice the pressure of a single transducer as with the modeling.
D. Discussion
Included in Fig. 5 is a cross-sectional graph of the normalized pressure taken at the estimated center of the interference region. The central pressures from the 30° configuration interference are three to four times greater than the 60° configuration interference. However, the depth of the interference is also deeper with a 30° configuration: 5 cm to approximately 1 cm with a 60° configuration.
IV. Comparing Models to Measurements
The Mathcad models were better able to predict interference patterns for the 30° configuration. The 30° scan has a cross-sectional interference that is shaped closely to the 30° in-phase model. This suggests the sam® Applicators are nearly in phase. The 60° versions do not compare as reliably; the model is an ideal transducer while the sam® Applicators have more random acoustic variations in the near field. However, the model’s characteristic lack of interference peaks and valleys is suggested in the real scan. The 90° data also has pressure increases from interference that are similar in shape to the out-of-phase model. These comparison observations can be viewed in Fig. 6.
Figure 6.
In these graphs, the blue plot represents the normalized cross-sectional beam scan data from Fig. 5 and the red plot represents the normalized cross-sectional beam scan data from Fig. 3 and Fig. 4. The 30° configuration beam measurement data conforms well to the overall shape of the model. For 60° configuration, the similarities are limited by the variations in the near field. The 90° configuration (which is not imaged in this paper) shows that some standing wave interference pattern is recognizable from the model.
V. Conclusion
Results from mathematical modeling can be closely identified in the experimental measurement. The most pronounced similarities occur for the 30° configuration, where it is hypothesized that the deep interference region is far removed from the near field acoustic variations. The 60° and 90° configurations showed that the near field is not conducive to constructive and destructive standing waves. When considering interference from dual sam® applicators, the proximity of the interference region to the transducers is an important factor and can dictate the best dual sam® Applicator placement on the body. Also, because modeling was similar to experimental measurement, further research can rely on modeling instead of time consuming hydrophone measurements. Because all models were simulated in a lossless homogeneous media, only the worst case scenarios were examined. In clinical use, innate heterogeneities of biological anatomies create attenuation, scattering, and reflection of the propagating acoustic fields, mitigating interference pressures in vivo.
Acknowledgments
Research reported in this publication was supported by the National Institute On Minority Health And Health Disparities of the National Institutes of Health under Award Number R43MD008597. The content is solely the responsibility of the authors and does not necessarily represent the official views of the National Institutes of Health.
References
- [1].Rigby JH, Draper DO, Taggart RM, Stratton KL, Lewis GK. Intramuscular Heating Effect Produced by Long Duration Continuous Low Intensity Therapeutic Ultrasound (LITUS) Med Sci Sports Exerc. 2014;46(5) Supplement. [Google Scholar]
- [2].Draper DO, Castel JC, Castel D. Rate of temperature increase in human muscle during 1 MHz and 3 MHz continuous ultrasound. J Orthop Sports Phys Ther. 1995;22(4):142–150. doi: 10.2519/jospt.1995.22.4.142. [DOI] [PubMed] [Google Scholar]
- [3].Baker KG, Robertson VJ, Duck FA. A Review of Therapeutic Ultrasound: Biophysical Effects. Physical Therapy. 2001;81(7):1351–1358. [PubMed] [Google Scholar]
- [4].Bushberg JT, Seibert JA, Leidholdt EM, Jr, Boone JM. The Essential Physics of Medical Imaging. 3rd ed. 2011. ch 14.4. [Google Scholar]
- [5].Jensen JA. A model for the propagation and scattering of ultrasound in tissue. Acoustical Society of America. Journal. 1991;89(1):182–190. doi: 10.1121/1.400497. [DOI] [PubMed] [Google Scholar]


