Abstract
BACKGROUND/OBJECTIVES
While upper airway obstruction is a common problem in the pediatric population, the first-line treatment, adenotonsillectomy, fails in up to 20% of patients. The decision to proceed to surgery is often made without quantitative anatomic guidance. We evaluated the use of a novel technique, long-range optical coherence tomography (LR-OCT), to image the upper airway of children under general anesthesia immediately before and after tonsillectomy and/or adenoidectomy. We investigated the feasibility of LR-OCT to identify both normal anatomy and sites of airway narrowing and to quantitatively compare airway lumen size in the oropharyngeal and nasopharyngeal regions pre- and post-operatively.
METHODS
46 children were imaged intraoperatively with a custom-designed LR-OCT system, both before and after adenotonsillectomy. These axial LR-OCT images were both rendered into 3D airway models for qualitative analysis and manually segmented for quantitative comparison of cross-sectional area.
RESULTS
LR-OCT images demonstrated normal anatomic structures (base of tongue, epiglottis) as well as regions of airway narrowing. Volumetric rendering of pre- and post-operative images clearly showed regions of airway collapse and post-surgical improvement in airway patency. Quantitative analysis of cross-sectional images showed an average change of 70.52mm2 (standard deviation 47.87mm2) in the oropharynx after tonsillectomy and 105.58mm2 (standard deviation 60.62mm2) in the nasopharynx after adenoidectomy.
CONCLUSIONS
LR-OCT is an emerging technology that rapidly generates 3D images of the pediatric upper airway in a feasible manner. This is the first step toward development of an office-based system to image awake pediatric subjects and thus better identify loci of airway obstruction prior to surgery.
Introduction
Sleep disordered breathing is well recognized in children, with the spectrum ranging in severity from primary snoring to obstructive sleep apnea (OSA) [1, 2]. OSA affects up to 3% of children and is characterized by a combination of partial and complete airway obstruction that disrupts normal ventilation during sleep [1, 2]. Diagnosis and treatment of OSA are of importance because of significant co-morbidities in children, including neurocognitive disturbances and cardiovascular dysfunction [3-12].
Adenotonsillar hypertrophy is a leading contributor to the development of pediatric OSA, and while adenotonsillectomy remains the first-line intervention, it fails in up to 20% of patients [1, 13]. The decision to proceed with surgery is based on clinical judgment, most often without any quantitative anatomic guidance. Computed tomography (CT) and cine magnetic resonance imaging (MRI) are not routinely ordered due to cost, radiation exposure, and/or need for sedation [14-17]. Knowing the internal structure of the upper airway is critical in patients where clinical judgment has limited reliability or in children with comorbidities that make identifying the location of obstruction(s) a challenge (e.g., craniofacial deformities). In these more subtle and challenging cases, it would be especially beneficial for clinicians to have an in-office system that could either verify adenotonsillar hypertrophy as the source of symptoms, or identify other regions of the upper airway contributing to the obstruction, with the intention of better predicting outcomes and reducing treatment failure.
Recently, long-range optical coherence tomography (LR-OCT) has been developed to image the airway via transnasal placement of an optical fiber assembly [18-20]. LR-OCT is a variation of traditional optical coherence tomography which uses time-of-flight measurements for coherent photons to determine the distance between a fiber tip and a target surface [21]. These measurements have been previously compared to CT images and known-diameter models to demonstrate accuracy [18-20, 22, 23]. LR-OCT can be used to identify air-tissue interfaces across long distances (~3-10 cm) [24, 25]. Incorporating a rotary fiber optic system with linear pullback, information about the structure of hollow viscera in the human body can be obtained. There is no ionizing radiation exposure. With LR-OCT imaging, the entire airway can be scanned from hypopharynx to nare in approximately 20-40 seconds, making this an efficient method of studying upper airway anatomy [26].
This study involved the use of LR-OCT to image the pediatric upper airway (from pyriform sinus to choana) in children undergoing tonsillectomy and/or adenoidectomy. The LR-OCT study was performed both immediately before and after the surgery under general anesthesia. We investigated the feasibility of LR-OCT to identify both normal anatomy and sites of airway narrowing. The axial LR-OCT images were used to quantitatively compare airway lumen size in the oropharyngeal and nasopharyngeal regions pre- and postoperatively. The spiral LR-OCT scans were used to construct pre- and post- operative 3D models of the pediatric upper airway, which were evaluated qualitatively. This is the first large-scale evaluation of LR-OCT use in the pediatric upper airway and is a critical first step towards using this technology to precisely identify airway obstruction in awake children.
Methods
Study Subjects
Children undergoing adenotonsillectomy (n=29), adenoidectomy (n=16), or tonsillectomy alone (n=1) were imaged under the aegis of the Human Subjects Institutional Review Boards at Children's Hospital of Orange County and the University of California, Irvine. Informed consent was obtained from parents prior to surgery. All studies were performed at Children's Hospital of Orange County. Inclusion criteria included any child undergoing tonsillectomy and/or adenoidectomy. Exclusion criteria included patients with craniofacial disorders or syndromic abnormalities such as Down syndrome or the facio-auriculo-vertebral spectrum.
Frequency Domain Long-Range Optical Coherence Tomography
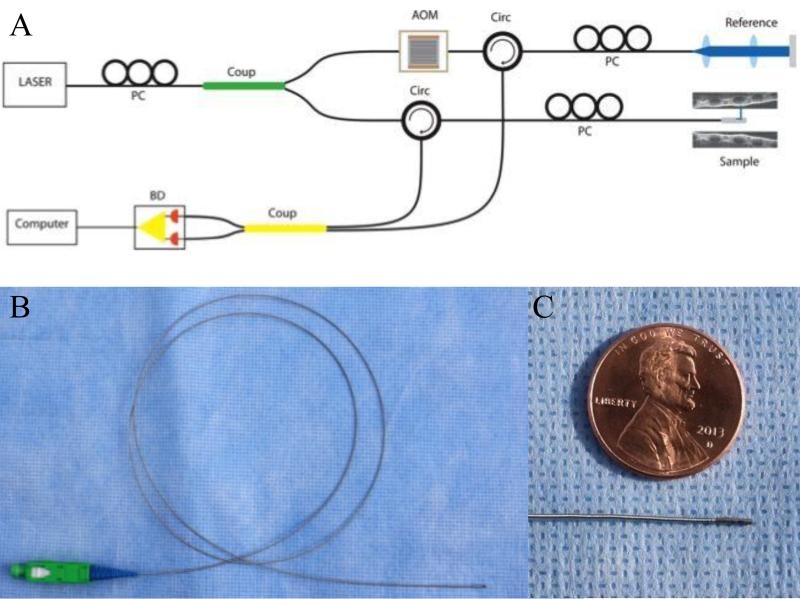
The LR-OCT system used in this study (Figure 1A) has been described previously [26]. It is a frequency domain swept source OCT system with axial resolution of 10 μm in tissue. The lateral resolution at the focal point of the probe is 112 μm [26].
Figure 1.
A) Schematic of LR-OCT system. PC=Polarization controller, Coup=Coupler, AOM=Acousto-optic modulator, Circ=Circulator, BD=Balanced detector. B) 0.7-mm optical imaging probe. C) Enlarged view of the probe tip.
Imaging probes consisted of a single-mode optical fiber contained within a 2-layer metal torque coil and terminated with a gradient refractive index (GRIN) lens. Attached at the distal end is a prism to reflect light perpendicular to the long axis of the fiber [27]. Fiber and torque coil freely moved within a protective single-use fluorinated ethylene propylene (FEP) sheath (Zeus Inc., Orangeburg, South Carolina). The probe was rotated at the proximal end via an external motor (Faulhaber, Switzerland) at a rate of 25 or 12.5 revolutions per second (RPS). Probes were custom assembled and ranged in length from 60 cm to 90 cm. FEP sheaths were cut to fit each probe length-wise and closed with heat at the distal end to create a hermetic seal. Cross-sectional (axial) images were generated of the tissue-airway interface during scanning.
Two different sized probes were constructed for use. In the first 37 patients, a 1.2 mm fiber optic assembly was encased in a 2.08 mm outer diameter (OD) FEP sheath. This probe was designed to have a working distance of up to 20 mm. Working distance is defined as the radius of the imaging range, which is the farthest point the probe can image. In the subsequent 21 patients, we transitioned to using a 0.7mm OD probe within a 1.37mm OD FEP sheath as shown in Figure 1B-C. This 0.7mm OD probe has a working distance of up to 5-7mm. Although the earlier model, 1.2mm OD, probe was more durable and had a longer working distance, the value of using a smaller caliber, lower profile, probe for our imaging protocol was felt to be of paramount importance in keeping with our ultimate intent of using these probes in awake pediatric subjects.
In each image, the LR-OCT probe and sheath were visible. Both of these had a known diameter, which was used as a calibration standard to ensure accuracy of all airway measurements. The LR-OCT system is also regularly calibrated using known-diameter airway phantoms (PVC pipes) to ensure measurements are indeed accurate. Both hardware and software upgrades are implemented as necessary to refine the measurements.
Imaging Protocol
The sheath containing the imaging probe was inserted through a 14 French Robinson catheter that was introduced through the nose to the oropharynx. The catheter helped advance the more delicate FEP sheath/probe system through the nasal cavity and nasopharynx. The Robinson catheter was then removed via the mouth, and the sheath and imaging probe were guided to the esophageal introitus. The probe was rotated at 25 RPS and withdrawn via the linear translational stage at either 12.5mm/sec (generating images 500 μm apart) or 6.25 mm/sec (generating images 250 μm apart) while the FEP sheath remained in place. This allowed for multiple imaging passes without repeatedly re-inserting the sheath-probe system. For the last 5 cases, probe rotation speed was reduced to 12.5 RPS in an attempt to minimize friction artifact (see Image Quality Analysis section). Each imaging run spanned a distance of approximately 10-25 cm (from esophageal introitus to nare) and required only 20-40 seconds to complete, generating between 250 and 1000 cross-sectional images. Three imaging passes were completed pre-operatively. After imaging, the sheath was removed, the surgery performed, and the imaging repeated immediately after achieving hemostasis. Again, three passes were completed.
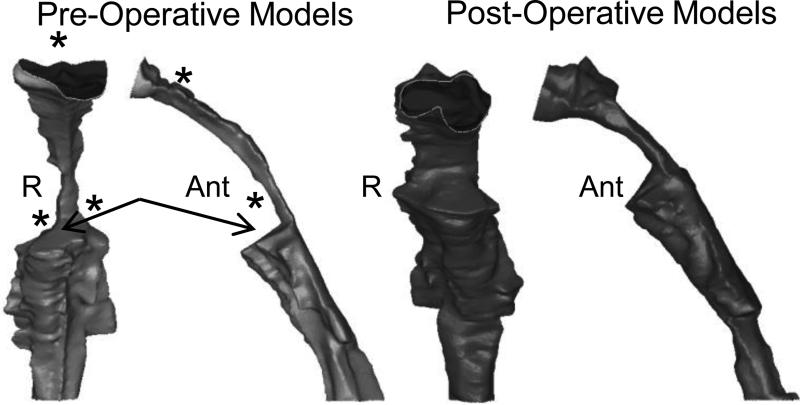
The limitations to this operating room study included significant pharyngeal tissue collapse during anesthesia and the presence of an endotracheal (ET) tube, which distorted anatomy to some degree. The presence of the ET tube created the forward-facing “shelf” or “step” seen in the 3D airway models in Figure 2. As noted in that figure, the ET tube stents open the caudal portion of the airway. As the ET tube flexes forward into the oral cavity and soft tissue collapses in its place, the airway appears considerably narrower, generating this “step.”
Figure 2.
Pre- and post-operative comparison of the UA of the same 20.1kg 7-year-old male with a diagnosis of upper airway obstruction and recurrent tonsillopharyngitis who underwent adenotonsillectomy. Both pre- and postoperative models are shown in coronal and lateral views. As expected, the postoperative airway is significantly more patent. Arrows point to the “step” present in these models. The children in this study were under general anesthesia and therefore intubated. As the ET tube flexes forward into the oral cavity, and the tonsils and other tissues collapse in its place, this “step” is generated. R=Right, Ant=Anterior
Image Processing and Analysis
Image Quality Analysis
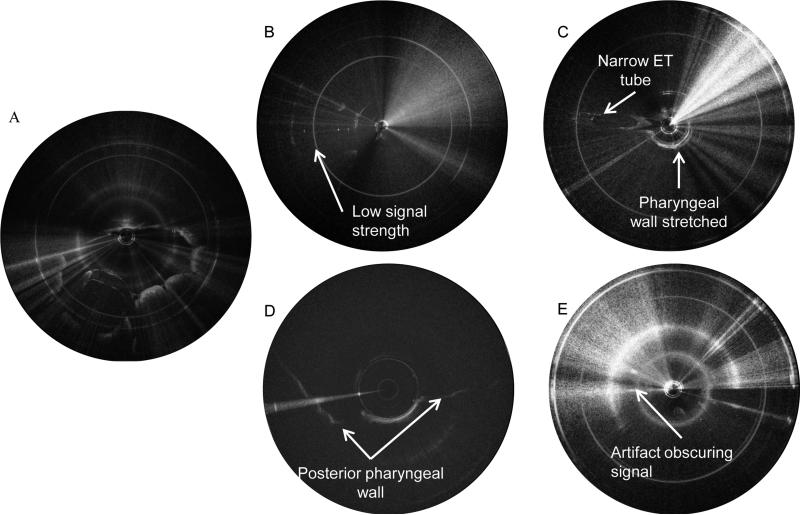
We analyzed each image set to determine quality. LR-OCT image quality was influenced by the following factors: 1) subpar probe quality (low signal intensity), 2) distortion due to non-uniform probe rotation, 3) airway size, 4) artifacts/noise, and 5) OCT technology. Figure 3A demonstrates a high-quality OCT image with strong signal intensity, no distortion due to non-uniform probe rotation, the entire tissue circumference lying within the image, and minimal specular reflection.
Figure 3.
A) Shows an example of a good-quality axial LR-OCT image. Note there is strong signal intensity along the full circumference of the tissue border, the entirety of the tissue border lies within the image, and there is minimal specular reflection. Figure 3B-E shows examples of poor-quality LR-OCT airway images. B) Shows an example of an image obtained with a probe with low signal strength. C) Shows significant distortion due to non-uniform probe rotation as a result of excessive tissue pressure on the probe sheath. Note how narrow the ET tube (left side of image) appears compared to the ET tube in A. D) Shows the majority of the tissue contour (anterior pharyngeal wall) beyond the range of the probe due to large airway size and eccentric probe placement. E) Shows an image with too much specular reflection to identify the tissue contour.
All probes are individually fabricated, which is a process that takes considerable skill and time. Probes are fragile and rotate very rapidly, so even with normal use, damage occurs and quality diminishes over time. Figure 3B shows an example of an image obtained with a subpar quality probe. The pharyngeal wall is difficult to identify. Our engineering team is actively engaged in improving probe quality and durability.
Distortion due to non-uniform probe rotation also occurred in some image sets. If a patient had very large tonsils or adenoids, or significant tissue collapse, the tissue mass compressed the FEP sheath, creating friction against the probe. This limited smooth rotation. Artifacts in the image were produced when the probe rotated slower as these frictional forces were first encountered and then faster as they were overcome. This limited the reliable identification of structures. Figure 3C demonstrates this distortion.
Another factor that influenced image quality was airway size. In some larger diameter airways (such as those found in older children or in the postoperative scans), if the probe was positioned eccentrically in the lumen, some sections of the pharyngeal wall were beyond the imaging range of the probe. An example of this can be seen in Figure 3D. In general, this was observed only over short segments of the airway, so the missing contour could be estimated by interpolating the contour from adjacent axial sections.
Next, artifacts can be present in LR-OCT images as a result of specular reflection. Figure 3E demonstrates a significant amount of specular reflection that limits identification of the pharyngeal wall. Our team is working on improving the LR-OCT software in order to minimize this noise.
Finally, as LR-OCT relies upon line-of-sight imaging, structures such as the epiglottis and ET tube limited visualization of the entire circumference of the airway. This is a fundamental limitation of LR-OCT technology.
Based on these factors, each data set was classified according to image quality. The highest quality axial data sets, defined as those with minimal distortion as described above, were rendered into 3D volumetric models and used for pre- and post-operative cross-sectional area (CSA) analysis of the tonsils/oropharynx and adenoids/nasopharynx. Rendering LR-OCT images into 3D models is a time-consuming and labor-intensive process, so we chose not to render any image sets that were less than stellar.
There were several image datasets that were not consistently high quality throughout the entire length of the airway, and therefore could not be rendered into 3D models. However, these image sets were adequate to identify key anatomic landmarks such as the tonsils and adenoids. These datasets were used only for CSA analysis of the tonsils/oropharynx and adenoids/nasopharynx pre- and post-operatively.
There were also many image sets that were not suitable for further analysis based on the reasons illustrated in Figure 3. These image sets were excluded from rendering and CSA analysis.
3D Model Generation
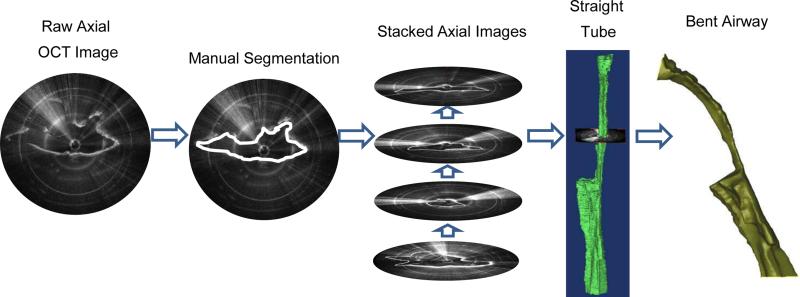
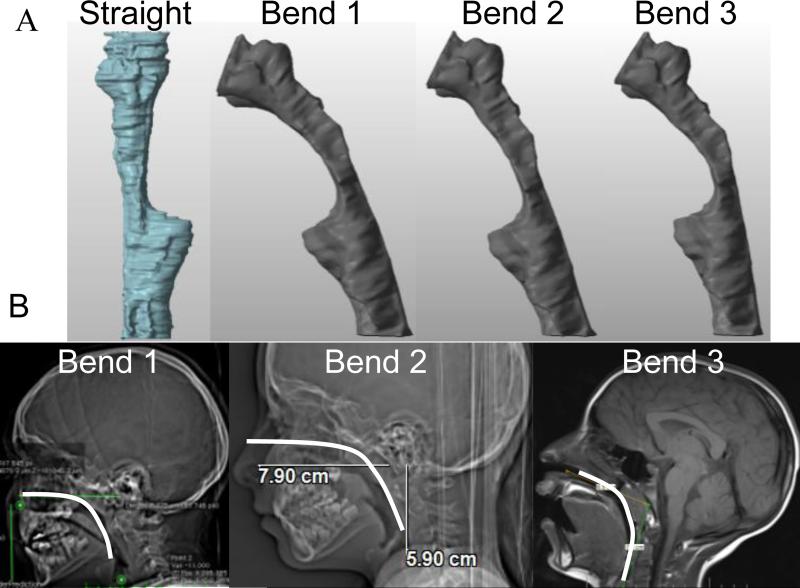
3D reconstructions can be used for qualitative and quantitative analysis of airway caliber. The full details of rendering LR-OCT images into 3D models have been previously described [28]. Figure 4 schematically illustrates this process. Since true airway anatomy is subject to a modest curvature, these straight tubes were then bent using curves derived from the CT or MRI scans of 3 children. Figure 5A illustrates the same airway model using the three different curvatures. Figure 5B shows how these curves were derived from a CT or MRI scan. These pre- and post-operative volumetric models were then compared qualitatively.
Figure 4.
Images were converted to 3D models using Mimics software. The contour of the tissue of each OCT image was manually segmented. The stack of outlined images was converted to a 3D straight tube model. Each straight tube was then curved to mimic normative airway anatomy.
Figure 5.
Figure 5A shows the 3 different CT/MRI-derived bends of the same post-operative airway (a 6-year-old female presenting with snoring). These are derived from CT and MRI scans of children as shown in 5B. Bend 1 is derived from an 8-year-old male, bend 2 is derived from a 7-year-old female, and bend 3 is derived from an 8-year-old female.
CSA Measurements
All image sets where key anatomic landmarks, such as the tonsils, adenoids, and choana could be readily identified were used for CSA analysis. We identified one axial LR-OCT image showing the adenoids and one axial LROCT image showing the tonsils in the pre-operative image sets. This determination was made using reference points (the ET tube and choana) and tissue characteristics (irregularly contoured tissue protrusion into the airway lumen).
For pre/post-operative comparison studies, one post-operative oropharynx image and one post-operative nasopharynx image in each data set was selected that corresponded to the previously selected pre-operative image. The choana and ET tube position were used as registry points, along with changes in the tissue contour that indicated surgery had taken place. Also, in some images, a thin film of blood remained along the tissue surface. Since blood appears very bright on LR-OCT images, this signal intensity was another indication that an image was from a region where tissue was removed.
The contour of the pharyngeal wall of each of these 4 LR-OCT images (2 pre-operative images, 2 post-operative images) was manually segmented and the area of the airway lumen was calculated in Mimics using an area calculation function. The change in area (post-operative minus pre-operative) for each region (Tonsils/Oropharynx or Adenoids/Nasopharynx) in each patient was calculated.
Results
There were 19 female patients and 27 male patients, ranging in age from 2-16 years, mean age 5.57 years. There were no complications or additional blood loss related to probe placement and imaging. Of the 46 LR-OCT image sets acquired, 29 were excluded from analysis for the reasons previously described in the Image Quality Analysis section.
12 patients had exceptional image quality, which facilitated the rendering of 3D models for morphometric analysis. 8 additional patients had very good images, where key anatomic landmarks were clearly identifiable, but other portions of the airway were not, which prohibited 3D rendering. These 8 image sets were used for cross-sectional area (CSA) calculations, for a total of 20 data sets used for CSA analysis.
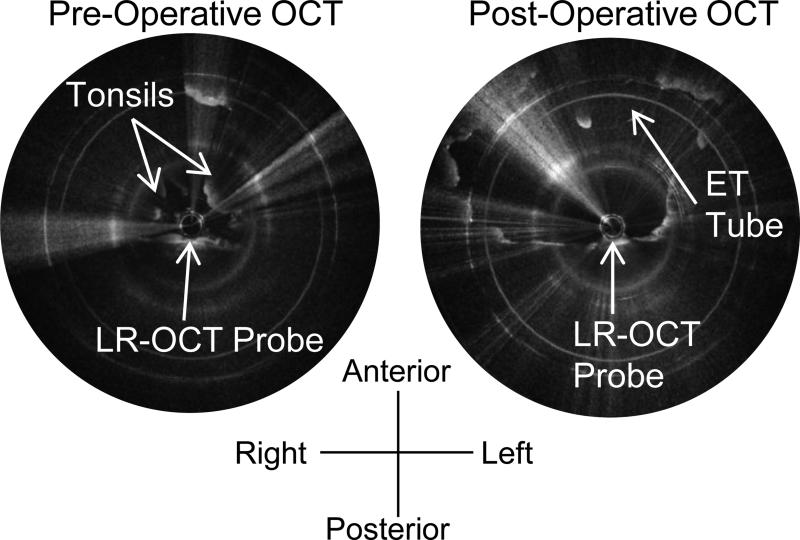
High-quality image sets were examined and key anatomic structures identified. The post-operative LR-OCT images show significantly increased airway lumen size. Figure 6 shows an axial LR-OCT image from the oropharynx post-tonsillectomy. As a result of the surgery, the tissue border is irregular. Additionally, focal regions of high signal intensity along the tissue border indicate the presence of small collections of blood or cautery eschar. Figure 7 shows an axial LR-OCT image from the nasopharynx post-adenoidectomy. Again, focal regions of high signal intensity can be seen along the tissue border, and the postoperative airway lumen is much wider than pre-operatively.
Figure 6.
Left: Pre-operative axial OCT image of the oropharynx of the 20.1kg 7-year-old male seen in Figure 5, showing the tonsils, which obscure the ET tube. Right: Post-operative axial OCT image of the oropharynx of the same patient. The tonsils have been removed, and the airway lumen is larger. Note the irregular appearance of the tissue border. Very bright white dots along the tissue surface indicate a thin film of blood and mucus.
Figure 7.
Left: Pre-operative axial OCT image of the nasopharynx of the 20.1kg 7-year-old male seen in Figure 5, showing the adenoids. Right: Post-operative axial OCT image of the nasopharynx of this same patient. The adenoids have been removed and the airway lumen is larger.
As expected, analysis of pre- and post-operative 3D models demonstrated obvious changes in airway geometry in the oropharynx and nasopharynx. Figure 2 compares pre- and post-operative models from a 20.1kg 7-year-old male who underwent adenotonsillectomy for upper airway obstruction and recurrent tonsillitis. These models demonstrate the high degree of airway narrowing due to the tonsils and adenoids, and the significantly improved air space once these tissues were removed.
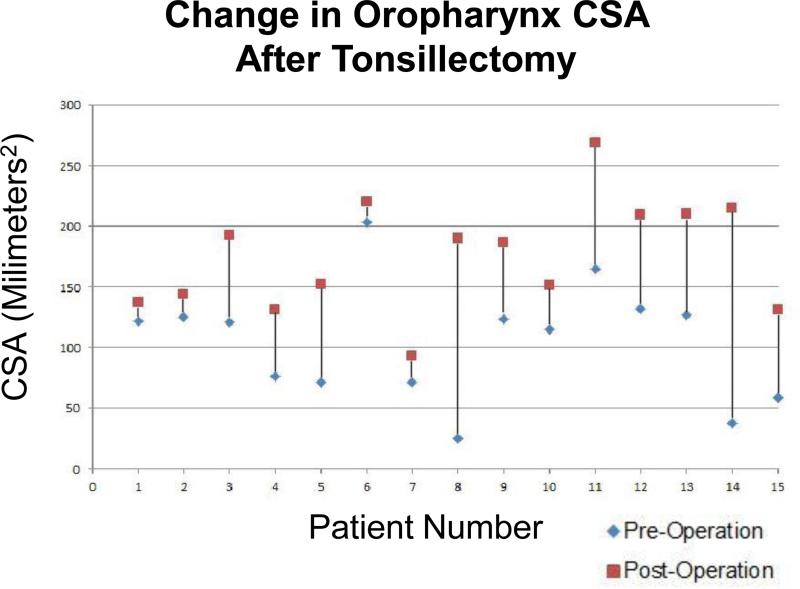
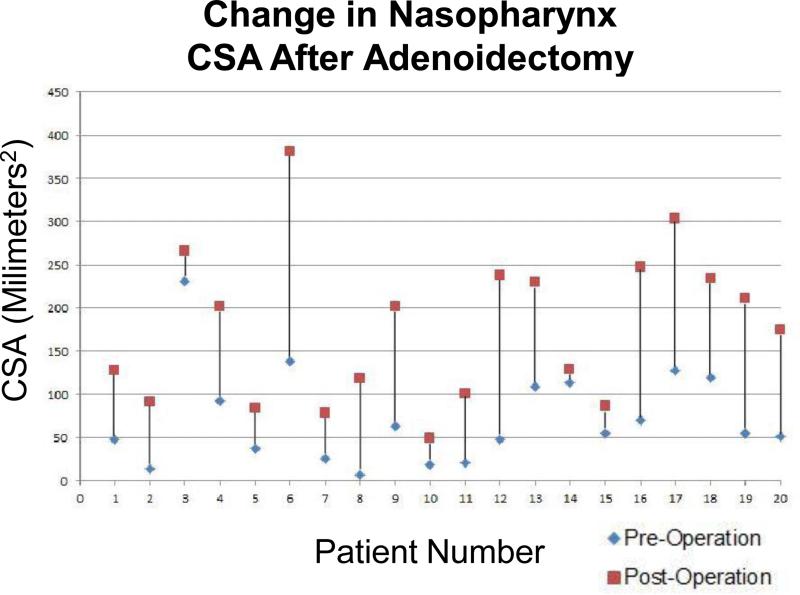
CSA calculations were performed in 15 adenotonsillectomy and 5 adenoidectomy patients. The change in oropharyngeal area (millimeters2) through one cross-section is illustrated for each subject before and after surgery in Figure 8. The average change was 70.52mm2 (standard deviation 47.87mm2). The change in nasopharyngeal area (millimeters2) through one cross-section is illustrated for each subject before and after surgery in Figure 9. The average change was 105.58mm2 (standard deviation 60.62mm2).
Figure 8.
Change in oropharynx CSA after tonsillectomy. Graph shows the change in CSA of one selected axial LR-OCT image of the oropharynx pre- and post-tonsillectomy. Patients are arranged by age from youngest (left side of graph, age 2) to oldest (right side of graph, age 9).
Figure 9.
Change in nasopharynx CSA after adenoidectomy. Graph shows the change in CSA of one selected axial LR-OCT image of the nasopharynx pre- and post-adenoidectomy. Patients are arranged by age from youngest (left side of graph, age 2) to oldest (right side of graph, age 9).
Discussion
This is the first report on the comprehensive use of LR-OCT to image the pediatric upper airway under general anesthesia, and demonstrates the feasibility of this technology to: 1) provide 3D images of internal airway structure (including the epiglottis, base of tongue, tonsils, and adenoids); and 2) identify anatomic loci of airway obstruction. 3D models derived from LR-OCT images can then be used to obtain quantitative measurements of airway CSA and volume as well as source geometry for computational fluid dynamics. While CT and cine MRI are also being used to provide structural anatomy of the airway surface [14-16], they are limited by ionizing radiation exposure (CT) and need for sedation (MRI). In contrast, LR-OCT does not expose patients to x-rays, is relatively fast, and can conceivably be performed in the office, making it ideally suited for children, albeit with the need to transnasally insert a thin optical fiber. Fortunately, transnasal imaging using a flexible naso-laryngoscope is routinely performed in children, and hence awake airway LR-OCT does not represent a significant paradigm shift in its implementation. Conceivably, imaging could be performed in sleep labs as well, with suitable changes in probe design. The present system already approaches the form factor of esophageal pH monitoring probes. Continuous monitoring of the airway could be performed during sleep and gated to the respiratory cycle.
CSA analysis of image sets can be seen in Figures 8-9. As expected, the post-operative area is larger than the pre-operative area. However, in some patients, this change was not as large as others. There are several possible explanations for this. One is that since these patients spanned a wide range of ages (age 2-9) and weights (12.7kg–53.5kg), the change in area post-operatively was also equally broad (oropharynx: 15.20-177.66 mm2, nasopharynx: 15.13-243.19 mm2). A second explanation for these smaller CSA changes is that because the imaging was completed immediately after the procedure, the resulting pharyngeal edema was impinging on the airway lumen in the postoperative data sets, artificially making the lumen CSA smaller than if this inflammation had been allowed to completely subside prior to imaging.
Another reason some post-operative changes were not as large as others is that it was a challenge to identify complementary pre- and post-operative axial LR-OCT images that correspond to exactly the same level in the airway, especially in the oropharynx. Unlike the nasopharynx where the choana is a reliable registry point, no marker exists in the oropharynx other than the ET tube, which is not a fixed part of the patient's anatomy. Because LR-OCT is a superficial imaging modality, no deep neck soft tissue or bony landmarks are available. Therefore, pre- and post-operative CSA measurements may not be taken from exactly the same point in the airway, unduly influencing the pre- and post-operative CSA comparison.
Additionally, while we attempted to ensure the patient's head position and ET tube position were the same pre- and post-operatively, there is no guarantee for this, as surgery was performed between image acquisitions. If the head or ET tube position changed, comparative measurements of airway lumen area may be of limited accuracy. These same difficulties would be present if we attempted comparative measurements of airway volume over specific subsections of the airway.
While quantitative analysis of pediatric airway size has been conducted via several techniques, such as CT [14, 29], x-ray [30], MRI [16, 31-33], and acoustic rhinometry [34-39], there is a dearth of studies comparing airway size pre-and post-operatively, likely in an effort to minimize radiation exposure to children. It is difficult to compare our results to these previous studies due to differing average age of subjects, measurement techniques, patient positioning, patient sedation level, and imaging modality resolution.
This is the first clinical study of LR-OCT in the pediatric upper airway. While 63% of our subjects were not included in our CSA analysis, it must be noted that this technology is very much still in evolution [21]. Our group has previously used LR-OCT to image the adult airway [40-42]. We also previously imaged the subglottic pediatric airway with a conventional OCT system, which could only capture 2D images in specific areas of interest [43]. With each new subject in each study, we have made refinements and improvements to both the LR-OCT system, probe design and operation, and our imaging technique (i.e. probe positioning and placement). As our studies continue, we expect to refine these elements and improve upon the frequency of high-quality examination data. While our current study was conducted in the operating room on children under general anesthesia, our ultimate objective is to image children both awake in the office and asleep in the sleep laboratory. This study was a necessary first step towards achieving that goal. General anesthesia eliminated patient movement (coughing, swallowing), fear/anxiety, and discomfort, which allowed optimization of the technology and imaging protocol.
The present study identified two key avenues for future work. First, the curvature of the pharyngeal airway from the choana to the pyriform sinus is estimated. In the future, methods incorporating magnetic tracking devices or based upon fiber optic Bragg grating sensors may provide a means to directly measure curvature during imaging. Second, fundamental improvements in system working distance using vertical-cavity surface-emitting laser sources and improved probe manufacturing will increase overall image quality.
While the information provided by LR-OCT will benefit all children who are being considered for adenotonsillectomy by providing quantitative information on airway caliber, the most significant value of this technology is potentially in patients who previously underwent adenotonsillectomy and have persistent OSA. Sleep endoscopy is currently utilized in these patients in an attempt to identify persistent obstructions [44-47]. However, it requires additional sedation in the operating room. LR-OCT could potentially be performed using a low-profile probe during the sleep study as a minimally invasive modality. In addition, there is potential value in patients for whom selecting the correct operation(s) remains a challenge (e.g. Down syndrome, craniofacial abnormalities). These patients are at increased risk for failure following surgery, and often, adenotonsillectomy is not effective in relieving their obstructive symptoms. It is to be noted that in this particular feasibility study, these patient populations were specifically excluded. It would be extraordinarily beneficial for a surgeon to have access to a modality, such as LR-OCT, that can provide safe, in-office imaging in order to more precisely tailor their treatment and provide better outcomes for these patients.
Conclusions
This pilot study has demonstrated that LR-OCT images of the pediatric upper airway can be feasibly obtained intraoperatively. These images can be used to identify sources of anatomic obstruction. These axial LR-OCT images can also be used to obtain quantitative descriptions of airway caliber and to build volumetric 3D airway models. 3D models can also be used to visually demonstrate sites of airway narrowing pre-operatively and increased patency post-operatively. They are also necessary for future computational fluid dynamics simulations. These preliminary results demonstrate the feasibility of LR-OCT to potentially identify regions of airway obstruction in children. In the future, we envision that every child could be imaged with LR-OCT, both awake and asleep. These findings would allow the physician to tailor surgery to meet the needs of each specific patient. LR-OCT has significant potential for the safe, efficient, and minimally-invasive identification of anatomic obstructions in the pediatric upper airway.
Acknowledgements
This research was supported by NIH grant number 443800-30066, “Near Infrared Optical Coherence Tomography of the Upper Aerodigestive Tract.”
Footnotes
Publisher's Disclaimer: This is a PDF file of an unedited manuscript that has been accepted for publication. As a service to our customers we are providing this early version of the manuscript. The manuscript will undergo copyediting, typesetting, and review of the resulting proof before it is published in its final citable form. Please note that during the production process errors may be discovered which could affect the content, and all legal disclaimers that apply to the journal pertain.
References
- 1.Bhattacharjee R, et al. Adenotonsillectomy outcomes in treatment of obstructive sleep apnea in children: a multicenter retrospective study. Am J Respir Crit Care Med. 2010;182(5):676–83. doi: 10.1164/rccm.200912-1930OC. [DOI] [PubMed] [Google Scholar]
- 2.Lumeng JC, Chervin RD. Epidemiology of pediatric obstructive sleep apnea. Proc Am Thorac Soc. 2008;5(2):242–52. doi: 10.1513/pats.200708-135MG. [DOI] [PMC free article] [PubMed] [Google Scholar]
- 3.Gozal D. Sleep-disordered breathing and school performance in children. Pediatrics. 1998;102(3 Pt 1):616–20. doi: 10.1542/peds.102.3.616. [DOI] [PubMed] [Google Scholar]
- 4.Gozal D, et al. C-reactive protein, obstructive sleep apnea, and cognitive dysfunction in school-aged children. Am J Respir Crit Care Med. 2007;176(2):188–93. doi: 10.1164/rccm.200610-1519OC. [DOI] [PMC free article] [PubMed] [Google Scholar]
- 5.Gozal D, et al. Obstructive sleep apnea and endothelial function in school-aged nonobese children: effect of adenotonsillectomy. Circulation. 2007;116(20):2307–14. doi: 10.1161/CIRCULATIONAHA.107.696823. [DOI] [PubMed] [Google Scholar]
- 6.Gozal D, Lipton AJ, Jones KL. Circulating vascular endothelial growth factor levels in patients with obstructive sleep apnea. Sleep. 2002;25(1):59–65. doi: 10.1093/sleep/25.1.59. [DOI] [PubMed] [Google Scholar]
- 7.Sans Capdevila O, et al. Increased morning brain natriuretic peptide levels in children with nocturnal enuresis and sleep-disordered breathing: a community-based study. Pediatrics. 2008;121(5):e1208–14. doi: 10.1542/peds.2007-2049. [DOI] [PubMed] [Google Scholar]
- 8.Amin R, et al. Activity-adjusted 24-hour ambulatory blood pressure and cardiac remodeling in children with sleep disordered breathing. Hypertension. 2008;51(1):84–91. doi: 10.1161/HYPERTENSIONAHA.107.099762. [DOI] [PubMed] [Google Scholar]
- 9.Amin RS, et al. Twenty-four-hour ambulatory blood pressure in children with sleep-disordered breathing. Am J Respir Crit Care Med. 2004;169(8):950–6. doi: 10.1164/rccm.200309-1305OC. [DOI] [PubMed] [Google Scholar]
- 10.Leung LC, et al. Twenty-four-hour ambulatory BP in snoring children with obstructive sleep apnea syndrome. Chest. 2006;130(4):1009–17. doi: 10.1378/chest.130.4.1009. [DOI] [PubMed] [Google Scholar]
- 11.Marcus CL, Greene MG, Carroll JL. Blood pressure in children with obstructive sleep apnea. Am J Respir Crit Care Med. 1998;157(4 Pt 1):1098–103. doi: 10.1164/ajrccm.157.4.9704080. [DOI] [PubMed] [Google Scholar]
- 12.Tal A, et al. Ventricular dysfunction in children with obstructive sleep apnea: radionuclide assessment. Pediatr Pulmonol. 1988;4(3):139–43. doi: 10.1002/ppul.1950040304. [DOI] [PubMed] [Google Scholar]
- 13.Lipton AJ, Gozal D. Treatment of obstructive sleep apnea in children: do we really know how? Sleep Med Rev. 2003;7(1):61–80. doi: 10.1053/smrv.2001.0256. [DOI] [PubMed] [Google Scholar]
- 14.Abramson Z, et al. Age-related changes of the upper airway assessed by 3-dimensional computed tomography. J Craniofac Surg. 2009;20(Suppl 1):657–63. doi: 10.1097/SCS.0b013e318193d521. [DOI] [PubMed] [Google Scholar]
- 15.deBerry-Borowiecki B, Kukwa A, Blanks RH. Cephalometric analysis for diagnosis and treatment of obstructive sleep apnea. Laryngoscope. 1988;98(2):226–34. doi: 10.1288/00005537-198802000-00021. [DOI] [PubMed] [Google Scholar]
- 16.Arens R, et al. Linear dimensions of the upper airway structure during development: assessment by magnetic resonance imaging. Am J Respir Crit Care Med. 2002;165(1):117–22. doi: 10.1164/ajrccm.165.1.2107140. [DOI] [PubMed] [Google Scholar]
- 17.Donnelly LF, et al. Upper airway motion depicted at cine MR imaging performed during sleep: comparison between young Patients with and those without obstructive sleep apnea. Radiology. 2003;227(1):239–45. doi: 10.1148/radiol.2271020198. [DOI] [PubMed] [Google Scholar]
- 18.McLaughlin RA, et al. Applying anatomical optical coherence tomography to quantitative 3D imaging of the lower airway. Opt Express. 2008;16(22):17521–9. doi: 10.1364/oe.16.017521. [DOI] [PubMed] [Google Scholar]
- 19.Lucey AD, et al. Measurement, reconstruction, and flow-field computation of the human pharynx with application to sleep apnea. IEEE Trans Biomed Eng. 2010;57(10):2535–48. doi: 10.1109/TBME.2010.2052808. [DOI] [PubMed] [Google Scholar]
- 20.Wijesundara K, et al. Quantitative upper airway endoscopy with swept-source anatomical optical coherence tomography. Biomed Opt Express. 2014;5(3):788–99. doi: 10.1364/BOE.5.000788. [DOI] [PMC free article] [PubMed] [Google Scholar]
- 21.Huang D, et al. Optical coherence tomography. Science. 1991;254(5035):1178–81. doi: 10.1126/science.1957169. [DOI] [PMC free article] [PubMed] [Google Scholar]
- 22.Leigh MS, et al. Anatomical optical coherence tomography for long-term, portable, quantitative endoscopy. IEEE Trans Biomed Eng. 2008;55(4):1438–46. doi: 10.1109/TBME.2007.913409. [DOI] [PubMed] [Google Scholar]
- 23.Coxson HO, et al. Airway wall thickness assessed using computed tomography and optical coherence tomography. Am J Respir Crit Care Med. 2008;177(11):1201–6. doi: 10.1164/rccm.200712-1776OC. [DOI] [PMC free article] [PubMed] [Google Scholar]
- 24.Grulkowski I, et al. High-precision, high-accuracy ultralong-range swept-source optical coherence tomography using vertical cavity surface emitting laser light source. Opt Lett. 2013;38(5):673–5. doi: 10.1364/OL.38.000673. [DOI] [PMC free article] [PubMed] [Google Scholar]
- 25.Grulkowski I, et al. Reproducibility of a long-range swept-source optical coherence tomography ocular biometry system and comparison with clinical biometers. Ophthalmology. 2013;120(11):2184–90. doi: 10.1016/j.ophtha.2013.04.007. [DOI] [PMC free article] [PubMed] [Google Scholar]
- 26.Jing J, et al. High-speed upper-airway imaging using full-range optical coherence tomography. J Biomed Opt. 2012;17(11):110507. doi: 10.1117/1.JBO.17.11.110507. [DOI] [PMC free article] [PubMed] [Google Scholar]
- 27.Chou L, et al. In vivo detection of inhalation injury in large airway using three-dimensional long-range swept-source optical coherence tomography. J Biomed Opt. 2014;19(3):36018. doi: 10.1117/1.JBO.19.3.036018. [DOI] [PMC free article] [PubMed] [Google Scholar]
- 28.Nguyen TD, et al. Constructing 3D models of the pediatric upper airway from long range optical coherence tomography images. 2014.
- 29.Santamaria F, et al. Upper airway obstructive disease in mucopolysaccharidoses: polysomnography, computed tomography and nasal endoscopy findings. J Inherit Metab Dis. 2007;30(5):743–9. doi: 10.1007/s10545-007-0555-5. [DOI] [PubMed] [Google Scholar]
- 30.Wolford LM, et al. Airway space changes after nasopharyngeal adenoidectomy in conjunction with Le Fort I osteotomy. J Oral Maxillofac Surg. 2012;70(3):665–71. doi: 10.1016/j.joms.2011.02.069. [DOI] [PubMed] [Google Scholar]
- 31.Arens R, et al. Upper airway size analysis by magnetic resonance imaging of children with obstructive sleep apnea syndrome. Am J Respir Crit Care Med. 2003;167(1):65–70. doi: 10.1164/rccm.200206-613OC. [DOI] [PubMed] [Google Scholar]
- 32.Abbott MB, et al. Obstructive sleep apnea: MR imaging volume segmentation analysis. Radiology. 2004;232(3):889–95. doi: 10.1148/radiol.2323031581. [DOI] [PubMed] [Google Scholar]
- 33.Fricke BL, et al. Comparison of lingual tonsil size as depicted on MR imaging between children with obstructive sleep apnea despite previous tonsillectomy and adenoidectomy and normal controls. Pediatr Radiol. 2006;36(6):518–23. doi: 10.1007/s00247-006-0149-7. [DOI] [PubMed] [Google Scholar]
- 34.Kim YK, Kang JH, Yoon KS. Acoustic rhinometric evaluation of nasal cavity and nasopharynx after adenoidectomy and tonsillectomy. Int J Pediatr Otorhinolaryngol. 1998;44(3):215–20. doi: 10.1016/s0165-5876(98)00062-7. [DOI] [PubMed] [Google Scholar]
- 35.Cho JH, et al. Size assessment of adenoid and nasopharyngeal airway by acoustic rhinometry in children. J Laryngol Otol. 1999;113(10):899–905. doi: 10.1017/s0022215100145530. [DOI] [PubMed] [Google Scholar]
- 36.Elbrond O, et al. Acoustic rhinometry, used as a method to demonstrate changes in the volume of the nasopharynx after adenoidectomy. Clin Otolaryngol Allied Sci. 1991;16(1):84–6. doi: 10.1111/j.1365-2273.1991.tb01948.x. [DOI] [PubMed] [Google Scholar]
- 37.Noussios G, et al. [The use of acoustic rhinometry for the assessment of adenoid hypertrophy: a clinical study]. Acta Otorrinolaringol Esp. 2008;59(9):433–7. [PubMed] [Google Scholar]
- 38.Piszcz M, Skotnicka B, Hassmann-Poznanska E. [Acoustic rhinometry evaluation of adenoid hypertrophy and adenoidectomy efficacy]. Otolaryngol Pol. 2008;62(3):300–4. doi: 10.1016/S0030-6657(08)70259-2. [DOI] [PubMed] [Google Scholar]
- 39.Wang Y, Zheng J, Dong Z. [The role of acoustic rhinometry in the evaluation of the volume of nasopharynx before and after adenoidectomy]. Zhonghua Er Bi Yan Hou Ke Za Zhi. 1998;33(4):228–31. [PubMed] [Google Scholar]
- 40.Armstrong J, et al. In vivo size and shape measurement of the human upper airway using endoscopic longrange optical coherence tomography. Opt Express. 2003;11(15):1817–26. doi: 10.1364/oe.11.001817. [DOI] [PubMed] [Google Scholar]
- 41.Armstrong JJ, et al. Quantitative upper airway imaging with anatomic optical coherence tomography. Am J Respir Crit Care Med. 2006;173(2):226–33. doi: 10.1164/rccm.200507-1148OC. [DOI] [PubMed] [Google Scholar]
- 42.Murgu SD, Colt HG. Combined optical coherence tomography and endobronchial ultrasonography for laser-assisted treatment of postintubation laryngotracheal stenosis. Ann Otol Rhinol Laryngol. 2013;122(5):299–307. doi: 10.1177/000348941312200503. [DOI] [PubMed] [Google Scholar]
- 43.Ridgway JM, et al. Imaging of the pediatric airway using optical coherence tomography. Laryngoscope. 2007;117(12):2206–12. doi: 10.1097/MLG.0b013e318145b306. [DOI] [PubMed] [Google Scholar]
- 44.Fishman G, et al. Fiber-optic sleep endoscopy in children with persistent obstructive sleep apnea: inter-observer correlation and comparison with awake endoscopy. Int J Pediatr Otorhinolaryngol. 2013;77(5):752–5. doi: 10.1016/j.ijporl.2013.02.002. [DOI] [PubMed] [Google Scholar]
- 45.Ulualp SO, Szmuk P. Drug-induced sleep endoscopy for upper airway evaluation in children with obstructive sleep apnea. Laryngoscope. 2013;123(1):292–7. doi: 10.1002/lary.23832. [DOI] [PubMed] [Google Scholar]
- 46.Kezirian EJ. Nonresponders to pharyngeal surgery for obstructive sleep apnea: insights from drug-induced sleep endoscopy. Laryngoscope. 2011;121(6):1320–6. doi: 10.1002/lary.21749. [DOI] [PMC free article] [PubMed] [Google Scholar]
- 47.Lin AC, Koltai PJ. Sleep endoscopy in the evaluation of pediatric obstructive sleep apnea. Int J Pediatr. 2012;2012:576719. doi: 10.1155/2012/576719. [DOI] [PMC free article] [PubMed] [Google Scholar]


