Abstract
Insulin regulates glucose uptake into fat and skeletal muscle cells by modulating the translocation of GLUT4 between the cell surface and interior. We investigated a role for cortactin, a cortical actin binding protein, in the actin filament organization and translocation of GLUT4 in Chinese hamster ovary (CHO-GLUT4myc) and L6-GLUT4myc myotube cells. Overexpression of wild-type cortactin enhanced insulin-stimulated GLUT4myc translocation but did not alter actin fiber formation. Conversely, cortactin mutants lacking the Src homology 3 (SH3) domain inhibited insulin-stimulated formation of actin stress fibers and GLUT4 translocation similar to the actin depolymerizing agent cytochalasin D. Wortmannin, genistein, and a PP1 analog completely blocked insulin-induced Akt phosphorylation, formation of actin stress fibers, and GLUT4 translocation indicating the involvement of both PI3-K/Akt and the Src family of kinases. The effect of these inhibitors was even more pronounced in the presence of overexpressed cortactin suggesting that the same pathways are involved. Knockdown of cortactin by siRNA did not inhibit insulin-induced Akt phosphorylation but completely inhibited actin stress fiber formation and glucose uptake. These results suggest that the actin binding protein cortactin is required for actin stress fiber formation in muscle cells and that this process is absolutely required for translocation of GLUT4-containing vesicles to the plasma membrane.
Keywords: insulin, GLUT4 translocation, cortactin, cytoskeleton, glucose uptake
Insulin plays a major role in regulating dietary glucose by stimulating its uptake into skeletal muscle and adipose tissue [1]. Glucose uptake is low in the basal state, and insulin stimulates a rapid and reversible increase in glucose uptake. Insulin-triggered glucose uptake is mediated primarily by the transporter isoform GLUT4, which is predominantly expressed in these tissues [2, 3]. In the absence of insulin, GLUT4 is predominantly localized in intracellular compartments as the rate of internalization is 10 times greater than the rate of exocytosis to the cell surface [1, 4–6]. Insulin treatment greatly increases the rate of GLUT4 exocytosis and reduces the rate of endocytosis changing the equilibrium localization. The insulin signaling pathways that lead to these changes have been an area of intense research. One of the most important components of this pathway is phosphatidylinositol 3-kinase (PI3-K) which mediates the glucoregulatory effects of insulin. Translocation of GLUT4 to the cell surface requires the activation of PI3-K, which occurs when it binds tyrosine-phosphorylated insulin receptor substrates. In parallel, insulin also causes the rapid remodeling of actin filaments into a cortical network. The cytoskeleton at the cell periphery consists of a highly organized network of filamentous actin (F-actin) closely associated with the overlying plasma membrane [7, 8].
A number of studies have shown that actin remodeling is required for GLUT4 translocation and glucose uptake into cells [9–12] either by linking signaling or by creating the tracks on which GLUT4 vesicles can move. In adipocytes, both microtubules and actin stress fibers contribute to GLUT4 translocation as disruption of either myosin Myo1c, an actin motor, or kinesins KIF3 or KIF5b, which are microtubule motors, impairs insulin-stimulated GLUT4 translocation [13–17]. In contrast, disruption of actin fibers in L6 muscle cells with jasplakinolide or inhibition of actin branching with swinholide A blocks GLUT4 translocation and actin ruffling, but disruption of microtubules with colchicine has no effect suggesting that actin fibers represent the major route for GLUT4 vesicle trafficking in these cells [18, 19]. GLUT4 vesicles isolated from 3T3-L1 cells contain actin-polymerizing activity and demonstrate actin comet tails in vitro [20].
Cortactin was initially identified as a tyrosine phosphorylated protein in v-Src-infected chicken embryo fibroblasts. Subsequent cloning of the cDNA encoding cortactin revealed a protein with a unique domain structure. Cortactin is able to bind to F-actin through multiple internal tandem repeat sequences located in the N-terminal half of the molecule and is thought to link the micro-filaments to the cell membrane through proline-rich and SH3 domains present in the C-terminus portion of the molecule. The cortactin Src homology 3 (SH3) domain shares significant homology to SH3 domains in Src family kinases and various adapter and cytoskeletal proteins [21–23]. Cortactin is known to bind the actin related protein complex Arp2/3 via the actin binding repeats, and the neuronal Wiskott–Aldrich syndrome protein (N-WASP) via its SH3 domain. The Arp2/3 complex drives actin polymerization and is activated by N-WASP [24, 25]. N-WASP is activated by the GTPases Rho and Cdc42 and the Src-family member Lck [26]. N-WASP is essential for actin remodeling and GLUT4 translocation in adipocytes and it localizes to cortical F-actin in response to insulin in both adipocytes and skeletal muscle [12, 27]. In addition, cortactin is phosphorylated on tyrosine, serine, and threonine residues upon stimulation of cells with growth factors or transformation by activated Src [28–30].
Because of these known associations, we investigated the role of cortactin in actin remodeling and GLUT4myc translocation to clarify its role in signal transduction and transmembrane receptor organization.
MATERIALS AND METHODS
Cells
CHO cells (CHO-GLUT4myc) and L6 myotubes (L6-GLUT4myc) containing c-myc tagged GLUT4, a GLUT4 construct with a 14 amino acid epitope in the first endofacial loop, were used for these studies [31]. Cells were transfected with GFP-tagged wild type and mutant cortactin cDNAs by Lipofectamine (Invitrogen Life Technologies, USA). Cells were used for determining the effect of cortactin on insulin-stimulated GLUT4 translocation pathway by fluorescence microscopy [3]. CHO-GLUT4myc cells were maintained in F12 medium (Sigma, USA) supplemented with 10% v/v fetal bovine serum (FBS) (ICN Biomedical Inc., USA) and gentamycin (100 U/ml). L6-GLUT4myc cells were grown in α-minimal essential medium (α-MEM) (Sigma) containing 2% FBS v/v and 0.1% gentamycin in a 5% CO2 atmosphere at 37°C as described previously [3, 32]. For translocation studies, cells were treated with trypsin, transferred into a 3 cm dish, and incubated at 37°C in a 5% CO2 atmosphere. Cells were used in experiments after four days of growth, before reaching confluence [33]. The inhibitors wortmannin, cytochalasin D, genistein, and the PP1 analog were obtained from Calbiochem Inc. (USA).
Cortactin expression
A cortactin cDNA containing the entire coding region was cloned from a human iliac cDNA library into the vector GFP (green fluorescent protein) (Takara Company, Japan). Plasmid DNA (1 μg) was transiently transfected into CHO-GLUT4myc cells with Lipofectamine Plus reagent (Invitrogen Life Technologies Inc.) according to the manufacturer’s instructions. In brief, CHO-GLUT4myc cells were transfected with Lipofectamine reagent with 1 μg plasmid DNA (GFP-cortactin) in 100 μl pure medium (medium without FBS), 6 μl Plus reagent was added, and the cells were mixed and incubated for 15 min at room temperature. Lipofectamine was made up to 4% with pure medium and added to the cells, which were mixed and incubated 15 min at room temperature. The medium (800 μl) was changed before the addition of transfection reagent, and incubation was carried out for 3 h at 37°C, 5% CO2. One milliliter of working medium (medium with FBS) was added and the cells were incubated overnight at 37°C, 5% CO2. Transfected cell lines were stained with a tyramide signal amplification system (TSA) (Perkin Elmer Life Sciences Inc., USA).
L6-GLUT4myc cells were transiently transfected with the cortactin using the liposome method. After 2–3 days of cell culture, 3 μl FuGENE6 reagent (Roche Molecular Biochemicals, USA) was made up to 100 μl with pure medium, which was gently mixed and incubated for 5 min in room temperature. One microgram of plasmid DNA was added and incubated for 15 min at room temperature. The medium (800 μl) was changed before the addition of transfected reagent, and the cells were incubated overnight at 37°C, 5% CO2. One milliliter of working medium was added, and the cells were incubated at 37°C, 5% CO2. The medium was changed with interval one day. Cells were stained with the TSA system after 5 days showing which cells were differentiated.
Structure of cortactin and mutant derivatives
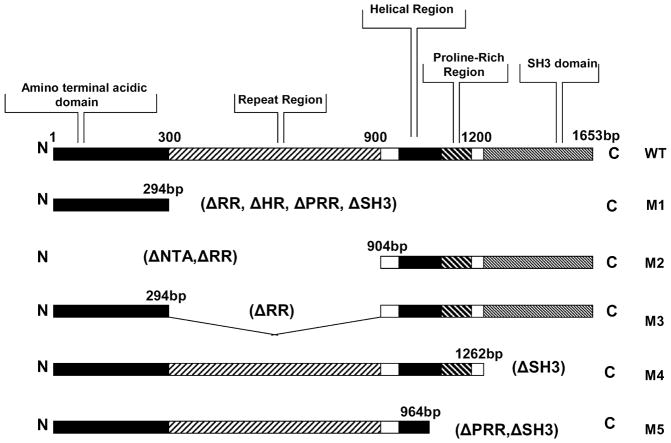
The 1653 bp cortactin gene encodes proteins of about 80 and 85 kDa (p80/85 cortactin). The amino terminus is largely unstructured, and there are many acidic residues between amino acids 45 and 105, a region that is referred to as the amino terminal acidic domain (NTA). The NTA region is followed by six tandem repeats of a 37-amino-acid sequence and an incomplete repeat of 20 residues, which has been termed the cortactin repeat region. The repeat region is followed by an α-helical domain (48–52 residue in length), a proline-rich domain of variable length also abundant in tyrosine, serine, and threonine residues, and a SH3 domain at the carboxyl terminus [34–36]. Five cortactin mutants with deletions of various regions were previously constructed: dl295-1653 bp (mutant 1, with a deletion of the repeat, helical, and proline-rich regions and SH3 domain), dl1-903 bp (mutant 2, with a deletion of NTA and the repeat region), dl295-903 bp (mutant 3, with a deletion of the repeat region), dl1263-1653 bp (mutant 4, with a deletion of the SH3 domain), dl965-1653 bp (mutant 5, with a deletion of the proline rich region and SH3 domain) (Fig. 1) [34, 37, 38].
Fig. 1.
Schematic representation of cortactin and cortactin mutants. The 1653 bp cortactin cDNA encodes a protein consisting of an amino-terminal acidic domain (NTA), a repeat region (RR), a helical region (HR), a proline-rich region (PRR), and a Src homology 3 (SH3) domain. The following derivatives were studied: mutant 1 (M1), with a deletion of the RR, HR, PRR, and SH3 domain; mutant 2 (M2), with a deletion of the NTA and RR; mutant 3 (M3), with a deletion of RR; mutant 4 (M4), with a deletion of the SH3 domain; and mutant 5 (M5), with a deletion of PRR and the SH3 domain. Δ, deletion; N, N terminus; C, C terminus.
Colorimetric assay of surface GLUT4myc and actin filament staining
Cells in a 3 cm dish with a cover slip were incubated in 2 ml Krebs–Ringer-HEPES (KRH) buffer for 30 min at 37°C and then incubated in 2 ml 300 nM insulin for 10 min. After fixation with 2% paraformaldehyde (10 min, room temperature), cells were washed with phosphate buffered saline (PBS), incubated in 0.1 M glycine in PBS for 15 min at room temperature, transferred to TNB buffer (1 M Tris-HCl, pH 7.5, 5 M NaCl, blocking reagent) for 30 min at room temperature, and incubated with primary antibody (anti-c-myc, 9E10; Santa Cruz Biotechnology Inc., USA) for 30 min at 37°C. The cells were extensively washed with TNT buffer (1 M Tris-HCl, pH 7.5, 1.5 M NaCl, 5% Tween 20) before and after introducing the second antibody for 30 min at 37°C (anti-anti-c-myc, anti-mouse IgG HRP-conjugated; BioSource Inc., USA). Finally, the cells were incubated with fluorescein tyramide (Perkin Elmer Life Sciences Inc.) for 7 min at room temperature and washed with TNT buffer, and GLUT4 translocation was detected by fluorescence microscopy. The cells were inspected using an inverted Nikon ECLIPSE E600 microscope equipped with a Nikon digital camera DXM1200 controlled by Nikon ACT-1 software. All digital images were captured at the same settings to allow direct quantitative comparison of staining patterns. Final images were processed using Adobe Photoshop software. Fluorescent intensity of red GLUT4 translocation was measured by Nikon ACT-1 software and further analyzed by Scion Image. Fluorescence intensities of GLUT4myc were normalized by subtracting background intensities.
To stain actin filaments, cells were incubated in 2 ml KRH buffer for 30 min at 37°C and then incubated in 2 ml 300 nM insulin. After fixation with 2% paraformaldehyde (10 min, room temperature), cells were washed with PBS and incubated in 0.1% Triton X-100 in PBS for 10 min at room temperature. Then the cells were washed with PBS and incubated in 1% BSA in PBS for 20 min at room temperature. The cells were extensively washed with PBS buffer before and after introducing rhodamine-phalloidin or Alexa Fluor 488 phalloidin (Molecular Probes Inc., The Netherlands) for 20 min at room temperature. Actin filaments were detected by fluorescence microscopy.
siRNA preparation
The siRNA (small interference RNA) sequences targeting rat cortactin gene (Accession number AF054618) corresponded to the coding regions 669 ± 688 relative to the first nucleotide of the start codon (gtcccagaaagactatgt) were synthesized by Gene Design Inc. (Japan).
Transfection of siRNAs for targeting endogenous genes was carried out using Lipofectamine Reagent (Life Technologies) with 50 nM siRNA. This siRNA concentration was sufficient to mediate silencing. Seventy-two hours after transfection, cells were fixed and processed for immunofluorescence or lysed with SDS-PAGE sample buffer, subject to electrophoresis, and immunoblotted with anti-cortactin (Santa Cruz Biotechnology Inc.), or anti-Akt antibody (Cell Signaling, Inc., USA) which were diluted 1 : 1500 and 1 : 1000, respectively. Specific silencing of targeted genes was confirmed by at least three independent experiments.
Statistical analysis
Comparison of data was performed using the one way ANOVA or the unpaired Student’s t-test and is presented as mean ± standard deviation. In each immunofluorescence experiment, the data from ≈50 cells and at least five separate slides were quantified. Values of p < 0.05 were considered significant.
RESULTS
Insulin triggers actin stress fiber formation and GLUT4 translocation
In the absence of insulin stimulation, the fluorescence intensity of cell surface GLUT4myc (red) in CHO-GLUT4myc and L6-GLUT4myc cells was minimal (Fig. 2a, left panels; see color insert). There was an increase in GLUT4myc staining on the cell surface after 10 min incubation with 300 nM insulin (Fig. 2a, right panels). Insulin treatment also caused the characteristic rearrangement of actin filaments, resulting in the reorientation of fibers with the long axis of the cells (stress fiber formation), as shown in Fig. 2b. As actin remodeling is closely associated with GLUT4 translocation, we tested the effect of cytochalasin D, an inhibitor of actin polymerization, on GLUT4 translocation. The insulin-dependent stimulation of stress fiber formation (Fig. 2c, upper panels) and GLUT4myc translocation (Fig. 2c, lower panels) was also completely blocked by treatment with cytochalasin D. These results confirm that the formation of actin stress fibers plays an important regulatory role in insulin-triggered GLUT4myc translocation as has been published previously.
Fig. 2.
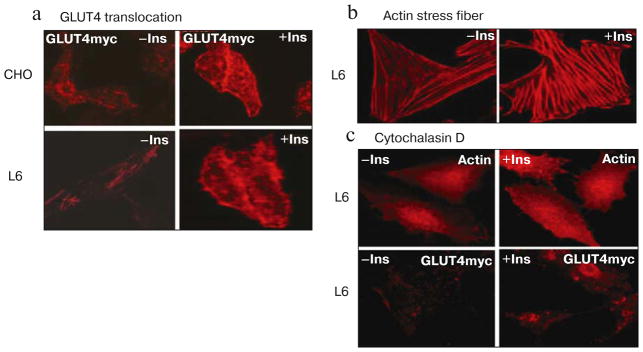
Insulin stimulates translocation of GLUT4myc in CHO cells and L6 myotubes. a) GLUT4 translocation is minimal in CHO-GLUT4myc cells (upper panels) and L6-GLUT4myc cells (lower panels) in the absence of insulin (−Ins, left panels). GLUT4 translocation to the cell surface is significantly increased after incubation with insulin (+Ins, right panels). Red fluorescence indicates GLUT4myc staining. b) Actin staining shows that insulin (right panel) stimulates the formation of actin stress fibers (straight red fiber-like strands along the long axis) compared with unstimulated control L6-GLUT4myc cells (left panel). Red fluorescence indicates rhodamine-phalloidin staining. c) Cytochalasin D, which causes actin filament depolymerization, completely inhibits formation of actin stress fiber (upper panels) and GLUT4 translocation (lower panels) irrespective of insulin treatment in L6-GLUT4myc cells.
Cortactin overexpression enhances GLUT4myc translocation
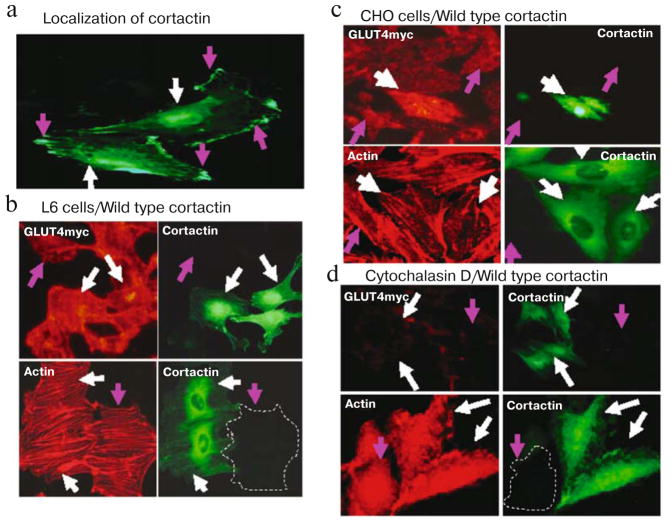
Cortactin plays an important role in actin stress fiber formation as well as cortical actin filaments. We initially studied the effect of overexpressing wild type cortactin on actin stress fibers and GLUT4myc translocation. Cortactin resides in both cytoplasmic perinuclear compartments as well as in submembranous compartments (Fig. 3a; see color insert). Insulin-stimulated GLUT4myc translocation was significantly greater in cells overexpressing wild type cortactin (green, indicated by white arrows) than in control cells (pink arrows) (Fig. 3b, upper panels). Quantitative fluorescence measurements showed that overexpression of wild type cortactin increased insulin-stimulated GLUT4 translocation promoted by 52% (p < 0.05) the in L6-GLUT4myc cells. Insulin stimulated the characteristic rearrangement of actin filament in cells overexpressing wild type cortactin as well as in control cells, resulting in the reorientation of fibers with the long axis of the cells (stress fiber formation) (Fig. 3b, lower panels). Similar results were also obtained by using CHO-GLUT4myc cells (Fig. 3c). Treatment of cells with cytochalasin D caused the depolymerization of F-actin with a loss of actin stress fibers and the accumulation of actin in foci. Cortactin was found to co-localize with actin in these foci in cytochalasin D treated cells (Figs. 2c and 3d).
Fig. 3.
Wild-type cortactin enhances GLUT4myc translocation in L6 and CHO cells. a) Cells were transiently transfected with cortactin GFP cDNA, cortactin-GFP localizes to both cytoplasmic perinuclear compartments (white arrows) and submembranous compartments (pink arrows). b) Cells expressing wild-type cortactin-GFP are indicated by white arrows. GLUT4myc translocation is significantly greater in L6-GLUT4myc cells overexpressing wild type cortactin (white arrows) than in control cells that do not express cortactin-GFP (pink arrow) in the presence of 300 nM insulin (upper panels). Actin staining (lower panels) shows that insulin stimulates the formation of actin stress fibers equally in L6-GLUT4myc cells overexpressing wild type (WT) cortactin-GFP (white arrows) as well as in control cells (pink arrows). c) Similar results were obtained using CHO-GLUT4myc cells. d) Cytochalasin D completely inhibits GLUT4 translocation (upper panels) and formation of actin stress fiber (lower panels) in response to insulin in L6-GLUT4myc cells with (white arrows) and without (pink arrows) the overexpression of wild type cortactin. Green fluorescence indicates GFP, red fluorescence indicates GLUT4myc or phalloidin staining.
Cortactin mutants lacking the SH3 domain inhibit actin stress fiber formation and GLUT4 translocation
We then studied the effects of various cortactin mutants to interfere with cortactin function. We found that insulin-stimulated GLUT4myc translocation was markedly decreased in cells transfected with mutants lacking the SH3 domain. Data for the M5 mutant lacking the proline-rich region and SH3 domain are shown in Figs. 4a and 4b, respectively (upper panels) (see color insert). Transfection with this cortactin mutant also resulted in a loss of actin stress fibers, as evidenced by the foci of color and the diffuse distribution of red in the cytoplasm (Figs. 4a and 4b, lower panels).
Fig. 4.
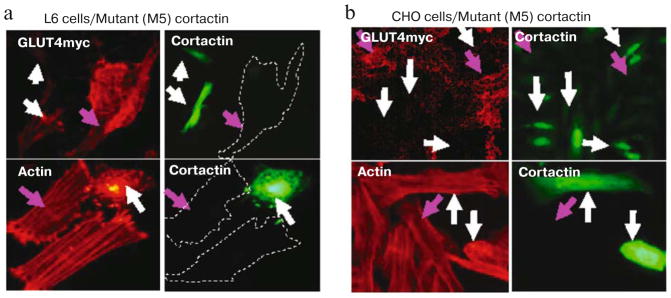
Cortactin deletion mutant lacking the SH3 domain inhibits GLUT4myc translocation and disrupts actin stress fibers. Cells were transiently transfected with M5 cortactin-GFP: a) L63GLUT4myc; b) CHO-GLUT4myc. The cells were treated with 300 nM insulin for 10 min. GLUT4 translocation is completely inhibited in cells expressing cortactin M5 (upper panels). Expression of the cortactin M5 mutant also disrupts actin stress fibers in the presence of insulin (lower panels). Green fluorescence indicates GFP, red fluorescence indicates GLUT4myc or phalloidin staining.
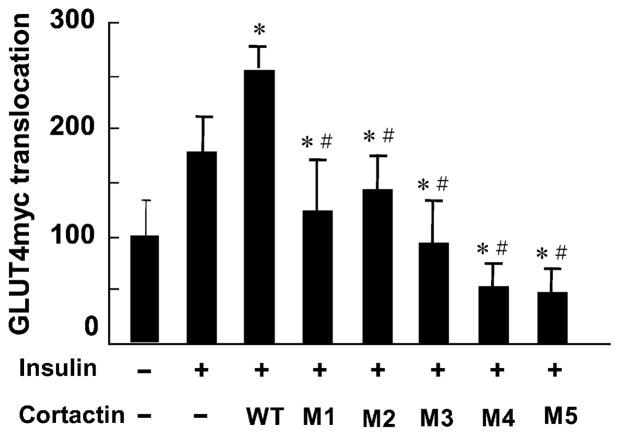
The pattern of actin and cortactin staining was very similar to cells that had been treated with cytochalasin D (Fig. 3d) suggesting that the mutant cortactin prevented stress fiber formation. The effect of the cortactin mutants on GLUT4myc translocation in L6 cells was determined by quantitative fluorescence measurements. Insulin-stimulated GLUT4 translocation was inhibited by the expression of M5 cortactin 75% (p < 0.05). The effects of the mutant cortactins were also assessed in CHO-GLUT4myc cells. In these cells, transfection of cortactin mutants decreased insulin-stimulated GLUT4myc translocation significantly compared to control cells. The greatest extent of inhibition (>60%) was observed in cells transfected with mutants 4 and 5, which lack the SH3 domain (Fig. 5). These results suggest that the SH3 domain plays an important role in actin stress fiber formation and GLUT4 translocation.
Fig. 5.
Effect of insulin on GLUT4 translocation in CHO-GLUT4myc cells expressing wild type (WT) and mutant (M1–M5) cortactins. In each experiment the data from ≈50 cells and at least five separate slides were quantified. * p < 0.01 vs. insulin stimulation, # p < 0.01 vs. wild-type cortactin.
Both actin stress fiber formation and GLUT4 translocation in response to insulin are mediated through the PI3 kinase and Src kinase pathways
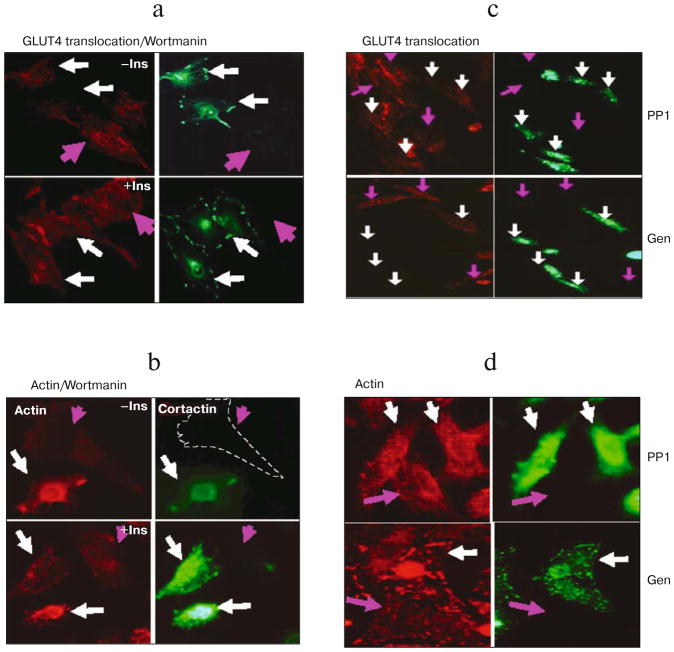
Because PI3-K is important for insulin signaling to GLUT4 translocation, we next examined the role of PI3K in actin stress fiber formation and GLUT4myc translocation in cells overexpressing cortactin using the PI3-K inhibitor wortmannin. Insulin-stimulated GLUT4myc translocation was abolished in L6-GLUT4myc cells pretreated with 0.3 μM wortmannin for 30 min (Fig. 6a; see color insert). Similar results were also obtained by using CHO-GLUT4myc cells (data not presented). Insulin-induced stress fiber formation in L6-GLUT4myc cells was also inhibited by treatment with wortmannin (Fig. 6b). These results indicate that both actin stress fiber formation and GLUT4myc translocation are mediated by a PI3-K pathway.
Fig. 6.
Effect of PI3 kinase and Src inhibitions on actin filaments and GLUT4 translocation. L6-GLUT4myc cells were transiently transfected with WT cortactin GFP cDNA (white arrows). a) Wortmannin, a PI3-K inhibitor, completely inhibits insulin-triggered GLUT4 translocation in L6-GLUT4myc cells with and without (pink arrows) overexpression of WT cortactin. Upper panels show unstimulated cells, lower panels show cells treated with 300 nM insulin for 10 min (a, b). b) Insulin-induced stress fiber formation in L6-GLUT4myc cells. Treatment with 0.3 μM wortmannin completely blocked actin stress fiber formation in both cells overexpressing wild type cortactin (white arrows) or untransfected cells (pink arrows). c) PP1 (upper panels) and genistein (lower panels), Src family protein kinase inhibitors, completely inhibit insulin-induced GLUT4 translocation in cells with (white arrows) and without (pink arrows) the overexpression of wild type cortactin. Cells were pretreated with 10 μM PP1 or 100 μM genistein and then treated with 300 nM insulin for 10 min. d) The insulin-induced formation of actin stress fibers in L6-GLUT4myc cells with or without overexpression of WT cortactin was also completely blocked by treatment with PP1 and genistein. Green fluorescence indicates GFP, red fluorescence indicates GLUT4myc or phalloidin staining.
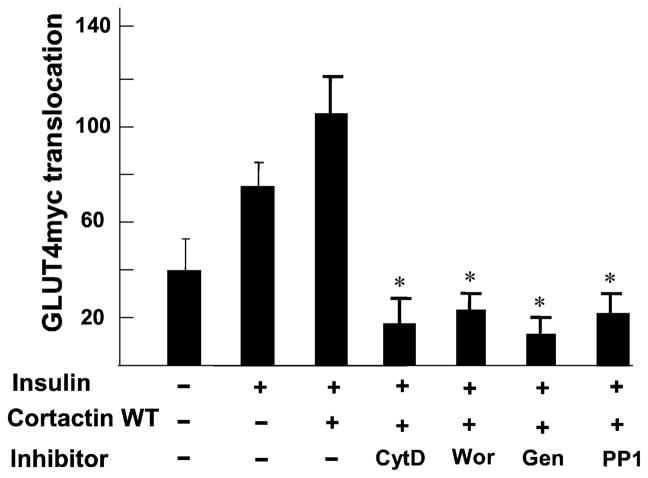
We also tested the effect of the Src family protein tyrosine kinase inhibitors genistein and PP1 analog on insulin-triggered actin stress fiber formation and GLUT4myc translocation as Src-family members have been shown to phosphorylate cortactin. Pretreatment with 100 μM genistein and 10 μM PP1 inhibited GLUT4myc translocation in CHO-GLUT4myc cells both in the presence and absence of overexpressed wild type cortactin (Fig. 6c). Similar results were also obtained by using L6-GLUT4myc cells. The insulin-induced formation of actin stress fibers in L6-GLUT4myc cells was also completely blocked by treatment with PP1 analog and genistein (Fig. 6d). The effect of various inhibitors on translocation was quantified. The insulin-induced GLUT4 translocation was completely blocked by treatment with inhibitors by comparing the fluorescent density on the plasma membrane of treated cells (Fig. 7).
Fig. 7.
Effect of inhibitors on GLUT4myc translocation (cytochalasin D (CytD), wortmannin (Wor), genistein (Gen), and PP1) in CHO cells. Examples of data from five independent experiments (≈50 cells) measuring the insulin-triggered translocation of GLUT4 in cells expressing wild type cortactin by comparing those in presence of inhibitors. * p < 0.01 vs. wild type cortactin without inhibitors.
Knockdown of cortactin impairs insulin-induced actin stress fiber formation and glucose uptake, but has no effect on Akt phosphorylation
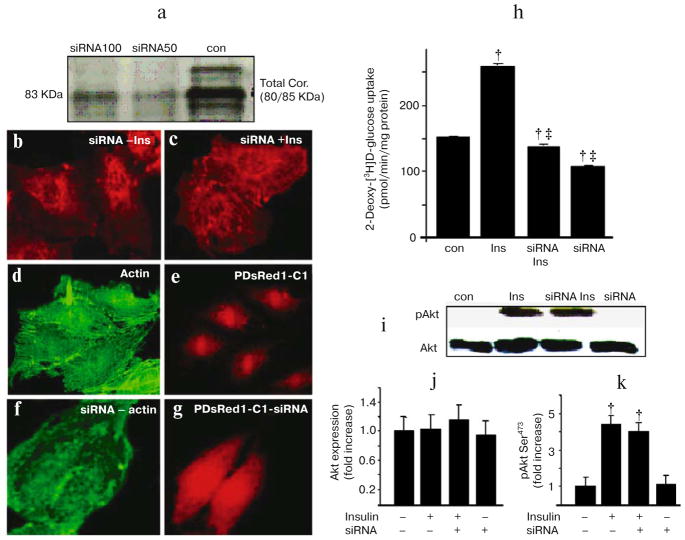
To further elucidate a role for cortactin in formation of actin stress fibers, we used RNAi to knock down cortactin levels in L6 cells. Cells were transfected with siRNA against cortactin. Western blotting revealed a significant reduction in cortactin protein levels after transfection with cortactin RNAi (Fig. 8a; see color insert). The reduction in cortactin protein resulted in a marked decrease in actin stress fibers in the absence of insulin and blocked the formation of stress fibers (Fig. 8b) in the presence of insulin (Fig. 8c). To further ensure that the observed reduction in actin stress fiber formation was due to the specific knockdown of cortactin in transfected cells, an alternative technique was adopted. Cells were co-transfected with or without siRNA together with a plasmid encoding the red fluorescent protein (pDsRed1-C1). Cotransfection of cortactin siRNA and pDsRed1-C1 plasmid exhibited the expected reduction in actin stress fibers formation by greater than 70% (Fig. 8, f and g). This is in contrast to cells transfected with pDsRed1-C1 alone where no reduction in internal actin stress fibers was observed (Fig. 8, d and e) [39].
Fig. 8.
RNAi-induced knockdown of cortactin protein results in reduced actin stress fibers and glucose transport. a) RNAi-induced knockdown of cortactin. Western blotting analysis was performed to assess cortactin protein levels in cell extracts from cells treated with cortactin siRNA or control. The blot was probed with an anti-cortactin antibody. Treatment of cells with siRNA (50 and 100 nM) markedly reduced cortactin protein. b, c) Cells were treated with either cortactin siRNA alone (b) or with insulin (300 nM, 10 min) (c). Seventy-two hours post-transfection, cells were fixed and stained with rhodamine phalloidin. d–g) Cells were co-transfected with cortactin siRNA and pDsRed1-C1 to identify transfected cells. The cortactin siRNA markedly reduces actin stress fibers formation comparison to cells transfected with pDsRed1-C1 alone. All cells were treated with 300 nM insulin for 10 min. Green fluorescence indicates Alexa Fluor 488 phalloidin staining of stress fibers, red fluorescence indicates RFP expression. h) RNAi-induced downregulation of cortactin protein causes decreased glucose uptake in L6 cells. Cortactin knockdown reduces both basal 2-deoxy-[3H]D-glucose uptake and insulin-induced uptake. i) Western blot analysis was performed to assess Akt activation and protein level in cell extracts from untreated cells (Con), insulin-treated cells (Ins), insulin and cortactin siRNA treated cells (siRNA-Ins), and only cortactin siRNA treated cells (siRNA). Blots were probed with an anti-phospho-Akt(Ser473) antibody and re-probed with anti-Akt antibody. j, k) Quantification of the western blots. Cortactin RNAi does not alter total Akt protein or insulin-induced Akt phosphorylation, but reduced basal as well as insulin-induced actin stress fibers and glucose uptake. Values were normalized by arbitrarily setting the densitometry of control cells to 1. p < 0.001 († vs. control cells) and (‡ vs. insulin stimulation).
Glucose uptake was also significantly decreased in cells transfected with cortactin siRNA in agreement with the GLUT4 translocation data (Fig. 8h).
Insulin signaling to GLUT4 translocation and actin stress fiber formation is thought to be mediated through Akt. To clarify whether the disruption of actin stress fiber formation by transfection of cortactin siRNA was due to the lack of Akt activation, we measured Akt phosphorylation and protein level. In the presence of the cortactin siRNA, insulin induced Akt phosphorylation to the same extent as control cells (Fig. 8, i–k) indicating that the failure to cause actin polymerization, GLUT4 translocation, and glucose transport was not due to a lack of Akt activation.
DISCUSSION
In this study, we characterized the insulin-stimulated translocation of GLUT4 with respect to cortactin/actin in CHO-GLUT4myc cells and L6-GLUT4myc myotubes. Overexpression of wild type cortactin enhanced GLUT4myc translocation to the cell surface in the presence of insulin, and cortactin deletion mutants acted as dominant negative mutants to inhibit GLUT4 translocation, suggesting that the insulin-stimulated translocation of GLUT4myc is dependent on the actin–cortactin interaction. Cortactin knockdown by siRNA resulted in decreased basal deoxyglucose transport in L6 myotubes and severely impaired the response to insulin, demonstrating that the altered GLUT4 trafficking translated to altered transport. We observed that cortactin is required for stress fiber formation, as expression of dominant-negative forms of cortactin or siRNA knockdown resulted in a loss of actin stress fibers. Interestingly, the disordered actin cytoskeleton did not impair the activation of Akt suggesting that either the cortactin effects are PI3-kinase independent or the site of action of cortactin is downstream of Akt in insulin signaling. Thus, our results confirm that cortactin plays a pivotal role in the formation of actin stress fiber in L6 myotubes and also suggest that stress fiber formation promotes GLUT4 translocation and glucose transport.
Previous studies have established that the translocation of GLUT4 is paralleled by an increase in actin cytoskeletal organization. Stress fibers are formed in L6 cells upon insulin stimulation [40, 41]. Studies using specific inhibitors of PI3-K have shown that both actin stress fiber formation and GLUT4 translocation are dependent on PI3-K and Akt signaling [42, 43]. This close parallel has prompted a number of groups to test whether actin reorganization is required for GLUT4 translocation. Pharmacological inhibitors of actin polymerization (cytochalasin D, latrunculin B, and jasplakinolide) or actin branching (swinholide A) prevent GLUT4 translocation and glucose transport in muscle cells [18, 44]. The data in adipocytes also support this model [11, 17, 45, 46]. Specific genetic manipulation of individual proteins has confirmed the inhibitor studies. The actin motor Myo1c, the regulatory GTPase ARF6, and the N-WASP complex are all involved in GLUT4 translocation in 3T3-L1 adipocytes [16, 27, 47].
In muscle cells, the actin cytoskeleton forms two functionally distinct structures, cytoplasmic actin stress fibers that span the cell and a sub-membranous cortical actin ring. Cortactin is an actin-binding protein that contains several protein interaction motifs, including an amino terminal acidic (NTA) domain, a cortactin repeat region, a proline-rich helical region, and a SH3 domain at the C terminus [21, 29]. The NTA region binds the Arp2/3 complex; the repeat region, especially the fourth repeat, binds F-actin; and the SH3 domain binds a number of proteins including N-WASP, WIP, and dynamin II [48, 49]. Many of these interactions are critical for cortactin’s function as a regulator of actin assembly. The Arp2/3 complex is the central regulator of actin polymerization in cells [50]. It is found localized to areas of action nucleation in cells and will promote actin filament assembly in vitro when given ATP-G-actin. The activity of the Arp2/3 complex is stimulated by proteins such as N-WASP and WAVE. The actin filaments generated by Arp2/3 are branched similar to actin structures found in membrane ruffles and lamellipodia [51]. These branches are unstable and dissociate to individual filaments. Cortactin stabilizes the branches by binding to the Arp2/3 complex and actin filaments [49] and synergizes with N-WASP to stimulate Arp2/3 polymerizing activity. N-WASP and cortactin bind the Arp2/3 complex simultaneously via acidic domains, and cortactin also binds N-WASP through its SH3 domain. Expression of the cortactin SH3 domain inhibits podosome formation in vascular smooth muscle cells indicating that the cortactin–N-WASP interaction is critical for actin polymerization [25].
We found that cortactin mutants lacking the SH3 domain exhibited the greatest dominant negative phenotype in L6 cells, which confirms the importance of this domain in cortactin function. The function of the Arp2/3 complex is also subject to regulation by known signaling proteins. Cdc42, Grb2, Nck, PI-4,5P2, syndapin, and WISH all bind and activate N-WASP; Abl and PKA bind WAVE1, and p53 (insulin receptor protein kinase substrate) binds WAVE2 [50]. Cdc42 bound to the Arp2/3 complex is activated by specific GDP exchange factors, FGD1 and intersectin I, that bind to cortactin or N-WASP, respectively. Insulin activates Cdc42 signaling in 3T3-L1 adipocytes via PI3-kinase [52] and also activates a related Cdc42 family member TC10 that binds to N-WASP [27, 53]. Interestingly, both Cdc42 and TC10 induce actin comet tails in vitro and perinuclear actin polymerization in 3T3-L1 cells, but only TC10 disrupts cortical actin structures suggesting differential targeting of actin polymerization [53].
Insulin is known to cause an initial disruption of actin stress fibers followed by membrane ruffling due to actin polymerization in cortical regions, then the re-synthesis of actin stress fibers [54]. These actin filaments could function as a track along which the GLUT4 vesicles move. The requirement of the actin motor protein Myo1c for GLUT4 translocation in 3T3-L1 cells would support this model [16]. It is difficult to reconcile this model with the known disruption of the actin filaments upon insulin stimulation however. Alternatively, the actin re-polymerization might provide the driving force for vesicular movement in the cell. Microbial pathogens such as Listeria, Salmonella, and Shigella have hijacked actin polymerization to propel themselves through the cytoplasm [50, 55]. Indeed Arp2/3 complexes, WASP family members, Cdc42 and Rac, and cortactin are recruited to invading bacteria. Actin polymerization is limited to one end or pole of the bacteria and results in characteristic comet tails that propel the microbe. Actin comet tails have been observed on GLUT4 vesicles raising the possibility that the microbes may have hijacked a normal vesicular transport mechanism [20].
In conclusion, we have demonstrated that the actin binding protein cortactin is intimately involved in GLUT4 translocation and actin stress fiber polymerization in L6 muscle cells. These findings provide a new framework for studies on the insulin-regulated trafficking of GLUT4 at the molecular level and suggest a novel hypothesis that actin polymerization on the GLUT4 vesicle itself provides the driving force for vesicle movement. Failure to translocate GLUT4 correctly in states of insulin resistance or diabetes may be linked to changes in actin dynamics in these conditions and, if true, suggest novel potential targets for drug development.
Contributor Information
H. Nazari, Email: hossen253@yahoo.co.uk.
Y. Nakaya, Email: yutaka-nakaya@nutr.med.tokushima-u.ac.jp.
References
- 1.Zeigerer A, Lampson MA, Karylowski O, David D, Adesnik M, Ren M, McGraw TE. Mol Biol Cell. 2002;13:2421–2435. doi: 10.1091/mbc.E02-02-0071. [DOI] [PMC free article] [PubMed] [Google Scholar]
- 2.Furtado LM, Somwar R, Sweeney G, Niu W, Klip A. Biochem Cell Biol. 2002;80:569–578. doi: 10.1139/o02-156. [DOI] [PubMed] [Google Scholar]
- 3.Wang Q, Khayat Z, Kishi K, Ebina Y, Klip A. FEBS Lett. 1998;427:193–197. doi: 10.1016/s0014-5793(98)00423-2. [DOI] [PubMed] [Google Scholar]
- 4.Lampson MA, Schmoranzer J, Zeigerer A, Simon S, Mc Graw TE. Mol Biol Cell. 2001;12:3489–3501. doi: 10.1091/mbc.12.11.3489. [DOI] [PMC free article] [PubMed] [Google Scholar]
- 5.Garza L, Birnbaum M. J Biol Chem. 2000;275:2560–2567. doi: 10.1074/jbc.275.4.2560. [DOI] [PubMed] [Google Scholar]
- 6.Lampson MA, Racz A, Cushman SW, Mc Graw TE. J Cell Sci. 2000;113:4065–4076. doi: 10.1242/jcs.113.22.4065. [DOI] [PubMed] [Google Scholar]
- 7.Wang Q, Bilan PJ, Tsakiridis T, Hinek A, Klip A. Biochem J. 1998;331:917–928. doi: 10.1042/bj3310917. [DOI] [PMC free article] [PubMed] [Google Scholar]
- 8.Khayat ZA, Tong P, Yaworsky K, Bloch RJ, Klip A. J Cell Sci. 2000;113:279–290. doi: 10.1242/jcs.113.2.279. [DOI] [PubMed] [Google Scholar]
- 9.Kanai F, Ito K, Todaka M, Hayashi H, Kamohara S, Ishii K, Okada T, Hazaki O, Ui M, Ebina Y. Biochem Biophys Res Commun. 1993;195:762–768. doi: 10.1006/bbrc.1993.2111. [DOI] [PubMed] [Google Scholar]
- 10.Subtil A, Lampson MA, Keller SR, Mc Graw TE. J Biol Chem. 2000;275:4787–4795. doi: 10.1074/jbc.275.7.4787. [DOI] [PubMed] [Google Scholar]
- 11.Kanzaki M, Pessin JE. J Biol Chem. 2001;276:42436–42444. doi: 10.1074/jbc.M108297200. [DOI] [PubMed] [Google Scholar]
- 12.Brozinick JT, Jr, Hawkins ED, Strawbridge AB, Elmendorf JS. J Biol Chem. 2004;279:40699–40706. doi: 10.1074/jbc.M402697200. [DOI] [PMC free article] [PubMed] [Google Scholar]
- 13.Emoto M, Langille SE, Czech MP. J Biol Chem. 2001;276:10677–10682. doi: 10.1074/jbc.M010785200. [DOI] [PubMed] [Google Scholar]
- 14.Imamura T, Huang J, Usui I, Satoh H, Bever J, Olefsky JM. Mol Cell Biol. 2003;14:4892–4900. doi: 10.1128/MCB.23.14.4892-4900.2003. [DOI] [PMC free article] [PubMed] [Google Scholar]
- 15.Semiz S, Park JG, Nicoloro SM, Furcinitti P, Zhang C, Chawla A, Leszyk J, Czech MP. EMBO J. 2003;22:2387–2399. doi: 10.1093/emboj/cdg237. [DOI] [PMC free article] [PubMed] [Google Scholar]
- 16.Bose A, Guilherme A, Robida SI, Nicoloro SM, Zhou QL, Jiang ZY, Pomerleau DP, Czech MP. Nature. 2002;420:821–824. doi: 10.1038/nature01246. [DOI] [PubMed] [Google Scholar]
- 17.Huang J, Imamura T, Babendure JL, Lu JC, Olefsky JM. J Biol Chem. 2005;280:42300–42306. doi: 10.1074/jbc.M510920200. [DOI] [PubMed] [Google Scholar]
- 18.Ai H, Ralston E, Lauritzen HP, Galbo H, Ploug T. Am J Physiol Endocrinol Metab. 2003;285:E836–844. doi: 10.1152/ajpendo.00238.2002. [DOI] [PubMed] [Google Scholar]
- 19.Tong P, Khayat ZA, Huang C, Patel N, Ueyama A, Klip A. J Clin Invest. 2001;108:371–381. doi: 10.1172/JCI12348. [DOI] [PMC free article] [PubMed] [Google Scholar]
- 20.Kanzaki M, Watson RT, Khan AH, Pessin JE. J Biol Chem. 2001;276:49331–49336. doi: 10.1074/jbc.M109657200. [DOI] [PubMed] [Google Scholar]
- 21.Crostella L, Lidder S, Williams R, Skouteris GG. Oncogene. 2001;20:3735–3745. doi: 10.1038/sj.onc.1204474. [DOI] [PubMed] [Google Scholar]
- 22.Bourguignon LY, Zhu H, Shao L, Chen YW. J Biol Chem. 2001;276:7327–7336. doi: 10.1074/jbc.M006498200. [DOI] [PubMed] [Google Scholar]
- 23.McNiven MA, Kim L, Krueger EW, Orth JD, Cao H, Wong TW. J Cell Biol. 2000;151:187–198. doi: 10.1083/jcb.151.1.187. [DOI] [PMC free article] [PubMed] [Google Scholar]
- 24.Uruno T, Liu J, Li Y, Smith N, Zhan X. J Biol Chem. 2003;278:26086–26093. doi: 10.1074/jbc.M301997200. [DOI] [PubMed] [Google Scholar]
- 25.Webb BA, Eves R, Mak AS. Exp Cell Res. 2006;312:760–769. doi: 10.1016/j.yexcr.2005.11.032. [DOI] [PubMed] [Google Scholar]
- 26.Torres E, Rosen MK. J Biol Chem. 2006;281:3513–3520. doi: 10.1074/jbc.M509416200. [DOI] [PubMed] [Google Scholar]
- 27.Jiang ZY, Chawla A, Bose A, Way M, Czech MP. J Biol Chem. 2002;277:509–515. doi: 10.1074/jbc.M108280200. [DOI] [PubMed] [Google Scholar]
- 28.Schuuring E, van Damme H, Schuuring-Scholtes E, Verhoeven E, Michalides R, Geelen E, de Boer C, Brok H, van Buuren V, Kluin P. Cell Adhes Commun. 1998;6:185–209. doi: 10.3109/15419069809004475. [DOI] [PubMed] [Google Scholar]
- 29.Du Y, Weed SA, Xiong Wen C, Marshall TD, Parsons JT. Mol Cell Biol. 1998;10:5838–5851. doi: 10.1128/mcb.18.10.5838. [DOI] [PMC free article] [PubMed] [Google Scholar]
- 30.Wu H, Parsons JT. J Cell Biol. 1993;120:1417–1426. doi: 10.1083/jcb.120.6.1417. [DOI] [PMC free article] [PubMed] [Google Scholar]
- 31.Kanai F, Nishioka Y, Hayashi H, Kamohara S, Todaka M, Ebina Y. J Biol Chem. 1993;268:14523–14526. [PubMed] [Google Scholar]
- 32.Klip A, Li G, Logan WJ. Am J Physiol. 1984;247:E291–E296. doi: 10.1152/ajpendo.1984.247.3.E291. [DOI] [PubMed] [Google Scholar]
- 33.Klip A, Li G, Walker D. Can J Biochem Cell Biol. 1983;61:644–649. doi: 10.1139/o83-081. [DOI] [PubMed] [Google Scholar]
- 34.Ohoka Y, Takai Y. Genes Cells. 1998;9:603–612. doi: 10.1046/j.1365-2443.1998.00216.x. [DOI] [PubMed] [Google Scholar]
- 35.Campbell DH, Sutherland RL, Daly RJ. Cancer Res. 1999;59:5376–5385. [PubMed] [Google Scholar]
- 36.Olazabel IM, Machesky LM. J Cell Biol. 2001;154:679–682. doi: 10.1083/jcb.200105061. [DOI] [PMC free article] [PubMed] [Google Scholar]
- 37.Lopez I, Duprez V, Melle J, Dreyfus F, Levy-Toledano S, Fontenary-Roupie M. Biochem J. 2001;356:875–881. doi: 10.1042/0264-6021:3560875. [DOI] [PMC free article] [PubMed] [Google Scholar]
- 38.Craig AWB, Zirngibl R, Williams K, Cole L, Greer PA. Mol Cell Biol. 2001;21:603–613. doi: 10.1128/MCB.21.2.603-613.2001. [DOI] [PMC free article] [PubMed] [Google Scholar]
- 39.Revankar CM, Cimino DF, Sklar LA, Arterburn JB, Prossnitz ER. Science. 2005;307:1625–1630. doi: 10.1126/science.1106943. [DOI] [PubMed] [Google Scholar]
- 40.Kam Y, Exton JH. Mol Cell Biol. 2001;21:4055–4066. doi: 10.1128/MCB.21.12.4055-4066.2001. [DOI] [PMC free article] [PubMed] [Google Scholar]
- 41.Komati H, Naro F, Mebarek S, de Arcangelis V, Adamo S, Lagarde M, Prigent AF, Nemoz G. Mol Biol Cell. 2005;16:1232–1244. doi: 10.1091/mbc.E04-06-0459. [DOI] [PMC free article] [PubMed] [Google Scholar]
- 42.Dawson CW, Tramountanis G, Eliopoulos AG, Young LS. J Biol Chem. 2003;278:3694–3704. doi: 10.1074/jbc.M209840200. [DOI] [PubMed] [Google Scholar]
- 43.Qian Y, Corum L, Meng Q, Blenis J, Zheng JZ, Shi X, Flynn DC, Jiang BH. Am J Physiol Cell Physiol. 2004;286:C153–C163. doi: 10.1152/ajpcell.00142.2003. [DOI] [PubMed] [Google Scholar]
- 44.Torok D, Patel N, JeBailey L, Thong FSL, Randhawa VK, Klip A, Rudich A. J Cell Sci. 2004;117:5447–5455. doi: 10.1242/jcs.01421. [DOI] [PubMed] [Google Scholar]
- 45.Omata W, Shibata H, Li L, Takata K, Kojima I. Biochem J. 2000;346:321–328. [PMC free article] [PubMed] [Google Scholar]
- 46.Patki V, Buxton J, Chawla A, Lifshitz L, Fogarty K, Carrington W, Tuft R, Corvera S. Mol Biol Cell. 2001;12:129–141. doi: 10.1091/mbc.12.1.129. [DOI] [PMC free article] [PubMed] [Google Scholar]
- 47.Bose A, Cherniack AD, Langille SE, Nicoloro SM, Buxton JM, Park JG, Chawla A, Czech MP. Mol Cell Biol. 2001;15:5262–5275. doi: 10.1128/MCB.21.15.5262-5275.2001. [DOI] [PMC free article] [PubMed] [Google Scholar]
- 48.Weaver AM, Young ME, Lee WL, Cooper JA. Curr Opin Cell Biol. 2002;1:23–30. doi: 10.1016/s0955-0674(02)00015-7. [DOI] [PubMed] [Google Scholar]
- 49.Weaver AM, Karginov AV, Kinley AW, Weed SA, Li Yan, Parsons JT, Cooper JA. Curr Biol. 2001;11:370–374. doi: 10.1016/s0960-9822(01)00098-7. [DOI] [PubMed] [Google Scholar]
- 50.May RC. Cell Mol Life Sci. 2001;58:1607–1626. doi: 10.1007/PL00000800. [DOI] [PMC free article] [PubMed] [Google Scholar]
- 51.Higgs HN, Pollard TD. Annu Rev Biochem. 2001;70:649–676. doi: 10.1146/annurev.biochem.70.1.649. [DOI] [PubMed] [Google Scholar]
- 52.Usui I, Imamura T, Huang J, Satoh H, Olefsky JM. J Biol Chem. 2003;278:13765–13774. doi: 10.1074/jbc.M208904200. [DOI] [PubMed] [Google Scholar]
- 53.Kanzaki M, Watson RT, Hou JC, Stamnes M, Saltiel AR, Pessin JE. Mol Biol Cell. 2002;13:2334–2346. doi: 10.1091/mbc.01-10-0490. [DOI] [PMC free article] [PubMed] [Google Scholar]
- 54.Martin SS, Haruta T, Morris AJ, Klippel A, Williams LT, Olefsky JM. J Biol Chem. 1996;271:17605–17608. doi: 10.1074/jbc.271.30.17605. [DOI] [PubMed] [Google Scholar]
- 55.Unsworth KE, Way M, McNiven M, Machesky L, Holden DW. Cell Microbiol. 2004;11:1041–1055. doi: 10.1111/j.1462-5822.2004.00417.x. [DOI] [PubMed] [Google Scholar]


