Abstract
Microfluidic systems are developed with monolithic columns for preconcentration and on-chip labeling of model proteins. Monoliths are prepared in microchannels via photopolymerization, and the properties of monoliths are optimized by varying the composition and concentration of monomers to improve flow and extraction. On-chip labeling of proteins is achieved by driving solutions through the monolith using voltage and incubating fluorescent dye with protein retained in the monolith. Subsequently, the labeled proteins are eluted by applying voltages to reservoirs on the microdevice and then detected by laser-induced fluorescence. Monoliths prepared from octyl methacrylate show the best combination of protein retention while still allowing unattached fluorescent label to be eluted in a separate fraction with 50% acetonitrile. Finally, automated on-chip extraction and fluorescence labeling of a model protein is successfully demonstrated. This work provides facile sample pretreatment, and therefore offers promising potential for future integrated bioanalysis microchips.
Keywords: biomarkers, chromatography, microfluidics, monoliths, solid-phase extraction
1. Introduction
Detection of biomarkers is of great importance in the diagnosis, monitoring and treatment of diseases, such as various types of cancers [1–6] and pregnancy complications [7,8]. Significant research effort has been devoted to developing efficient and effective detection methods for disease-specific biomarkers. Despite the impressive progress achieved to date, effective and scalable analytical techniques for protein biomarkers, pathogenic bacteria and viruses remain a significant challenge [9]. Modern bioanalytical techniques, such as liquid chromatography coupled with mass spectrometry, have the ability to identify biomarkers, but cost and scalability are two drawbacks [10]. Enzyme-linked immunosorbent assay (ELISA) is another powerful technique to measure biomarkers, but ELISA is most effective for batches of similar analyses in multiwell plates [11]. On the other hand, microfluidics, and especially integrated devices, have emerged as a promising platform due to their small fluid volume consumption, rapidness, low fabrication cost and portability [12–15]. Furthermore, the miniaturization of traditional analyses can realize the automation and parallelization of tests with reduced sample amounts and operation times [16,17]. Finally, human error and contamination issues can potentially be reduced by integration of sample preparation, separation, detection and data processing on a single microfluidic device [18].
One of the most difficult steps in microfluidic integration is sample preparation [19]. Among various sample preparation techniques, solid phase extraction (SPE) is used widely in preconcentration and purification [20]. Affinity and reversed-phase are two common column types in SPE. The former has been used to extract or enrich bio-recognizable substances such as cancer biomarkers or PCR products [21–23], while the latter is more suitable for the purification of non-polar to moderately polar compounds [24].
In conventional packed particle reversed-phase columns, the supports can be fabricated in a variety of ways using different materials with various useful functionalities. As a result, they are widely used in microfluidics, as summarized in recent reviews [25,26]. Several methods have been used to trap particles within microfluidic devices, including frits [27], weirs [28], pillars [29] and column height constraints [30]. Additionally, fritless designs have been developed for packing particles [31,32]. However, packed particle columns have limitations associated with packing difficulties and complicated design, which increase complexity when they are integrated into microchips.
Monolithic columns are increasingly used in microfluidics due to their easy preparation, lack of retaining structures, and tunable porosity and surface area [33]. The first use of a monolith in a microfluidic system for SPE was reported by Svec et al. [34], wherein enrichment of Phe-Gly-Phe-Gly up to 1000 fold was reported. Similarly, Tan et al. [35] developed a device with multiple hydrophobic monoliths fabricated within channels in a cyclic olefin copolymer (COC) chip, in which imipramine was extracted from human urine. Shediac et al. [36] made an acrylate-based porous polymer monolith as a stationary phase for microchip electrochromatography of amino acids and peptides. Rohr et al. [37] utilized a monolith to assist in mixing of two fluids, while Yu et al. [38] formed a monolith from a thermally responsive monomer, which then acted as a valve under temperature variation. In many of these applications, the monoliths are used for a single function rather than to create a fully integrated analysis system. Importantly, there is a need for integrated microfluidic systems with monoliths for sample preparation. Recently, Nge et al. [39] reported a monolith prepared from butyl methacrylate for SPE and on-chip labeling. However, pretreatment of the monolith by rinsing with 30% acetonitrile was necessary to obtain the best retention. Additionally, the monolith formulation was not fully optimized for flow and retention characteristics.
In this paper, we report the fabrication and optimization of microfluidic columns for SPE and on-chip labeling. Monoliths were prepared by in-situ photopolymerization in microchannels. Different types and concentrations of monomers were evaluated, and retention of model proteins was observed without the need for column preconditioning. On-chip labeling of model proteins was achieved by driving solutions through the monolith using voltage and incubating fluorescent dye with protein retained in the monolith. Subsequently, the labeled protein was eluted by applying voltages to reservoirs on the microdevice to drive eluent through the monolith and detected by laser-induced fluorescence. Monoliths prepared from octyl methacrylate showed the best combination of protein retention while still allowing unattached fluorescent label to be eluted in a separate fraction with 50% acetonitrile. Finally, we demonstrated automation of on-chip capture, fluorescence labeling, and elution of proteins.
2. Experimental Section
2.1 Materials and reagents
Cyclic olefin copolymer plates (either 6″ x 6″, 1 mm thickness; or 4″ x 6″, 2 mm thickness) were obtained from Zeon Chemicals (Zeonor 1020R, Louisville, KY). Methyl methacrylate (MMA), butyl methacrylate (BMA), octyl methacrylate (OMA), lauryl methacrylate (LMA), 2,2-dimethoxy-2-phenylacetophenone (DMPA), 1-dodecanol, ethylene dimethacrylate (EDMA), and isopropyl alcohol were purchased from Sigma–Aldrich (St. Louis, MO). Cyclohexanol and dimethyl sulfoxide (DMSO) were from J. T. Baker (Phillipsburg, NJ). Tween 20 was purchased from Mallinckrodt Baker (Paris, KY). Hydroxypropyl cellulose (HPC, 100 kDa average molecular weight) was from Aldrich (Milwaukee, WI). Sodium dodecyl sulfate (SDS) was obtained from Fisher Scientific (Pittsburgh, PA). Bovine serum albumin (BSA) and heat shock protein 90 (HSP90) were purchased from New England Biolabs (Ipswich, MA, USA). BSA was labeled with fluorescein isothiocyanate (FITC), while HSP90 was labeled with Alexa Fluor 488 TFP ester. Both fluorophores were obtained from Invitrogen (Carlsbad, CA). Anhydrous sodium carbonate, sodium bicarbonate and acetonitrile (ACN) were obtained from EMD Chemicals (Gibbstown, NJ). Bicarbonate buffer solution was prepared by mixing sodium carbonate and sodium bicarbonate with deionized water and diluting to 10 mM carbonate, resulting in pH 9.3.
Off-chip labeling of HSP90 with Alexa Fluor TFP 488 ester was done using a process similar to the one described by Nge et al. [40]. Briefly, HSP90 solution was prepared in bicarbonate buffer at a concentration of 220 μg/mL. Alexa Fluor 488 TFP ester solution (5 μL) with a concentration of 10 mg/mL in DMSO was added to 250 μL of protein solution and incubated in the dark overnight at room temperature. Unconjugated dye was filtered from the protein using an Eppendorf 5418 centrifugal filter. The labeled protein samples were collected and then stored in the dark at 4 °C until use.
2.2 Device fabrication
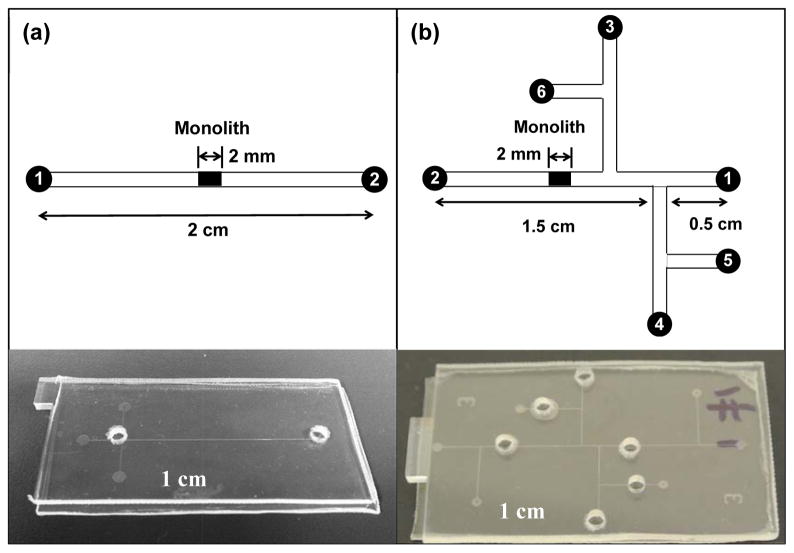
Individual COC plates were obtained by cutting a COC sheet into pieces, each having a length of 5 cm and a width of 2.5 cm, with an electric motor saw. Reservoirs were produced by drilling holes in the cover plate before device bonding. The microdevices were fabricated using a combination of photolithographic patterning, etching, hot embossing and thermal bonding as described by Kelly et al. [41]. Bonding of COC was done at 110 °C for 24 min. A simple, two-reservoir layout (Figure 1a) was used for preliminary testing, and a six-reservoir layout was used for automated and integrated SPE and on-chip labeling (Figure 1b). The channels in the design were approximately 50 μm wide and 20 μm deep. Channels were rinsed with isopropyl alcohol prior to polymerization of the monolith.
Figure 1.
Schematic designs and photographs of microfluidic devices. (a) A single channel with two reservoirs for SPE and on-chip labeling. (b) A six-reservoir device for integrated and automated experiments, in which the reservoirs are: 1 and 2 - loading buffer, 3-elution buffer, 4-dye, 5-protein, and 6-rinsing buffer. All the channels have a width of 50 μm and a depth of 20 μm.
Monoliths were fabricated by a modification of a previously reported recipe [39]. Porogens, photoinitiator, and Tween 20 were weighed according to the values listed in Table 1 and mixed with each different monomer (i.e., MMA, BMA, OMA, or LMA). The solution was sonicated until the photoinitiator was completely dissolved and then degassed for 5 min. It was next loaded into the device, and black tape was used as a mask to expose only the desired chip region to UV radiation. Exposure was carried out with a SunRay 400 lamp (Intelligent Dispensing Systems, Encino, CA) at 200 W for 12–15 min. A 2 mm long monolith was formed in each microdevice in the location indicated in Figure 1. After polymerization, devices were rinsed with isopropyl alcohol. Then each device was washed with deionized water several times and air-dried prior to characterization and testing.
Table 1.
Monolith composition.
| Monomer | Cross-linker | Porogen | Photoinitiator | Surfactant | |
|---|---|---|---|---|---|
| EDMA | cyclohexanol | 1-dodecanol | DMPA | Tween 20 | |
| 29.7% | 14.9% | 18.8% | 17.8% | 1.0% | 17.8% |
Scanning electron microscopy (SEM) was carried out using a Philips XL30 ESEM FEG apparatus in low vacuum mode. A potential of 10–12 V was applied to the surface depending on the extent to which the monolith charged. The edge that contained the monolith was cut manually using a microtome with a glass knife. Once the monolith was exposed, the surface was cleaned using adhesive tape to remove debris. Then the sample was mounted on aluminum stubs using carbon tape and coated with silver using a Polaron Sputterer to reduce charging during SEM imaging. The samples were coated under an applied potential of 2.5 kV and a current of 18–20 mA for 3 min.
2.3 Device operation
Before sample loading, monolithic columns were rinsed with 2-propanol several times to clean the surface, and then bicarbonate buffer was flowed into the channel. Next, the stability of the current was examined by applying +600 V to reservoir 2 and grounding reservoir 1 for 1 min; simultaneously, the microdevice was observed in an optical microscope to make sure no bubbles were trapped in the microchannel.
Retention and elution on monoliths
To evaluate the extent to which different samples were retained on monoliths, fluorescent dyes (FITC and Alexa Fluor 488 TFP ester, each 100 nM) and two labeled proteins (BSA and HSP90, 200 ng/mL) were transferred into reservoir 1 and loaded by applying +400 V to reservoir 2 for 5 min and grounding reservoir 1 as shown in Figure 1a. Rinsing was done by replacing the sample in reservoir 1 with buffers having different ACN concentrations (30% or 50%) and applying +400 or +600 V to reservoir 2 for 2 min. For elution, the rinse buffer in reservoir 1 was replaced with eluent consisting of 85% ACN, 15% bicarbonate buffer, 0.05% HPC and 0.05% SDS; then, reservoir 1 was grounded and +600 V or +1000 V was applied to reservoir 2.
On-chip labeling
For on-chip labeling experiments (Figure 1a), unlabeled protein samples were loaded in the same way as in the retention and elution experiments. Next, reservoir 1 was rinsed and filled with fluorescent dye solution (10 mg/mL) in DMSO. This solution was driven through the column by applying the same voltages as in loading for 10 min, followed by incubation for 10–15 min with the voltage off. Rinsing was performed by replacing the labeling solution in reservoir 1 with buffer having different ACN concentrations (30% or 50%) and applying the same voltages as in the previous step for 10 min. For elution, the rinse solution in reservoir 1 was replaced with eluent consisting of 85% ACN and 15% bicarbonate buffer. During elution, reservoir 1 was grounded while +600 V was applied to reservoir 2 for 10 min.
Automated extraction, labeling and elution
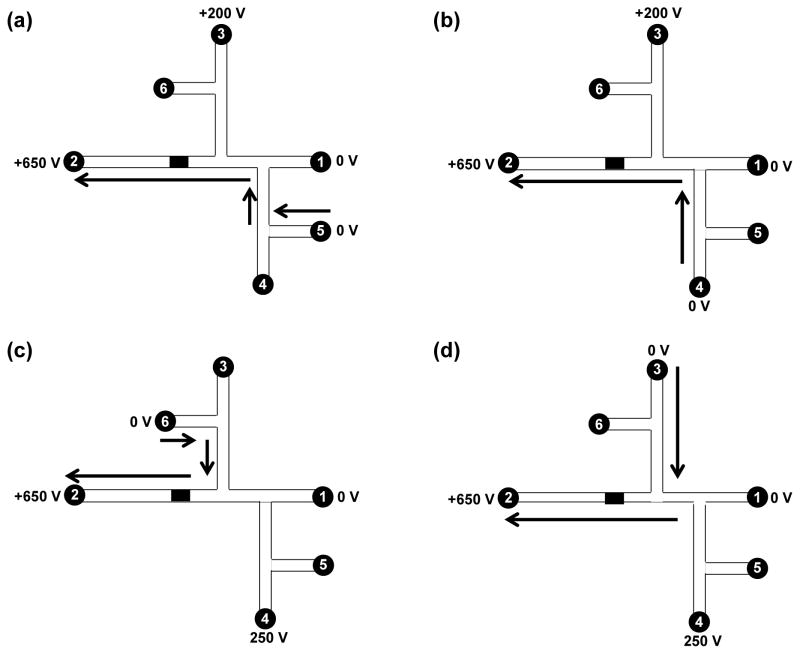
For experiments conducted on the integrated microdevices shown in Figure 1b, platinum wires were inserted into the solution-filled reservoirs to provide electrical contact. Two high-voltage power supplies provided all applied potentials. A custom-designed voltage-switching box was controlled by LabView and applied potentials to the microchips. Reservoirs 1 and 2 were filled with bicarbonate buffer, and reservoirs 3 to 6 were filled with elution solution (85% ACN and 15% bicarbonate buffer), dye, HSP90 (20 nM), and rinsing solution (50% ACN and 50% bicarbonate buffer), respectively. The sequence of voltages applied for the various operation steps is shown in Figure 2.
Figure 2.
Schematic of automated device operation: (a) loading, (b) labeling, (c) rinsing and (d) elution. Reservoirs 1 and 2 were filled with bicarbonate buffer, and reservoirs 3 to 6 were filled with elution solution (85% ACN and 15% bicarbonate buffer), fluorescent label, HSP90 and rinsing solution (50% ACN and 50% bicarbonate buffer), respectively. (a) For sample loading, reservoirs 1 and 5 were grounded, and +650 V and +200 V were applied to reservoirs 2 and 3, respectively. (b) For sample labeling, reservoirs 1 and 4 were grounded, and +650 V and +200 V were applied to reservoirs 2 and 3, respectively. (c) For rinsing, reservoirs 1 and 6 were grounded, and +650 V and +250 V were applied to reservoirs 2 and 4, respectively. (d) For elution, reservoirs 1 and 3 were grounded, and +650 V and +250 V were applied to reservoirs 2 and 4, respectively. The solution flow directions are indicated by arrows.
2.4 Fluorescence data collection and analysis
Retention and elution were monitored via CCD detection by measuring the background-subtracted fluorescence intensity after rinsing and elution. A Nikon Eclipse TE300 inverted microscope equipped with a CCD camera (Coolsnap HQ, Roper Scientific, Sarasota, FL) was used for imaging. A 488 nm blue laser (JDSU, Shenzhen, China) with a 10X expander was directed to a 10X, 0.45 NA objective on the microscope. For fluorescence monitoring, the detection point was positioned either next to reservoir 2 (Figure 1a and 1b), or directly on the monolith. The collected CCD images were analyzed using V++ Precision Digital Imaging software (Auckland, New Zealand).
Photomultiplier tube (PMT) detection was also utilized, in which the detection point was positioned next to reservoir 2. Collected fluorescence went through a D600/60 band-pass filter (Chroma, Rockingham, VT) and was detected at a Hamamatsu PMT (HC120-05, Bridgewater, NJ); out-of-focus light was blocked by a 1000 μm diameter pinhole. The PMT voltage output was processed by a preamplifier (SR-560, Stanford Research Systems, Sunnyvale, CA) and an analog-to-digital converter (PCI 6035E, National Instruments, Austin, TX) and was recorded by LabView software running on a Dell computer.
3. Results and Discussion
3.1 Optimization of monoliths
Thermally bonded COC devices with monoliths formed from different monomers were prepared. COC was chosen as the substrate material because of its stability in common organic solvents, such as ACN used in this study for sample elution. Poly(methyl methacrylate) dissolves in ACN, while poly(dimethylsiloxane) requires additional surface modification and also swells in solvents [42–44]. Additives like UV absorbers used to stabilize polymers such as COC may affect the UV dose in the channel during monolith polymerization; however, we were always able to get sufficient radiation into the channels to form monoliths in the 12–15 min reaction time. During monolith polymerization Tween 20 was added as a surfactant to increase the through pore size by affecting phase separation through emulsion. Surfactant content was selected to be 30%, since monoliths prepared with higher surfactant content produced bubbles when voltage was applied, which hindered the flow of solution in the microchannel [45]. A 55% total porogen content was selected since monolith rigidity became too low if high porogen content was used, as reported in a previous study by Pagaduan et al. [45].
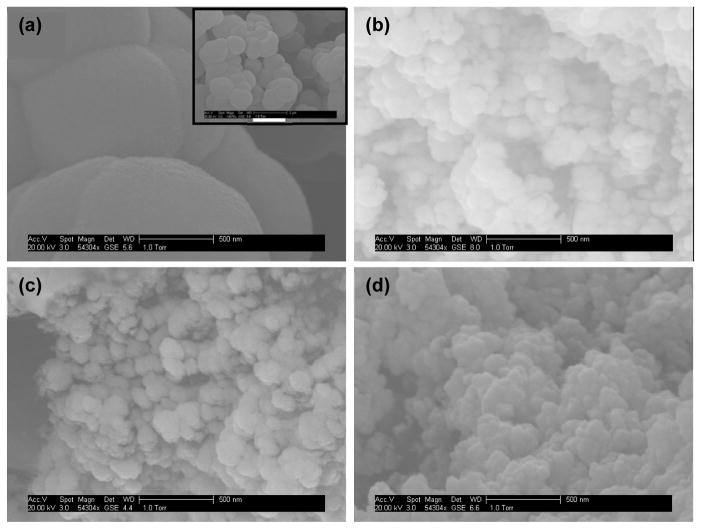
In this work, monoliths were prepared from four different types of monomers (MMA, BMA, OMA and LMA). Figure 3 shows SEM images of monoliths prepared with the different monomers. For monoliths prepared from MMA (Figure 3a), evenly packed nodules with diameters of 500–2000 nm were observed. Through pores formed by the voids between these nodules were in the same size range. For monoliths prepared from the other three monomers, nodules with much smaller sizes were observed (Figure 3b-d), which resulted in more surface area and hence more binding capacity. For BMA monoliths (Figure 3b), through pores with diameters of several hundreds of nanometers were observed. Uniform material was found only within the central section of the monolith, while the majority of the channel contained discrete porous clusters of different lengths. This is consistent with the observations of Ramsey and Collins [46], which were explained by localized fluid flow during in situ photopolymerization. For monoliths prepared from OMA and LMA (Figure 3c-d), different sizes of through pores formed by agglomerates of nodules with dimensions of ~100 nm were observed, which is favorable since irregular pores enhance convective transport as liquids flow through the monolith [47].
Figure 3.
SEM images of monoliths prepared from (a) MMA (scale bar for the inset: 2 μm), (b) BMA, (c) OMA and (d) LMA.
Upon application of voltage for rinsing and elution, none of the monoliths moved, in agreement with results from Ladner et al. [48] and Nge et al. [39]. As a result, complicated column pretreatments such as photografting were avoided [48]. Figure 4 shows the background-subtracted fluorescence signal after both retention and elution of BSA on monoliths prepared from different monomers. We observed that the retention of BSA after rinsing with 50% ACN increased with carbon chain length for monoliths prepared from MMA, BMA and OMA, consistent with the monomer hydrophobicity. For monoliths prepared from a MMA and LMA mixture, the retention of BSA was comparable to that obtained on ones prepared from OMA, which is explained by the combined hydrophobicity of MMA and LMA. For monoliths prepared from a BMA and LMA mixture, higher retention was observed, which is due to the greater hydrophobicity of BMA compared to MMA. Fluorescent intensities on MMA, BMA and OMA monoliths after elution with 85% ACN were very low (see Fig. 4), indicating that the retained BSA on the column was eluted almost completely under these conditions. In contrast, the fluorescent intensities for BSA on both types of mixed LMA monoliths after elution with 85% ACN were readily detectable (see Fig. 4), indicating stronger interaction between BSA and these monoliths. Additionally, for LMA mixed monoliths, buffer flow through the column was limited, requiring higher voltage to achieve adequate flow. We note that optimal sample preconcentration in our system consists of high protein retention on the monolith after rinsing with 50% ACN, followed by complete removal of protein during the 85% ACN elution step. Based on these considerations, we chose monoliths prepared from OMA for subsequent work.
Figure 4.
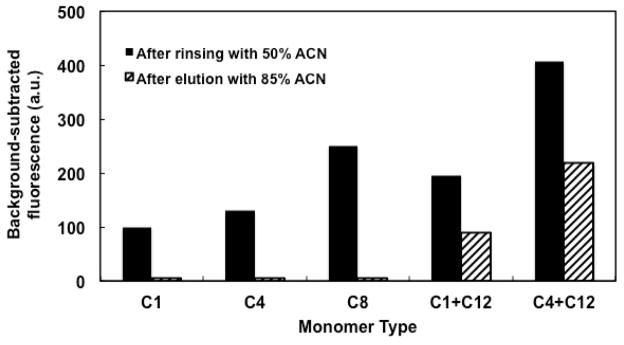
Background-subtracted fluorescent signal of 200 ng/mL FITC-labeled BSA on monoliths prepared from different types of monomers after rinsing with 50% ACN (solid bars) and after eluting with 85% ACN (striped bars).
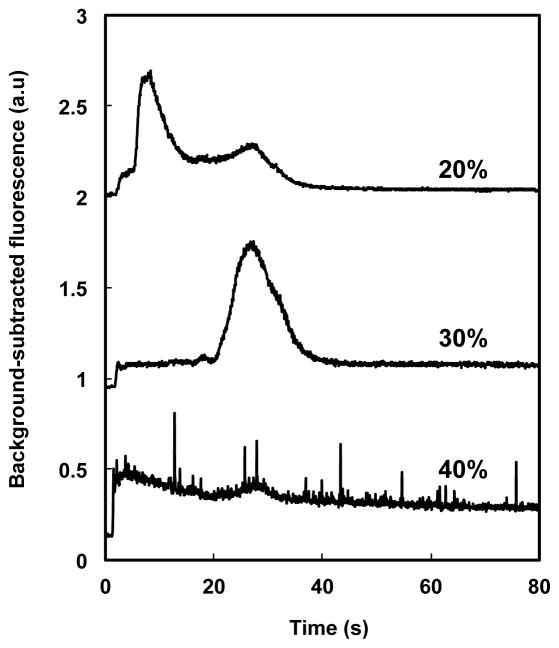
Retention results provide further insights into the optimization of these monoliths. Figure 5 shows a comparison of elution in 85% ACN of FITC-labeled BSA from monoliths prepared with 20, 30, and 40 wt% OMA (relative to the total weight of monolith pre-polymer solution). For the monolith prepared with 20 wt% OMA, two overlapping peaks were observed during elution. The first large peak is attributed to unreacted fluorescent dye, while the second (smaller) one is assigned to FITC-labeled BSA, suggesting that both BSA and FITC were retained on the monolith after the 50% ACN rinse. For the monolith prepared with 30 wt% OMA, a single peak of BSA was observed, indicating successful retention of BSA with limited retention of fluorescent dye after the 50% ACN rinse. For the monolith prepared with 40 wt% OMA, no distinct protein or dye peak was observed, which we attribute to stronger interaction between protein and monolith with increased monomer content, such that essentially no protein was eluted even with 85% ACN. From these experiments we chose an OMA monomer concentration of 30 wt% as best suited for protein retention and elution.
Figure 5.
Elution of FITC-labeled BSA with 85% ACN from monoliths prepared with different concentrations of OMA. From top to bottom: 20, 30 and 40 wt% OMA in the polymerization mixture. Chromatograms are offset vertically.
3.2 Retention and elution with OMA monoliths
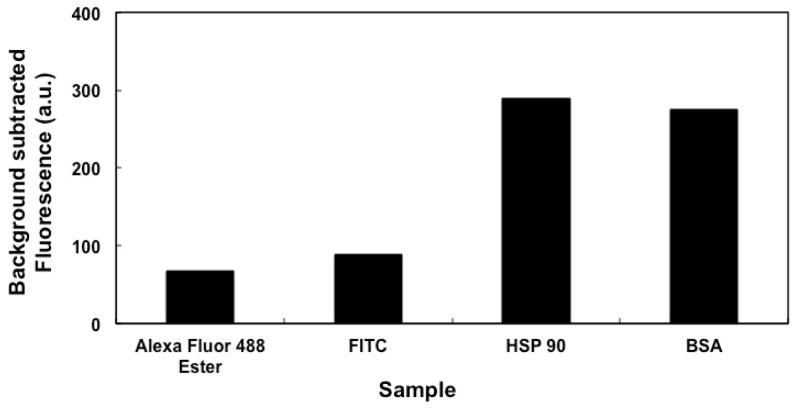
Figure 6 shows the background-subtracted fluorescence signal, indicative of retention of fluorescent dyes and labeled proteins on OMA monoliths after 50% ACN rinsing. Retention of the fluorescent dyes (Alexa Fluor 488 TFP ester and FITC) on the OMA monolith was lower than retention of proteins (HSP90 and BSA), which is consistent with results reported by Nge et al. [39]. Previous studies showed that preconditioning of monolithic columns influences the retention of amino acids and proteins [49]. Nge et al. [39] showed that protein retention increased when a BMA monolith was rinsed with 30% ACN just before sample loading. This pre-rinse helped remove impurities and activate and/or hydrate the monolith surface to provide adequate contact with the liquid sample [50]. In Figure 6 good retention of proteins on OMA monoliths was observed without any preconditioning with ACN, which may be explained by the difference in hydrophobicity between BMA and OMA monoliths.
Figure 6.
Background-subtracted fluorescence from retention of dyes and proteins on an OMA monolith after rinsing with 50% ACN.
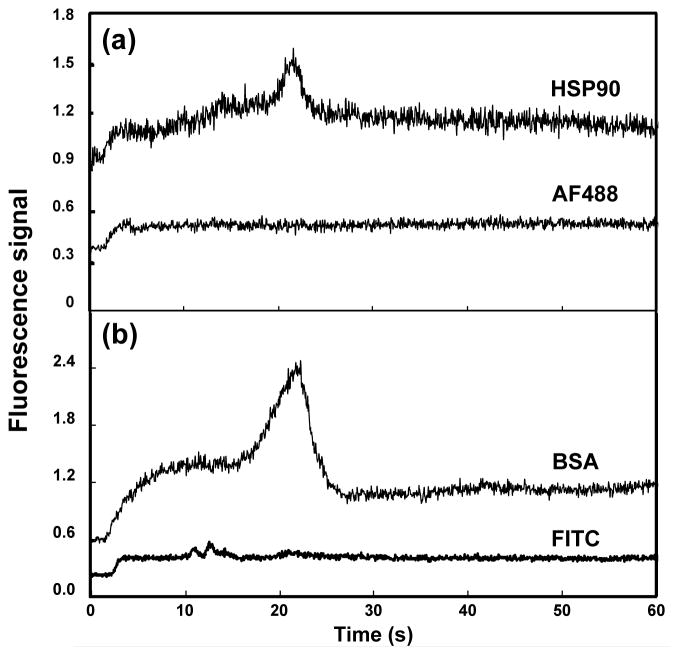
Figure 7 shows 85% ACN elution profiles of labeled proteins and their corresponding fluorescent dyes that were retained on an OMA monolith after rinsing with 50% ACN. For the elution of HSP90 and Alexa Fluor 488 TFP ester (Figure 7a), a large peak of HSP90 was seen at approximately 20 seconds, while a small peak for Alexa Fluor 488 TFP ester was observed at around 5 seconds. The labeled HSP90 was retained on the monolith after rinsing with 50% ACN but was eluted using 85% ACN, while most of the Alexa Fluor 488 TFP ester was rinsed off with 50% ACN, consistent with their retention in Figure 6. In a different experiment done under the same conditions and after a 50% ACN rinse (Figure 7b), a large peak of labeled BSA was eluted at about 20 seconds in 85% ACN, while small peaks corresponding to FITC were observed in the 85% ACN elution at about 12 seconds, again confirming successful retention and elution of protein separate from fluorescent label with an OMA monolith.
Figure 7.
Elution profiles in 85% ACN of fluorescent dyes and labeled proteins from OMA monolithic columns. (a) HSP90 (top) and Alexa Fluor 488 TFP ester (bottom); (b) BSA (top) and FITC (bottom). Traces are offset vertically.
3.3 Off- and on-chip labeling of HSP90 with Alexa Fluor 488 TFP ester
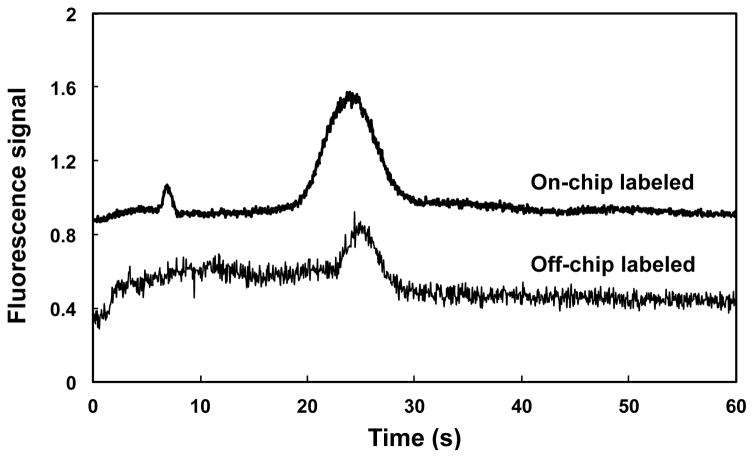
Figure 8 shows elution profiles for HSP90 labeled off- and on-chip with Alexa Fluor 488 TFP ester. The elution of HSP90 labeled on-chip with Alexa Fluor TFP 488 ester was similar to that for protein labeled off-chip. Protein peaks in both samples appeared at approximately the same time (~25 s). A small peak at ~8 seconds was observed in the on-chip labeled sample, which is attributed to unconjugated fluorescent dye due to the shorter incubation time for on-chip labeling (15 min versus overnight for off-chip labeling). Longer protein loading times resulted in broader eluted peaks; in addition, longer labeling times required us to use longer rinse times to adequately remove the unattached fluorophore. Minor variations in elution times of peaks occur because experiments were carried out in different devices. Although laminar flow in microfluidic channels generally limits the mixing of fluids, in our devices the use of a monolith (with tortuous flow paths) for retention and labeling facilitates mixing [37] and thus reaction of fluorophore and protein. The results in Figure 8 show that on-chip labeling can be integrated with automated SPE in a single microfluidic device.
Figure 8.
Elution profiles in 85% ACN for HSP90 labeled on-chip (top) and off-chip (bottom). Traces are offset vertically.
3.4 Automated extraction, labeling and elution
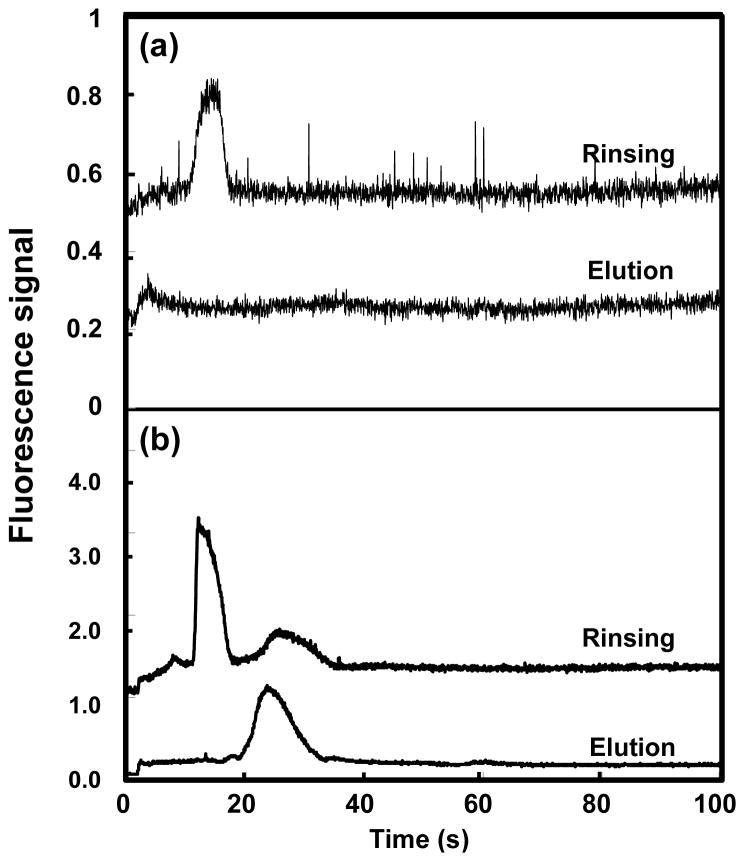
To test the feasibility of automated and integrated on-chip SPE and fluorescence labeling, a six-reservoir microchip with an OMA monolith in the microchannel (Figure 1b) was used. Automated loading, retention, rinsing and elution of 10 mg/mL Alexa Fluor 488 TFP ester by itself, as well as on-chip HSP90 loading, retention, fluorescent labeling with Alexa Fluor 488 TFP ester, rinsing and elution were carried out following the procedures outlined in Figure 2. As shown in Figure 9a, for the Alexa Fluor 488 TFP ester solution, a single peak at ~17 seconds was observed in the rinsing step with 50% ACN, while a small peak was observed at ~5 seconds during elution with 85% ACN, indicating that nearly all of the dye was eluted from the monolith during rinsing. For on-chip labeling of HSP90 (Figure 9b), a peak at ~15 seconds was observed in the 50% ACN rinse step, similar to the one observed in Figure 9a when Alexa Fluor 488 TFP ester was loaded. A minor peak at ~28 seconds may indicate a small amount of protein being eluted during the rinsing step. During 85% ACN elution of the on-chip labeled HSP90 (Figure 9b), a single peak at ~24 seconds was observed, indicating that HSP90 was successfully retained, labeled, and then eluted in an automated manner in the microfluidic system.
Figure 9.
Rinsing (with 50% ACN) and elution (with 85% ACN) of (a) 10 mg/mL Alexa Fluor 488 TFP ester and (b) on-chip labeled HSP90 in an integrated and automated microdevice. Traces are offset vertically.
4. Conclusions
Reversed-phase, polymeric monoliths in cyclic olefin copolymer microfluidic devices were prepared and optimized. Additionally, a model protein (HSP90) was loaded, retained and fluorescently labeled on-chip; then, unreacted dye was eluted separately from the labeled protein in an automated manner. The combination of SPE and on-chip labeling could potentially address important sample preparation needs such as preconcentration and pretreatment. The ease of monolith preparation and fast on-chip labeling could also reduce analysis time and effort compared other techniques. In addition, this approach could be further integrated with other sample preparation and separation techniques to achieve enhanced specificity for more complicated bioanalyses.
In these experiments we were able to demonstrate proof of concept of SPE and labeling using polymeric monoliths; however, quantification of protein biomarkers will require more work. There are several device parameters can be further modified to achieve better quantification capabilities. First, the ratio of monomer to porogen can be adjusted to change the column porosity, which influences the surface area, flow rate, and the resultant retention and elution. In addition, experimental conditions, such as the maximum voltage that can be applied without solvent evaporation due to Joule heating, are also affected by surface area and porosity. Moreover, column length can be tuned to vary loading capacity. With these conditions optimized, it should be possible for quantitative experiments to be conducted, and corresponding calibration methods to be established.
Importantly, the monoliths reported in this work have potential to be integrated with upstream immunoaffinity extraction and downstream electrophoresis separation. We have previously demonstrated the integration of immunoaffinity extraction and electrophoresis separation for cancer-relevant proteins in blood serum [21,51]. Therefore, in future studies biofluids could be loaded in a device and first passed through an affinity column, in which target biomarkers would be extracted via antibody-antigen interaction. Subsequently, the extracted biomarkers could be released and passed through a monolithic column like those optimized herein for preconcentration and fluorescence labeling. Finally, labeled biomarkers would be eluted, and then separated and quantified by microchip electrophoresis.
Acknowledgments
We thank Dr. Pamela Nge for her training and assistance. We also thank the BYU Microscopy Laboratory for help with SEM imaging. Funding for this work was provided by the National Institutes of Health under grant R01 EB006124.
References
- 1.Giribaldi G, Barbero G, Mandili G, Daniele L, Khadjavi A, Notarpietro A, Ulliers D, Prato M, Minero VG, Battaglia A, Allasia M, Bosio A, Sapino A, Gontero P, Frea B, Fontana D, Destefanis P. Proteomic identification of Reticulocalbin 1 as potential tumor marker in renal cell carcinoma. J Proteomics. 2013;91:385–392. doi: 10.1016/j.jprot.2013.07.018. [DOI] [PubMed] [Google Scholar]
- 2.Gomes IM, Arinto P, Lopes C, Santos CR, Maia CJ. STEAP1 is overexpressed in prostate cancer and prostatic intraepithelial neoplasia lesions, and it is positively associated with Gleason score. Urol Oncol Semin Orig Invest. 2014;32(1):53.e23–53.e29. doi: 10.1016/j.urolonc.2013.08.028. [DOI] [PubMed] [Google Scholar]
- 3.McKinley ET, Liu H, McDonald WH, Luo W, Zhao P, Coffey RJ, Hanks SK, Manning HC. Global phosphotyrosine proteomics identifies PKCδ as a marker of responsiveness to Src inhibition in colorectal cancer. PLoS One. 2013;8 (11):e80207. doi: 10.1371/journal.pone.0080207. [DOI] [PMC free article] [PubMed] [Google Scholar]
- 4.Oyama K, Fushida S, Kinoshita J, Okamoto K, Makino I, Nakamura K, Hayashi H, Inokuchi M, Nakagawara H, Tajima H, Fujita H, Takamura H, Ninomiya I, Kitagawa H, Fujimura T, Ohta T. Serum cytokeratin 18 as a biomarker for gastric cancer. Clin Exp Med. 2013;13 (4):289–295. doi: 10.1007/s10238-012-0202-9. [DOI] [PubMed] [Google Scholar]
- 5.Wang C-H, Lai H-C, Liou T-M, Hsu K-F, Chou C-Y, Lee G-B. A DNA methylation assay for detection of ovarian cancer cells using a HpaII/MspI digestion-based PCR assay in an integrated microfluidic system. Microfluid Nanofluid. 2013;15 (5):575–585. [Google Scholar]
- 6.Wang J, Sharma A, Ghamande SA, Bush S, Ferris D, Zhi W, He M, Wang M, Wang X, Miller E, Hopkins D, Macfee M, Guan R, Tang J, She J-X. Serum protein profile at remission can accurately assess therapeutic outcomes and survival for serous ovarian cancer. PLoS One. 2013;8 (11):e78393. doi: 10.1371/journal.pone.0078393. [DOI] [PMC free article] [PubMed] [Google Scholar]
- 7.Esplin S, Merrell K, Goldenberg R, Lai YL, Iams JD, Mercer B, Spong CY, Miodovnik M, VanDorsten P, Dombrowski M. Proteomic identification of serum peptides predicting subsequent spontaneous preterm birth. Am J Obstet Gynecol. 2011;204 (391):e1–8. doi: 10.1016/j.ajog.2010.09.021. [DOI] [PMC free article] [PubMed] [Google Scholar]
- 8.Graves S, Esplin S. Validation of predictive preterm birth biomarkers obtained by maternal serum proteomics. Am J Obstet Gynecol. 2011;204 (1):S46. [Google Scholar]
- 9.Wang J, Chen G, Jiang H, Li Z, Wang X. Advances in nano-scaled biosensors for biomedical applications. Analyst. 2013;138 (16):4427–4435. doi: 10.1039/c3an00438d. [DOI] [PubMed] [Google Scholar]
- 10.Ishihama Y. Proteomic LC-MS systems using nanoscale liquid chromatography with tandem mass spectrometry. J Chromatogr, A. 2005;1067 (1–2):73–83. doi: 10.1016/j.chroma.2004.10.107. [DOI] [PubMed] [Google Scholar]
- 11.Dalvie MA, Sinanovic E, London L, Cairncross E, Solomon A, Adam H. Cost analysis of ELISA, solid-phase extraction, and solid-phase microextraction for the monitoring of pesticides in water. Environ Res. 2005;98 (1):143–150. doi: 10.1016/j.envres.2004.09.002. [DOI] [PubMed] [Google Scholar]
- 12.Benhabib MC, TN, Stockton AM, Scherer JR, Mathies RA. Multichannel capillary electrophoresis microdevice and instrumentation for in situ planetary analysis of organic molecules and biomarkers. Anal Chem. 2010;82:2372–2379. doi: 10.1021/ac9025994. [DOI] [PubMed] [Google Scholar]
- 13.Janasek D, Franzke J, Manz A. Scaling and the design of miniaturized chemical-analysis systems. Nature. 2006;442 (7101):374–380. doi: 10.1038/nature05059. [DOI] [PubMed] [Google Scholar]
- 14.Nge PN, Rogers CI, Woolley AT. Advances in Microfluidic Materials, Functions, Integration, and Applications. Chem Rev. 2013;113 (4):2550–2583. doi: 10.1021/cr300337x. [DOI] [PMC free article] [PubMed] [Google Scholar]
- 15.Sackmann EK, Fulton AL, Beebe DJ. The present and future role of microfluidics in biomedical research. Nature. 2014;507 (7491):181–189. doi: 10.1038/nature13118. [DOI] [PubMed] [Google Scholar]
- 16.Baratchi S, Khoshmanesh K, Sacristan C, Depoil D, Wlodkowic D, McIntyre P, Mitchell A. Immunology on chip: Promises and opportunities. Biotechnol Adv. 2014;32 (2):333–346. doi: 10.1016/j.biotechadv.2013.11.008. [DOI] [PubMed] [Google Scholar]
- 17.Romanov V, Davidoff SN, Miles AR, Grainger DW, Gale BK, Brooks BD. A critical comparison of protein microarray fabrication technologies. Analyst. 2014;139 (6):1303–1326. doi: 10.1039/c3an01577g. [DOI] [PubMed] [Google Scholar]
- 18.Arora A, Giuseppina S, Salieb-Beugelaar GB, Kim JT, Manz A. Latest Developments in Micro Total Analysis Systems. Anal Chem. 2010;82 (12):4830–4847. doi: 10.1021/ac100969k. [DOI] [PubMed] [Google Scholar]
- 19.Verbarg J, Kamgar-Parsi K, Shields AR, Howell PB, Ligler FS. Spinning magnetic trap for automated microfluidic assay systems. Lab Chip. 2012;12 (10):1793–1799. doi: 10.1039/c2lc21189k. [DOI] [PMC free article] [PubMed] [Google Scholar]
- 20.Yang H, Mudrik JM, Jebrail MJ, Wheeler AR. A digital microfluidic method for in situ formation of porous polymer monoliths with application to solid-phase extraction. Anal Chem. 2011;83 (10):3824–3830. doi: 10.1021/ac2002388. [DOI] [PubMed] [Google Scholar]
- 21.Yang W, Yu M, Sun X, Woolley AT. Microdevices integrating affinity columns and capillary electrophoresis for multibiomarker analysis in human serum. Lab Chip. 2010;10 (19):2527–2533. doi: 10.1039/c005288d. [DOI] [PMC free article] [PubMed] [Google Scholar]
- 22.Njoroge SK, Witek MA, Battle KN, Immethun VE, Hupert ML, Soper SA. Integrated continuous flow polymerase chain reaction and micro-capillary electrophoresis system with bioaffinity preconcentration. Electrophoresis. 2011;32 (22):3221–3232. doi: 10.1002/elps.201100274. [DOI] [PubMed] [Google Scholar]
- 23.Nguyen T, Pei R, Stojanovic M, Lin Q. An aptamer-based microfluidic device for thermally controlled affinity extraction. Microfluid Nanofluid. 2009;6 (4):479–487. [Google Scholar]
- 24.Liu J, Chen C-F, Tsao C-W, Chang C-C, Chu C-C, De Voe DL. Polymer Microchips Integrating Solid-Phase Extraction and High-Performance Liquid Chromatography Using Reversed-Phase Polymethacrylate Monoliths. Anal Chem. 2009;81 (7):2545–2554. doi: 10.1021/ac802359e. [DOI] [PMC free article] [PubMed] [Google Scholar]
- 25.Pumera M. Microchip-based electrochromatography: designs and applications. Talanta. 2005;66 (4):1048–1062. doi: 10.1016/j.talanta.2005.01.006. [DOI] [PubMed] [Google Scholar]
- 26.Gijs MAM, Lacharme F, Lehmann U. Microfluidic Applications of Magnetic Particles for Biological Analysis and Catalysis. Chem Rev. 2010;110 (3):1518–1563. doi: 10.1021/cr9001929. [DOI] [PubMed] [Google Scholar]
- 27.Verpoorte E. Beads and chips: New recipes for analysis. Lab Chip. 2003;3 (4):60N–68N. doi: 10.1039/b313217j. [DOI] [PubMed] [Google Scholar]
- 28.Oleschuk RD, Shultz-Lockyear LL, Ning Y, Harrison DJ. Trapping of bead-based reagents within microfluidic systems. On-chip solid-phase extraction and electrochromatography. Anal Chem. 2000;72 (3):585–590. doi: 10.1021/ac990751n. [DOI] [PubMed] [Google Scholar]
- 29.Andersson H, van der Wijngaart W, Enoksson P, Stemme G. Micromachined flow-through filter-chamber for chemical reactions on beads. Sens Actuators, B. 2000;67 (1–2):203–208. [Google Scholar]
- 30.Sato K, Tokeshi M, Odake T, Kimura H, Ooi T, Nakao M, Kitamori T. Integration of an Immunosorbent Assay System: Analysis of Secretory Human Immunoglobulin A on Polystyrene Beads in a Microchip. Anal Chem. 2000;72 (6):1144–1147. doi: 10.1021/ac991151r. [DOI] [PubMed] [Google Scholar]
- 31.Ceriotti L, de Rooij NF, Verpoorte E. An integrated fritless column for on-chip capillary electrochromatography with conventional stationary phases. Anal Chem. 2002;74 (3):639–647. doi: 10.1021/ac0109467. [DOI] [PubMed] [Google Scholar]
- 32.Andersson H, Jonsson C, Moberg C, Stemme G. Patterned self-assembled beads in silicon channels. Electrophoresis. 2001;22 (18):3876–3882. doi: 10.1002/1522-2683(200110)22:18<3876::AID-ELPS3876>3.0.CO;2-P. [DOI] [PubMed] [Google Scholar]
- 33.Woodward SD, Urbanova I, Nurok D, Svec F. Separation of Peptides and Oligonucleotides Using a Monolithic Polymer Layer and Pressurized Planar Electrophoresis and Electrochromatography. Anal Chem. 2010;82 (9):3445–3448. doi: 10.1021/ac100392b. [DOI] [PubMed] [Google Scholar]
- 34.Yu C, Davey MH, Svec F, Frechet JMJ. Monolithic porous polymer for on-chip solid-phase extraction and preconcentration prepared by photoinitiated in situ polymerization within a microfluidic device. Anal Chem. 2001;73 (21):5088–5096. doi: 10.1021/ac0106288. [DOI] [PubMed] [Google Scholar]
- 35.Tan A, Benetton S, Henion JD. Chip-based solid-phase extraction pretreatment for direct electrospray mass spectrometry analysis using an array of monolithic columns in a polymeric substrate. Anal Chem. 2003;75 (20):5504–5511. doi: 10.1021/ac030196w. [DOI] [PubMed] [Google Scholar]
- 36.Shediac R, Ngola SM, Throckmorton DJ, Anex DS, Shepodd TJ, Singh AK. Reversed-phase electrochromatography of amino acids and peptides using porous polymer monoliths. J Chromatogr A. 2001;925 (1–2):251–263. doi: 10.1016/s0021-9673(01)01036-6. [DOI] [PubMed] [Google Scholar]
- 37.Rohr T, Yu C, Davey MH, Svec F, Frechet JMJ. Porous polymer monoliths: simple and efficient mixers prepared by direct polymerization in the channels of microfluidic chips. Electrophoresis. 2001;22 (18):3959–3967. doi: 10.1002/1522-2683(200110)22:18<3959::AID-ELPS3959>3.0.CO;2-5. [DOI] [PubMed] [Google Scholar]
- 38.Yu C, Mutlu S, Selvaganapathy P, Mastrangelo CH, Svec F, Frechet JMJ. Flow Control Valves for Analytical Microfluidic Chips without Mechanical Parts Based on Thermally Responsive Monolithic Polymers. Anal Chem. 2003;75 (8):1958–1961. doi: 10.1021/ac026455j. [DOI] [PubMed] [Google Scholar]
- 39.Nge PN, Pagaduan JV, Yu M, Woolley AT. Microfluidic chips with reversed-phase monoliths for solid phase extraction and on-chip labeling. J Chromatogr A. 2012;1261:129–135. doi: 10.1016/j.chroma.2012.08.095. [DOI] [PMC free article] [PubMed] [Google Scholar]
- 40.Nge PN, Yang W, Pagaduan JV, Woolley AT. Ion-permeable membrane for on-chip preconcentration and separation of cancer marker proteins. Electrophoresis. 2011;32 (10):1133–1140. doi: 10.1002/elps.201000698. [DOI] [PMC free article] [PubMed] [Google Scholar]
- 41.Kelly RT, Woolley AT. Thermal Bonding of Polymeric Capillary Electrophoresis Microdevices in Water. Anal Chem. 2003;75 (8):1941–1945. doi: 10.1021/ac0262964. [DOI] [PubMed] [Google Scholar]
- 42.Ren K, Zhou J, Wu H. Materials for Microfluidic Chip Fabrication. Acc Chem Res. 2013;46 (11):2396–2406. doi: 10.1021/ar300314s. [DOI] [PubMed] [Google Scholar]
- 43.Ahn CH, Choi J-W. Microfluidics and their applications to lab-on-a-chip. 2. Springer Handb Nanotechnol; 2007. pp. 523–548. [Google Scholar]
- 44.Le Gac S, Carlier J, Camart J-C, Cren-Olive C, Rolando C. Monoliths for microfluidic devices in proteomics. J Chromatogr B. 2004;808 (1):3–14. doi: 10.1016/j.jchromb.2004.03.067. [DOI] [PubMed] [Google Scholar]
- 45.Pagaduan JV, Yang W, Woolley AT. Optimization of monolithic columns for microfluidic devices. Proc SPIE 8031 (Pt 2, Micro- and Nanotechnology Sensors, Systems, and Applications III) 2011:80311V/80311–80311V/80317. [Google Scholar]
- 46.Ramsey JD, Collins GE. Integrated microfluidic device for solid-phase extraction coupled to micellar electrokinetic chromatography separation. Anal Chem. 2005;77 (20):6664–6670. doi: 10.1021/ac0507789. [DOI] [PubMed] [Google Scholar]
- 47.Svec F. Organic polymer monoliths as stationary phases for capillary HPLC. J Sep Sci. 2004;27 (17–18):1419–1430. doi: 10.1002/jssc.200401825. [DOI] [PubMed] [Google Scholar]
- 48.Ladner Y, Cretier G, Faure K. Electrochromatography in cyclic olefin copolymer microchips: A step towards field portable analysis. J Chromatogr A. 2010;1217 (51):8001–8008. doi: 10.1016/j.chroma.2010.07.076. [DOI] [PubMed] [Google Scholar]
- 49.Augustin V, Jardy A, Gareil P, Hennion M-C. In situ synthesis of monolithic stationary phases for electrochromatographic separations: Study of polymerization conditions. J Chromatogr A. 2006;1119 (1–2):80–87. doi: 10.1016/j.chroma.2006.02.057. [DOI] [PubMed] [Google Scholar]
- 50.Marchiarullo DJ. Dissertation. University of Virginia; 2009. Development of microfluidic technologies for on-site clinical and forensic analysis: extraction, amplification, separation, and detection. [Google Scholar]
- 51.Yang W, Sun X, Wang H-Y, Woolley Adam T. Integrated microfluidic device for serum biomarker quantitation using either standard addition or a calibration curve. Anal Chem. 2009;81 (19):8230–8235. doi: 10.1021/ac901566s. [DOI] [PMC free article] [PubMed] [Google Scholar]


