

Abstract
Molecular imaging allows for the remote, noninvasive sensing and measurement of cellular and molecular processes in living subjects. Drawing upon a variety of modalities, molecular imaging provides a window into the biology of cancer from the subcellular level to the patient undergoing a new, experimental therapy. As signal transduction cascades and protein interaction networks become clarified, an increasing number of relevant targets for cancer therapy—and imaging—become available. Although conventional imaging is already critical to the management of patients with cancer, molecular imaging will provide even more relevant information, such as early detection of changes with therapy, identification of patient-specific cellular and metabolic abnormalities, and the disposition of therapeutic, gene-tagged cells throughout the body—all of which will have a considerable impact on morbidity and mortality. This overview discusses molecular imaging in oncology, providing examples from a variety of modalities, with an emphasis on emerging techniques for translational imaging.
EXISTING ADVANCED IMAGING TECHNIQUES
For the purposes of this discussion, we will distinguish functional from molecular imaging techniques. The former are generally related to the detection of changes in blood flow while the latter concern specific metabolic processes, as defined in detail below. Functional imaging techniques include functional magnetic resonance imaging (fMRI), diffusion MR techniques, perfusion weighted imaging (PWI), and pharmacological MRI (PhMRI). fMRI is commonly used to assess brain activity as a function of oxygenated hemoglobin. Signal changes depend on an influx of deoxyhemoglobin into the field of view, generated upon brain activation, which causes a change in the overall magnetic susceptibility of the blood and consequently a detectable MR signal.1 Diffusion MR techniques include diffusion weighted imaging (DWMRI), apparent diffusion coefficient (ADC) mapping, and diffusion tensor imaging (DTI). DW-MRI is sensitive to interactions between water and its microenvironment at the cellular level and affords detection of minute changes in water mobility. ADC mapping provides a three-dimensional image of water mobility and in turn of tissue density (ie, diffusion contrast).2,3 PWI uses endogenous labels (ie, protons) or exogenous tracer agents (eg, gadolinium chelates) to image arterial blood flow. Finally, PhMRI includes MR techniques applied to the study of the effects that pharmacological agents have on brain processes, by virtue of the effect of the agent on cerebral blood flow.
Numerous examples exist in the literature illustrating the utility of functional imaging modalities. In particular, functional MR-based imaging methods have been applied broadly to various diagnostic applications, including brain, breast, prostate, cervical, liver, lung, and rectal cancers.4 fMRI also has been used in surgical settings. For example, neurosurgical and radiotherapy planning in brain tumor patients benefits from fMRI, increasing surgical precision and decreasing cumulative radiation dose.5,6 Diffusion MR techniques have been used to evaluate several different tumor types, including bone, breast, brain, and liver. In the context of tumor biology, DW-MRI and ADC mapping provide insight into the extracellular milieu, tissue cellularity, and the integrity of cellular membranes. Clinically these techniques have been used to assess the metastatic potential of tumors, as well as therapeutic responses.2,7 PWI, for example, can quantify the degree of tumor angiogenesis and capillary permeability. For gliomas, PWI was used to characterize World Health Organization grade and malignant potential, guide biopsies, and provide prognostic information.8–10 Finally, PhMRI has been employed in preclinical studies and more recently in clinical studies to quantify drug pharmacodynamics and neurotransmitter function within neurocognitive systems. PhMRI continues to be used for studying the molecular etiologies of schizophrenia, depression, attention deficit hyperactivity disorder, Parkinson’s disease, and substance abuse.11
INDICATIONS FOR MOLECULAR IMAGING
Molecular imaging, distinct from advanced functional imaging techniques, is the visualization, characterization, and measurement of biological processes at the molecular and cellular levels in living systems.12 Molecular imaging spans all organ systems and diseases, with the first example in the realm of oncology for imaging thyroid cancer.13 In the late 1970s with the advent of positron emission tomography with 18F-fluorodeoxyglucose (FDG-PET),14,15 quantification of brain activity became possible.16 Currently, most molecular imaging, particularly in the preclinical arena, is performed in the context of imaging cancer, where imaging is being used not merely to stage tumors in patients but to uncover underlying mechanisms related to tumor biology and to identify specific tumor phenotypes—ones that may benefit from specifically targeted therapy.
Three primary indications for clinical molecular imaging are: rapid detection of changes within tissue, as physiology tends to change almost immediately upon pharmacologic or other intervention (relative to anatomic changes, which may take weeks); tailoring medical therapy to match the biology of the patient (“personalized medicine”); and hastening drug development.17 The latter is underscored by the fact that all major drug companies have their own in-house molecular imaging programs, at least preclinical, if not also clinical programs in close, formal collaboration with an academic molecular imaging center.
Detection of changes in tissue that correlate with disease onset and/or progression requires characterizing a molecular imaging agent–target interaction. Some cellular targets for molecular imaging are illustrated in Figure 1. There are many excellent reviews describing the criteria necessary for the development of a suitable molecular imaging agent,18–21 but paramount among these criteria is the ability to generate a high signal-to-noise ratio (S/N). Traditionally, high S/N has been considered dependent on two properties, namely, the affinity of the agent for its cognate target—with respect to surrounding tissue (ie, high specificity)—and the concentration of target within tissue.22 Clever mechanisms to enhance the presence of an imaging agent within a specific target include accumulation within cells by virtue of internalization after binding to a cell surface receptor, derivatization with a chemical moiety that enables trapping of the agent, or activation of a previously invisible agent by specific cellular mechanisms. Targets for rapid detection of tissue changes in cancer are numerous but include the KRAS-activated oncogene,23 cathepsins, caspases, and metalloproteases.24
Figure 1.

Some cellular targets for molecular imaging. Oncologic molecular imaging agents exist for each of these targets. In addition to standard imaging agent binding to extracellular targets in the membrane, eg, G-protein–coupled receptors, some agents localize to various organelles, such as lysosomes, mitochondria or golgi apparatus, based on electrostatic potential or pH. PPI , protein–protein interactions, as detected by split luciferase reporters.
Molecular imaging provides a means to choose appropriate patients for new, targeted therapies, and to decide whether or not to continue certain therapies. That can be done either by directly imaging the target, as by imaging the HER2/neu proto-oncogene in breast cancer evaluating for susceptibility to trastuzumab therapy,25 or indirectly by imaging with FDG, predicting early on whether or not the treatment will work. In a classic example of the latter, the efficacy and dramatic therapeutic response of advanced gastrointestinal stromal tumors to imatinib therapy was evaluated by FDGPET.26 With respect to of HER2/neu-positive breast cancer, estrogen receptor (ER)-negative tumors demonstrate higher FDG uptake than ER-positive tumors. Confirmed by microarray analysis, molecular imaging has provided insight into the biology of these unique breast cancer subsets, illustrating distinct disease-specific, gene expression profiles.27 Direct imaging of HER2/neu expression in breast cancer via single-photon emission computed tomography (SPECT) and PET using monoclonal antibodies radiolabeled with iodine 131, indium 111, and technetium 99m (SPECT) and iodine 124, yttrium 86, bromine 76, and zirconium 89 (PET) has provided a more sensitive means of tumor detection when compared to conventional imaging modalities.28 For example, small animal PET imaging of anti-HER2/neu antibodies (68Ga-F(ab)2-herceptin) in a mouse model of breast cancer was used to analyze the pharmacodynamics and monitor the therapeutic response of the Hsp90 inhibitor, 17-allylamino-17-demethoxygeldanamycin (17-AAG).29
Molecular imaging in drug development has been addressed in multiple recent reviews.30–34 Briefly, uses of molecular imaging in drug development include (1) dose finding by performing receptor occupancy studies, primarily for applications to the central nervous system; (2) determining the pharmacokinetics and metabolism of new drugs under physiological conditions; (3) pharmacodynamic studies, in which effects of drugs on the body are determined, eg, through an FDG-PET study or PhMRI; and (4) therapeutic monitoring. To use molecular imaging in drug development it is often best to have the imaging agent ready at roughly the same time as the therapeutic agent so it can be applied as a surrogate marker of the target and/or be used in dose-finding assays for the phase I study. Theranostic agents, those used for therapy and diagnosis, are also coming online; however, almost all remain experimental.
MOLECULAR IMAGING STRATEGIES
Over the past decade molecular imaging has become a multimodality and transdisciplinary enterprise, incorporating elements from ultrasound, optical imaging, MRI, Raman spectroscopy, PET, computed tomography (CT), and others. Physics, chemistry, and biology all come into play in generating new imaging agents and enabling their detection. Engineering practical, efficient, and high-sensitivity devices is also a critical aspect of the field. Each modality has a unique sensitivity, spatial resolution, depth of penetration, temporal resolution, and cost (Table 1).35 The choice of modality and strategy depends primarily on the biological system being studied and the physiological question being asked.
Table 1.
Characteristics of Imaging Modalities
| Imaging Technique |
EM Spectrum | Sensitivitya | Spatial Resolutionb |
Depth of Penetration |
Temporal Resolutionc | Costd |
|---|---|---|---|---|---|---|
| PET | High-energy γ-ray | 10−11–10−12 mol/L | 1–2 mm | No limit | 10 seconds to minutes | $$$$ |
| SPECT | Low-energy γ-ray | 10−10–10−11 mol/L | 1–2 mm | No limit | Minutes | $$$ |
| BLI | Visible light | 10−15–10−17 mol/L* | 3–5 mm | 1–2 cm | Seconds to minutes | $$ |
| Fluorescence | Visible light or near-infrared | 10−9–10−12 mol/L* | 2–3 mm | < 1 cm | Seconds to minutes | $–$$ |
| MRI | Radiowaves | 10−3–10−5 mol/L | 25–100 μm | No limit | Minutes to hours | $$$$ |
| CT | X-rays | Not well characterized | 50–200 μm | No limit | Minutes | $$ |
| US | High-frequency sound | Not well characterized | 50–500 μm | mm to cm | Seconds to minutes | $$ |
Abbreviations: PET, positron emission tomography; SPECT, single-photon emission computed tomography; BLI, bioluminescence; MRI, magnetic resonance imaging; CT, computed tomography; US, ultrasound.
Not well characterized but likely range is given.
Sensitivity is the ability to detect a molecular probe when it is present, relative to the background, measured in moles per liter.
Spatial resolution is a measure of the accuracy or detail of images expressed in millimeters. It is the minimum distance between two independently measured objects that can be distinguished separately.
Temporal resolution is the frequency at the images can be recorded or captured from the subject once the imaging process is initiated.
This includes cost of equipment and cost per study.
Data from Massoud and Gambhir.35
Rapid and High-Sensitivity Detection In Vivo
Imaging Cellular Metabolism on a Molecular Level
Nuclear and optical imaging modalities are ideal for studying molecular interactions in vivo with sensitivity sufficient to detect submicromolar and lower concentrations of molecular species. As mentioned earlier, FDG-PET is the current modality of choice for real-time analysis of glucose metabolism by various tissues, especially metabolically active tumors. While readily used in the clinical setting, FDG-PET is an inherently nonspecific molecular imaging strategy. In order to provide a specific read-out of in vivo metabolic processes, reporter systems must be developed that recognize a particular molecular target. A classic example of a target-specific strategy is somatostatin receptor imaging (SRI). Gastroenteropancreatic neuroendocrine tumors are often diagnosed and staged by SRI using SPECT imaging and the somatostatin analog 111In-DTPA0-octreotide as a reporter ligand.36,37
While PET and SPECT imaging are nearly as sensitive as the optical techniques, and benefit from much less tissue attenuation making them amenable to quantification, elegant strategies for probing protease activity and protein–protein interactions relevant to cancer have been developed for optical methods. Chief among them are the use of “activatable” molecular probes, or “molecular beacons.”38 The intrinsic properties of these probes change in response to appropriate biological or chemical stimuli, affording visualization only within the desired milieu. Fluorescent protease-activated probes employ various quenching-dequenching strategies with the common objective being to obtain fluorescence only upon activation by a protease. Cathepsin B is a cysteine protease recognizing polylysine peptide sequences and displaying enhanced activity in aggressive tumors. A self-quenching, sterically shielded fluorescent probe (ie, fluorescence is quenched due to fluorophore-quencher intramolecular proximity) with fluorophores linked to a cathepsin B peptide recognition sequence produces a fluorescent signal only upon contact with tumor cells. This signal is a function of cathepsin B activity and in turn has been purported to be an indicator for tumor aggressiveness. Similar strategies have been employed to probe matrix metalloprotease activity, also an indicator of poor prognosis in several types of cancer, including pancreatic and gastric malignancies.39–41 Notably, low-molecular-weight (organic) fluorophores have drawbacks, including photobleaching, low fluorescence signals, and variable sensitivity depending on biological milieu. Protease reporters using quantum dots (reviewed extensively elsewhere)42–44 have been developed to address these limitations and can similarly be conjugated to cleavable peptides.
Regardless of the strategy used, fluorescence imaging requires external excitation. Furthermore, autofluorescence of the sample, especially in an in vivo setting, decreases S/N. Although most activatable probes utilize fluorescence as a reporter signal, bioluminescence (BLI) provides a viable alternative. Using firefly or renilla luciferase proteins, light is generated with enzymatic turnover of the corresponding substrates, luciferin or coelenterazine, respectively. BLI offers improved sensitivity and increased S/N relative to fluorescence imaging. Protease activity and protein–protein interactions have been probed using split-luciferase, protein fragment complementation strategies.45,46 Here the N- and C-terminal domains of luciferase are tethered to a cleavable peptide sequence for protease studies, or to two whole proteins that are being studied for potential protein–protein interactions. Upon protease cleavage or protein–protein binding, respectively, the luciferase domains are reconstituted (ie, protein fragment complementation) and regain activity. These methods hold great promise for imaging an array of interactions within malignant and other cell types to understand in the highly relevant, intact milieu that proteins serve as chaperones, and/or are integral to cell signaling.
In addition to nuclear and optical imaging of cancer metabolism, magnetic resonance spectroscopy (MRS) is an imaging strategy that affords the ability to profile tumor metabolites. In analogy to nuclear magnetic resonance spectroscopy (NMR) used in organic compound structure determination, MRS is a technique that measures endogenous molecules that contain protons, phosphorus, sodium, or other MR-visible species that are of sufficient concentration for detection. MRS provides the detection of compounds or contrast agents administered exogenously that can report on the tumor microenvironment or drug pharmacokinetics. Examples include use of carbon 13–labeled glucose to study tumor metabolism or imaging of cytosine deaminase activity.47 The choline/N-acetylaspartate ratio as measured by MRS in the brain has been used as a prognostic marker distinguishing low- and high-grade disease in various glial cell tumors.48
Transgene Expression in Tissue
Imaging transgene expression in cell culture has become routine in the molecular biology laboratory, but detecting gene expression in vivo presents unique challenges.49 Reporter gene imaging employs optical, MRI, and/or nuclear medicine modalities. There are four types of beetle luciferase BLI reporter genes that differ by wavelength of light emitted, from 546 nm (green) to 593 nm (orange), allowing multiple reporters to be used simultaneously. BLI is limited to animal studies but provides a real-time, highly sensitive measure of transgene expression.50 Although less sensitive than BLI and with poor spatial and temporal resolution relative to MRI, PET reporters of gene expression have the potential for clinical translation and future applications in cancer therapy. Two PET reporter gene strategies that have been explored include an enzyme-based approach [herpes simplex virus-type 1 thymidine kinase (HSV1-TK)] and a receptor-based approach (dopaminergic receptor gene). With respect to the former, which has been utilized in studies ranging from pre-clinical to human gene therapy,51,52 TK phosphorylates nucleoside analogs that are labeled with a positron-emitting isotope. Similar to FDG-PET, phosphorylated nucleosides become trapped within cells (eg, tumors) allowing visualization. With respect to the dopamine 2 receptor (DRD2), the radiolabeled imaging agent, 18F-fluoroethylspiperone (FESP) has been used, but only in animal models.53 Imaging DRD2 gene-tagged cells has not proved as useful as has imaging with HSV1-TK, due to its lack of signal amplification (lower sensitivity) and the high lipophilicity and consequently greater nonspecific binding of FESP and other DRD2 radioligands. However, not all molecular-genetic imaging requires transfection of cells with an artificial reporter. For example, Fu et al demonstrated effective imaging and therapy of virus-associated tumors, by virtue of the presence of the viral TK, which merely needs to be activated by suitable pharmacologic agents.54 Transgene receptor expression affords interaction with MRI contrast agents. For example, the gene encoding transferrin receptor has been employed as a transgene with superparamagnetic iron oxide (SPIO) particles as imaging probes.55 A more recent approach to MR-based reporter gene imaging involves gene tagging with a lysine-rich reporter protein (LRP), which can be detected using saturation transfer techniques, promising to increase the sensitivity of such MR-based reporters (Figure 2).56 Further examples of imaging transgene expression are detailed below.
Figure 2.
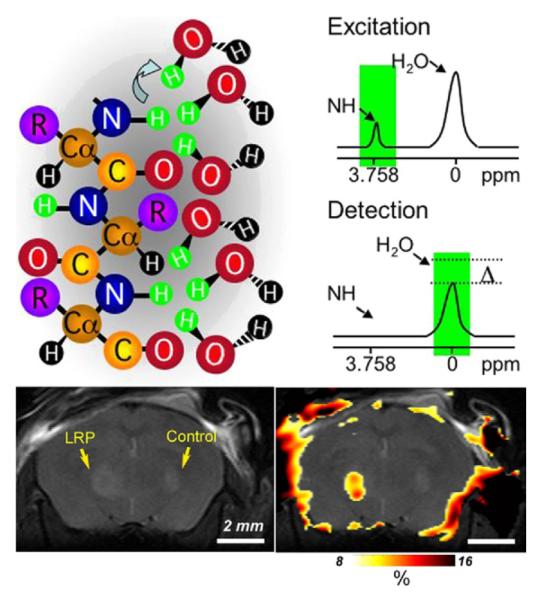
Lysine-rich protein (LRP) as an MR-CEST reporter. (Top) Illustration of the chemical exchange saturation transfer (CEST) contrast mechanism. A frequency-selective radiofrequency pulse is used to label (green) the amide protons of the contrast agent. Only labeled protons exchange with water protons. This leads to a reduction in MR signal intensity. (Bottom) CEST difference map (right) overlaid on an anatomical MR image (left). This map demonstrates that LRP-expressing xenografts can be distinguished from mock-transfected controls. Reprinted with permission from Macmillan Publishers Ltd: Nature Biotechnology,56 copyright 2007.
Imaging Cell Trafficking
Regardless of the type of cell, imaging modalities used for tracking cells in vivo include PET, MRI, BLI, and fluorescence imaging with quantum dots. Again, the choice of imaging modality depends on the scientific question and biological system being studied. Limitations are modality-specific, as described earlier. PET imaging is generally limited by isotope half-life, making longitudinal imaging of cell migration challenging. In addition, techniques using radioactive isotopes or ionizing radiation are constrained by human exposure limits. However, MRI of SPIO-labeled cells does not ensure that the cells being imaged are viable. Fluorescence imaging with near-infrared (NIR)-emitting proteins or luciferase expression is limited by depth of penetration—and involves exogenous administration of substrate in the case of BLI—restricting optical imaging to animal studies except in imaging the most superficial structures.57,58 Tracking gene-tagged immune cells is one of the most promising indications for translational molecular imaging. In this instance the choice of imaging modality will depend on the desired follow-up interval, radiation tolerance, availability of imaging technologies, and sensitivity. PET and MRI used concurrently provide desirable characteristics for clinical translation, including high sensitivity (PET) and high resolution (MRI), and they draw upon established imaging protocols for cancer patients.59,60 An illustrative example uses MRI and PET to detect noninvasively cytolytic T-cell immunotherapy in a patient with glioma (Figure 3).61
Figure 3.
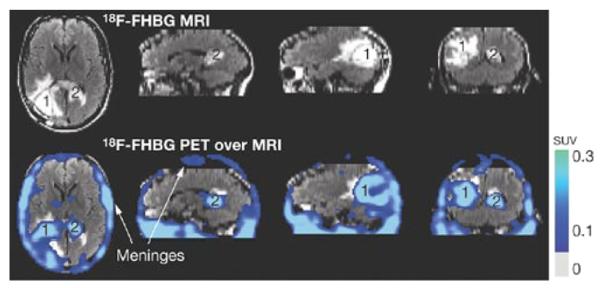
Case study: noninvasive detection of cytolytic T cells in a patient with glioma. MRI (top) and PET over MRI superimposed (bottom) brain images of a patient who received autologous cyolytic T-cell infusions. T cells expressed HSV1-TK and images were acquired after 18F-FHBG injection. Cells localized to tumor 1 and trafficked to tumor 2. Reprinted with permission from Macmillan Publishers Ltd: Nature Clin Pract Oncol,61 copyright 2007.
Drug Development
Biomarker Assessment
The US Food and Drug Administration (FDA) defines a biomarker as “a characteristic that can be measured objectively and that constitutes an indicator of normal biological processes, pathogenic processes, or pharmacological response to a therapeutic intervention.”30,62 A biomarker is intended to substitute for a clinical endpoint, a characteristic that reflects how a patient feels, functions, or survives. In biomarker identification and development, one must be able to measure drug delivery to an intended target, predict pathophysiology, and also predict how the pathophysiological processes are altered by a therapeutic intervention. In other words, biomarkers should indicate that the drug-target interaction (ie, therapeutic intervention) alters the pathophysiological mechanism of disease and in turn alters clinical endpoints.30
Molecular imaging is useful for target identification, as well as providing an in vivo measure of drug-target interactions either directly or indirectly. The classic example of imatinib described above demonstrated that FDG-PET, a measure of tumor metabolism, provided a biomarker of tumor cell kill.26 In fact, structural imaging took months to demonstrate a reduction in tumor volume following imatinib therapy, whereas reduction of glucose metabolism by 50% was ascertained via PET signal attenuation in 4 hours post-treatment. This validated FDG-PET imaging as a measure of therapeutic response to imatinib therapy.26
Molecular Imaging of Pharmacokinetics and Pharmacodynamics
Analysis of pharmacokinetics (PK), what the body does to the drug, and pharmacodynamics (PD), what the drug does to the body, is essential to the drug development process. CT, ultrasound, MR, and PET are the imaging modalities most widely used for analyzing PD and PK. CT provides soft-tissue contrast and three-dimensional information. In PD analysis, CT with and without x-ray dense contrast is valuable for measuring tumor volume changes, tumor perfusion changes, lymph node size and appearance, and for assessing the extent of metastatic disease after administration of therapy. Ultrasound affords real-time visualization of tumors, easily differentiating solid and cystic structures, as well as providing a highly sensitive measure of blood flow. Therapeutic trials use ultrasound with micro-bubble contrast agents to assess further tissue perfusion as a function of antiangiogenic agents. Ultrasound, however, is limited by operator technique that adds considerable variability to PD analysis. MRI and, more recently, MRS have been applied to cancer drug trials. Compared to CT, MRI has a more useful combination of temporal and spatial resolution and therefore affords more sensitive PD endpoint analysis. MRS is used in PD studies to measure metabolite concentration in response to therapy (eg, inorganic phosphates, adenosine triphosphate [ATP], phosphocholine), especially in animal models (eg, phosphorus-31 MRS studies of non-Hodgkin lymphoma and breast cancer). Spectroscopy with 19F and 31P has also been used to analyze the PK of the anticancer agents 5-fluorouracil (5-FU) and cyclophosphamide, respectively. For example, the efficacy of 5-FU (ie, tumor response to therapy) is inversely proportional to the 5-FU elimination rate. Relative to other modalities like PET, PK and PD studies using MRS afford the ability to distinguish metabolites that give rise to distinct signals, therefore providing a broad spectrum analysis of tumor metabolism. In the context of cancer drug development, MRS affords more extensive PK modeling at the preclinical stage in which routes of excretion can be identified and clinical protocols can be designed based on a more precise PK profile for the drug candidate. MRS, however, is comparatively less sensitive, requiring relatively high drug concentrations for analysis. Sensitivity is less of a concern when measuring metabolites in the millimolar range, such as ATP and lactate.63,64
PET methods are gaining traction for PK and PD studies because of their relatively high sensitivity, specificity, and reasonable temporal resolution. PET can be used to assess drug distribution to the target (tumor) versus normal tissue, drug elimination kinetics, drug-target occupancy, and drug efficacy. Such studies using PET include imaging glucose utilization, PK of labeled drugs ([18F]5-FU),65 cell proliferation ([11C]thymidine),66 tissue pH ([11C]bicarbonate),67 blood flow ([15O]H2O/[15O]CO),68 protein synthesis ([11C]methionine),69 and several other applications. However, PET imaging is subject to synthetic limitations, in that not every compound or metabolite can be synthesized with a radioisotope.64,70
Personalized Medicine
“Personalized medicine” is most often discussed relative to using a patient’s genotype to determine the optimum therapy for them. Therapeutics are designed based on genotype (and the ensuing phenotype), seeking to determine which subset of patients should be treated with a particular drug, for example. After treatment is initiated, therapeutic monitoring is useful for assessing drug efficacy. Molecular imaging has potential in both settings.71 With respect to the former, imaging the HER2/neu proto-oncogene affords a “personalized” approach to breast cancer therapy28,72 (ie, predicting the efficacy of trastuzumab). With respect to the latter, as described above, the efficacy of imatinib therapy has been assessed with molecular imaging in real time.26 The specific choice of imaging modality will depend on the biomarker(s) developed and the clinical questions being asked.
EXAMPLES OF TRANSLATIONAL MOLECULAR IMAGING IN ONCOLOGY
Because of the tracer principle, ie, the administration of merely tracer rather than larger, potentially pharmacologic doses of agent, much of translational molecular imaging currently employs radionuclide-based techniques, as evidenced by the following discussion. A notable counterexample, however, is the use of signal enhancement strategies that derive from MR saturation transfer techniques, as recently described by Zhou et al.73
Prostate Cancer
Molecular imaging has been applied to the diagnosis, treatment, and therapeutic monitoring of prostate cancer.74 Prostate-specific membrane antigen (PSMA) is a transmembrane glycoprotein expressed at virtually all stages of prostate cancer and is upregulated in poorly differentiated, metastatic, androgen-insensitive prostate cancer.75,76 One study showed that patients with PSMA expression in their tumors had a longer time to prostate-specific antigen (PSA) recurrence than those who did not.77 PSMA is well suited for targeted therapy and imaging. Towards this end, anti-PSMA antibodies have been designed and functionalized for imaging, the first being 7E11. Unfortunately, 7E11 recognized an intracellular component of PSMA, allowing the antibody to recognize only necrotic tissue. Therefore, since the introduction of ProstaScint (another anti-PSMA monoclonal antibody; EUSA Pharma, Inc, Langhorne, PA) in 1996, 7E11 has dropped off in use for radioimmunoimaging, and has not proved useful for radioimmunotherapy.78 In contrast, antibody J591 recognizes an epitope on the extracellular domain of PMSA and has shown imaging and therapeutic efficacy when coupled with radionuclides.79 Pandit-Taskar et al demonstrated that 111In-J591 administration was able to localize greater than 90% of known lesions detected by conventional imaging.80 In a phase II clinical trial, Tagawa et al showed that lutetium 177–J591 provided significant antitumor activity in patients with metastatic prostate cancer.81 Other anti-PSMA antibodies are currently under development and have shown promise when labeled with copper 64.82 Despite the high specificity of antibody-based agents, they tend to suffer from prolonged retention within the blood pool and may not penetrate solid tumors well. Accordingly, a wide variety of low-molecular-weight agents for PSMA have been developed for imaging, with one example of those in the urea class having recently completed a phase I trial.83–88 Another example of a promising low-molecular-weight imaging agent for prostate cancer includes anti-1-amino-3-18F-fluorocyclobutane-1-carboxylic acid (anti-[18F]FACBC), a synthetic L-leucine analog, which has shown significant uptake by prostate carcinoma cell lines as well as within an orthotopic prostate cancer nude rat model.89 In humans, anti-[18F]FACBC PET/CT was able to identify neoplastic foci and holds promise for future diagnostic imaging of prostate cancer both pre- and post-treatment90,91 (Figure 4). Another low-molecular-weight agent, 18F-16β-fluoro-5α-dihydrotestosterone ([18F]FDHT), has been used to assess androgen receptor (AR) levels in prostate cancer.92 Without molecular PET imaging, AR levels could only be assessed by direct biopsy of the metastatic lesion, which is usually not available in patients with prostate cancer. However, in order to reach its full clinical utility, [18F]FDHT will require further study and optimization in different clinical scenarios.93
Figure 4.
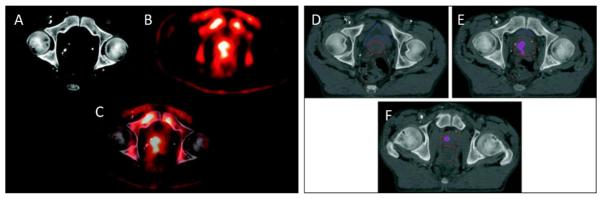
Case study: anti-[18F] FACBC to guide prostate cancer radiotherapy target design. A CT image (A), an FACBC PET image (B), and a registered image (C) demonstrates how FACBC PET scan information was registered with the planning CT scan. The projection of FACBC-defined gross tumor volume (GTVFACBC) into the treatment planning CT at three different levels (D–F). GTVFACBC was mostly contained within the prostate. Reprinted with permission from Jani et al. Clin Nucl Med. 2009.91
Gene Therapy
Molecular-genetic imaging has been reviewed previously.49,94,95 Gene therapy is an emerging clinical application for molecular imaging technologies. Specifically, HSV1-sr39tk has been used as a reporter gene to assess the efficacy of gene delivery to a cancer target as well as a means to target chemotherapy.96,97 With respect to the former, HSV1-sr39tk is delivered to the relevant tissue and reporter gene expression is evaluated using the PET reporter 9-(4-[18F]fluoro-3-(hydroxymethyl) butyl)guanine ([18F]FHBG).98 This technology was applied to the treatment of grade IV glioblastoma multiforme (GBM).52 Figure 3 similarly shows use of [F]FHBG, but for tracking gene-tagged cytolytic T cells.61 With respect to targeted chemotherapy, tissues expressing HSV1-sr39tk are primed for ganciclovir treatment (ie, the drug is trapped via phosphorylation resulting in an enhanced, localized therapeutic effect).96 The sodium-iodide symporter (NIS) is another common reporter that has been used in gene therapy studies. Human NIS substrates include those for PET (124I) and SPECT (123I, 99mTcO4−), and have the advantage of requiring no additional radiochemical synthesis beyond obtaining the isotope.99 Although NIS is mainly used as an imaging reporter, it also has been used in combination with suicide genes such as HSV1-sr39tk and cytosine deaminase. A phase I clinical trial of prostate cancer patients assessing safety and feasibility of an adenovirus NIS/HSV vector encouraging for future clinical translation of these techniques.100
Multimodality reporter systems are useful in translational cancer research in that their use affords correlation of histology with imaging data obtained in vivo. For example, bi- or tri-fusion coding elements within a reporter gene system can include luciferase and HSV1-TK, or luciferase, HSV1-TK, and fluorescent proteins, respectively. In regard to the latter, in vitro cellular expression can be monitored with a fluorescent reporter, optical imaging (eg, BLI) affords real-time in vivo imaging in animal models, and PET allows for more quantitative imaging and the potential for clinical translation.101 This multimodality approach offers the flexibility to use the imaging modality best suited to the application while using a single reporter gene construct.
Molecular imaging also has been applied to the development of tumor vaccines and subsequent assessment of vaccine efficacy. Long et al developed methodology to label tumor cells with SPIO agents, deliver the irradiated tumor cell vaccine via subcutaneous injection, and subsequently monitor peripheral dendritic cell trafficking to lymph nodes. MRI quantification of dendritic cell concentration within the T-cell zone of lymph nodes could then be used as a measure of tumor vaccine efficacy.102
EMERGING TECHNIQUES
Instructive examples again come from the search for imaging agents for prostate cancer, which remains a challenge with respect to screening and therapeutic monitoring. PSA is commonly used for prostate cancer screening purposes and monitoring recurrence of disease. Unfortunately, PSA is neither sensitive nor specific for prostate cancer detection,103 illustrating a need for novel biomarkers. One possible alternative is hepsin (HPN), a type II transmembrane serine protease that is virtually absent in normal prostate but with upregulated expression in the precursor lesion of prostate cancer, high-grade prostate intraepithelial neoplasia (HG-PIN), and hormone-refractory tumors. An iterative phage display approach104 was employed in an effort to identify selective, high-affinity peptides that recognize HPN. Peptides were successfully identified and conjugated to fluorescent nanoparticles for imaging applications. The binding affinity of these agents was further enhanced through application of multivalency. Results using these peptide-nanoparticle conjugates are promising in mouse models, and could be used to delineate prostate cancer at many stages.105
In addition to applications in staging, therapeutic monitoring, drug development, etc, discussed above, molecular imaging has the potential to provide real-time image guidance during surgical resection of tumors. Wide-field, planar, NIR fluorescence imaging coupled with color video is particularly suited to this application, although clinical translation will require optimization of imaging systems and NIR fluorescent contrast agents. The only clinically available NIR fluorophore is indocyanine green (ICG), which when mixed with human serum albumin forms a highly fluorescent complex. This complex may be used for sentinel lymph node mapping in a variety of cancers.106–109 In addition to lymph node mapping, certain tumors (eg, hepatocellular carcinoma, insulinomas) display preferential uptake of ICG, thus defining tumor borders with enhanced precision.110,111 Several groups have developed NIR fluorophores with molecular specificity to particular human cancers by varying NIR probe, linker composition (lipophilic, hydrophilic, ionic, nonionic), and targeting unit (ligand, substrate, cell). For example, a mouse model of peritoneal carcinomatosis illustrated the specificity and efficacy of a peptide–fluorophore conjugate that recognizes the transmembrane integrin αVβ3. This integrin is overexpressed on brain, lung, melanoma, and breast cancer cell lines.112,113
As described earlier, real-time in vitro characterization of protein–protein interactions has potential for hastening cancer drug development, but BLI strategies (eg, luciferase split-reporter system) are not amenable to clinical translation. Fortunately, a molecularly engineered split reporter of TK has been developed that allows protein–protein interactions to be probed with PET imaging, a modality and strategy that may find its way to the clinic once the appropriate trial has been designed.114
CHALLENGES IN MOLECULAR IMAGING: CLINICAL TRANSLATION
Drug development and proof-of-concept testing in clinical oncology will continue to benefit from molecular imaging. When imaging modalities are chosen appropriately, molecular imaging is more efficient with respect to both time and resources when compared to current practices such as tissue dissection and histological analysis.34 Unfortunately, barriers exist for the implementation of molecular imaging biomarkers as endpoints in clinical trials. These include (1) constraints on the availability of truly useful imaging biomarkers, including low molecular weight agents that mimic drugs; and (2) the lengthy approval process for clinical use of new agents, ie, those that do not directly replicate—with precise isotopic substitution—a drug that has already appeared in the Physicians’ Desk Reference.
With respect to the supply of new molecular imaging agents, what is immediately apparent is that there are hundreds if not thousands of such chemical entities already available. However, the question remains which are truly useful? This can only be determined in vivo in a relevant clinical setting; however, for any agent to attain that position, it must pass FDA approval, which requires expensive toxicity evaluation and synthesis according to current Good Manufacturing Practice (cGMP). The dilemma is that most academic programs—from which most new agents derive—cannot afford such testing, so an interested industrial partner or foundation must often assume the cost. Unfortunately, industry has little financial incentive as the development of therapeutics has a much higher profit margin, and consumes most of the company’s resources.115 That said, molecular imaging biomarkers can help increase the odds of successful and relatively cost-effective transition of a drug candidate through the development process.116 Furthermore, unlike therapeutic agents, diagnostic imaging agents can delineate nonfunctional targets that serve only as disease markers, which can still be extremely useful, rather than functional targets that modify disease processes.
The FDA currently evaluates therapeutic and imaging agents through the same process. However, in 2006, the FDA changed the traditional Investigative New Drug (IND) application to the exploratory IND for therapeutics and diagnostics117 requiring less animal toxicity and safety data, thus decreasing the financial and time costs for compounds that would ultimately fail. The FDA has provided broad indications for imaging agents, including (1) structural delineation; (2) detection or assessment of disease; (3) functional, physiological, or biochemical assessment; and (4) diagnostic or patient management. For development of imaging agents for functional assessment of disease processes, the FDA requires evidence of direct patient benefit (ie, linking patient outcome to imaging information).18 Negotiating regulatory hurdles can best be illustrated by the example of FDG. FDG was the pioneering molecular imaging agent since the 1970s and has been used for many years since then for a variety of indications, including for clinical management, but only recently has it become one of the mainstays of cancer management. 2-Deoxy-glucose (DG) was initially developed to inhibit glucose utilization by cancer cells and was subsequently modified to FDG for mapping glucose metabolism in the brain.14 Although several studies demonstrated the tumor targeting properties of FDG, widespread clinical use did not occur for almost 30 years. Optimization of FDG synthesis according to cGMP took almost a decade. With increasing clinical demand, regulatory rules and establishing guidelines for reimbursement through the Center for Medicare and Medicaid Services (CMS), as well as private insurance companies, became formidable barriers. The pharmaceutical industry was ultimately motivated to support a clinical trial for approval by the FDA. Even with the data supporting safe and efficacious clinical translation, the FDA approval process made production and access to FDG-PET imaging cumbersome at best. Final FDA approval required an act of Congress, the FDA Modernization and Accountability Act of 1997, forcing the FDA to address logistical hurdles.118
A second example involves the use of [18F]-(3′-deoxy)-3′-fluorothymidine (FLT), which was developed in the 1990’s. FLT is transported into the cell via a mechanism analogous to thymidine and is subsequently phosphorylated by TK-1. Similar to FDG phosphate, FLT phosphates are trapped within the cells and are relatively resistant to degradation. Preclinical studies using FLT PET for therapeutic monitoring demonstrated that cell proliferation could be defined as a function of chemotherapeutic dose.119 Although imaging agents like FLT would be invaluable in support of novel drug development, lack of standardization of techniques has made these strategies difficult to implement in the United States. In response to this hurdle, the Society of Nuclear Medicine created the Molecular Imaging Clinical Trials Network (SNM CTN). SNM CTN sought to provide a centralized IND process, allowing industries to cross-reference the centralized IND for large multicenter trials. Establishment of standardized imaging guidelines for other radiotracers and molecular imaging agents remains a formidable hurdle despite the SNM CTN effort.120
PERSPECTIVE
Because molecular imaging has been performed extensively in the service of cancer research, new discoveries in and applications of molecular imaging research have been developing in parallel with discoveries emanating from the cell biology laboratory. Previous examples include how in vivo molecular-genetic imaging has derived from cell-based imaging using reporters such as green fluorescent protein (GFP) and firefly luciferase. Modern activatable probes find their antecedents in molecular beacons, first described in the mid 1990s. More recently, systemic delivery of tissue- and tumor-specific promoters driving imaging reporter genes can be used to provide selective targeting of widespread metastases—for detection as well as theranostic purposes. Now we are beginning to see molecular imaging applied to visualize siRNA delivery and the disposition of nanomedicines. Because drug delivery, whether with one of these new macromolecular, biological, gene-based, or nanocarrier-based techniques, or with traditional, low-molecular-weight agents, is becoming increasingly recognized as a major impediment to effective cancer therapy, imaging the results of this delivery becomes an increasingly pressing, unmet medical need. By forging stronger ties with industry, working closer with the FDA to overcome logistical hurdles and continually proving in the laboratory the utility of molecular imaging for informing basic biology it will not be long before we begin to see the ultimate benefit of applications of molecular imaging research: decreased morbidity and mortality from cancer.
Footnotes
Russell H. Morgan Department of Radiology and Radiological Science, Johns Hopkins University School of Medicine, Baltimore, MD.
Financial disclosures: none.
REFERENCES
- 1.Ogawa S, Lee TM, Kay AR, Tank DW. Brain magnetic resonance imaging with contrast dependent on blood oxygenation. Proc Natl Acad Sci U S A. 1990;87:9868–72. doi: 10.1073/pnas.87.24.9868. [DOI] [PMC free article] [PubMed] [Google Scholar]
- 2.Patterson DM, Padhani AR, Collins DJ. Technology insight: water diffusion MRI—a potential new biomarker of response to cancer therapy. Nat Clin Pract Oncol. 2008;5:220–33. doi: 10.1038/ncponc1073. [DOI] [PubMed] [Google Scholar]
- 3.Lee KC, Bradley DA, Hussain M, et al. A feasibility study evaluating the functional diffusion map as a predictive imaging biomarker for detection of treatment response in a patient with metastatic prostate cancer to the bone. Neoplasia. 2007;9:1003–11. doi: 10.1593/neo.07954. [DOI] [PMC free article] [PubMed] [Google Scholar]
- 4.Kwee TC, Takahara T, Klomp DW, Luijten PR. Cancer imaging: novel concepts in clinical magnetic resonance imaging. J Intern Med. 2010;268:120–32. doi: 10.1111/j.1365-2796.2010.02243.x. [DOI] [PubMed] [Google Scholar]
- 5.Kovacs A, Toth L, Glavak C, et al. Integrating functional MRI information into radiotherapy planning of CNS tumors—early experiences. Pathol Oncol Res. doi: 10.1007/s12253-010-9298-y. Epub ahead of print 2010 September 17. [DOI] [PubMed] [Google Scholar]
- 6.Ng WH, Mukhida K, Rutka JT. Image guidance and neuromonitoring in neurosurgery. Childs Nerv Syst. 2010;26:491–502. doi: 10.1007/s00381-010-1083-4. [DOI] [PubMed] [Google Scholar]
- 7.Moffat BA, Chenevert TL, Lawrence TS, et al. Functional diffusion map: a noninvasive MRI biomarker for early stratification of clinical brain tumor response. Proc Natl Acad Sci U S A. 2005;102:5524–9. doi: 10.1073/pnas.0501532102. [DOI] [PMC free article] [PubMed] [Google Scholar]
- 8.Mechtler L. Neuroimaging in neuro-oncology. Neurol Clin. 2009;27:171–201. doi: 10.1016/j.ncl.2008.09.015. [DOI] [PubMed] [Google Scholar]
- 9.Hamstra DA, Chenevert TL, Moffat BA, et al. Evaluation of the functional diffusion map as an early biomarker of time-to-progression and overall survival in high-grade glioma. Proc Natl Acad Sci U S A. 2005;102:16759–64. doi: 10.1073/pnas.0508347102. [DOI] [PMC free article] [PubMed] [Google Scholar]
- 10.Sawlani RN, Raizer J, Horowitz SW, et al. Glioblastoma: a method for predicting response to antiangiogenic chemotherapy by using MR perfusion imaging—pilot study. Radiology. 2010;255:622–8. doi: 10.1148/radiol.10091341. [DOI] [PMC free article] [PubMed] [Google Scholar]
- 11.Honey G, Bullmore E. Human pharmacological MRI. Trends Pharmacol Sci. 2004;25:366–74. doi: 10.1016/j.tips.2004.05.009. [DOI] [PubMed] [Google Scholar]
- 12.Mankoff DA. A definition of molecular imaging. J Nucl Med. 2007;48:18N–21N. [PubMed] [Google Scholar]
- 13.Johns MW, Gregson JH, Foster GC, Jaimet CH, Thode HG. Radioiodine 131 in the diagnosis of thyroid function. Can Med Assoc J. 1953;68:132–7. [PMC free article] [PubMed] [Google Scholar]
- 14.Sokoloff L. The deoxyglucose method: theory and practice. Eur Neurol. 1981;20:137–45. [PubMed] [Google Scholar]
- 15.Hoffman EJ, Phelps ME, Wisenberg G, Schelbert HR, Kuhl DE. Electrocardiographic gating in positron emission computed tomography. J Comput Assist Tomogr. 1979;3:733–9. [PubMed] [Google Scholar]
- 16.Phelps ME, Mazziotta JC, Huang SC. Study of cerebral function with positron computed tomography. J Cereb Blood Flow Metab. 1982;2:113–62. doi: 10.1038/jcbfm.1982.14. [DOI] [PubMed] [Google Scholar]
- 17.Weissleder R. Molecular imaging in cancer. Science. 2006;312:1168–71. doi: 10.1126/science.1125949. [DOI] [PubMed] [Google Scholar]
- 18.Agdeppa ED, Spilker ME. A review of imaging agent development. AAPS J. 2009;11:286–99. doi: 10.1208/s12248-009-9104-5. [DOI] [PMC free article] [PubMed] [Google Scholar]
- 19.Anderson CJ, Bulte JW, Chen K, et al. Design of targeted cardiovascular molecular imaging probes. J Nucl Med. 2010;51(Suppl 1):3S–17S. doi: 10.2967/jnumed.109.068130. [DOI] [PMC free article] [PubMed] [Google Scholar]
- 20.Boswell CA, Brechbiel MW. Development of radioimmunotherapeutic and diagnostic antibodies: an inside-out view. Nucl Med Biol. 2007;34:757–78. doi: 10.1016/j.nucmedbio.2007.04.001. [DOI] [PMC free article] [PubMed] [Google Scholar]
- 21.Eberle AN, Mild G. Receptor-mediated tumor targeting with radiopeptides. Part 1. General principles and methods. J Recept Signal Transduct Res. 2009;29:1–37. doi: 10.1080/10799890902732823. [DOI] [PubMed] [Google Scholar]
- 22.Eckelman WC, Reba RC, Gibson RE, et al. Receptor-binding radiotracers: a class of potential radiopharmaceuticals. J Nucl Med. 1979;20:350–7. [PubMed] [Google Scholar]
- 23.Chakrabarti A, Zhang K, Aruva MR, et al. Radiohybridization PET imaging of KRAS G12D mRNA expression in human pancreas cancer xenografts with [(64) Cu]DO3A-peptide nucleic acid-peptide nanoparticles. Cancer Biol Ther. 2007;6:948–56. doi: 10.4161/cbt.6.6.4191. [DOI] [PubMed] [Google Scholar]
- 24.Garcia Boy R, Knapp EM, Eisenhut M, Haberkorn U, Mier W. Enzymes/transporters. Handb Exp Pharmacol. 2008;185:131–43. doi: 10.1007/978-3-540-77496-9_6. [DOI] [PubMed] [Google Scholar]
- 25.Capala J, Bouchelouche K. Molecular imaging of HER2-positive breast cancer: a step toward an individualized ‘image and treat’ strategy. Curr Opin Oncol. 2010;22:559–66. doi: 10.1097/CCO.0b013e32833f8c3a. [DOI] [PMC free article] [PubMed] [Google Scholar]
- 26.Demetri GD, von Mehren M, Blanke CD, et al. Efficacy and safety of imatinib mesylate in advanced gastrointestinal stromal tumors. N Engl J Med. 2002;347:472–80. doi: 10.1056/NEJMoa020461. [DOI] [PubMed] [Google Scholar]
- 27.Osborne JR, Port E, Gonen M, et al. 18F-FDG PET of locally invasive breast cancer and association of estrogen receptor status with standardized uptake value: microarray and immunohistochemical analysis. J Nucl Med. 2010;51:543–50. doi: 10.2967/jnumed.108.060459. [DOI] [PMC free article] [PubMed] [Google Scholar]
- 28.Oude Munnink TH, Nagengast WB, Brouwers AH, et al. Molecular imaging of breast cancer. Breast. 2009;18(Suppl 3):S66–73. doi: 10.1016/S0960-9776(09)70276-0. [DOI] [PubMed] [Google Scholar]
- 29.Smith-Jones PM, Solit DB, Akhurst T, Afroze F, Rosen N, Larson SM. Imaging the pharmacodynamics of HER2 degradation in response to Hsp90 inhibitors. Nat Biotechnol. 2004;22:701–6. doi: 10.1038/nbt968. [DOI] [PubMed] [Google Scholar]
- 30.Frank R, Hargreaves R. Clinical biomarkers in drug discovery and development. Nat Rev Drug Discov. 2003;2:566–80. doi: 10.1038/nrd1130. [DOI] [PubMed] [Google Scholar]
- 31.Rudin M, Weissleder R. Molecular imaging in drug discovery and development. Nat Rev Drug Discov. 2003;2:123–31. doi: 10.1038/nrd1007. [DOI] [PubMed] [Google Scholar]
- 32.Rudin M. Noninvasive structural, functional, and molecular imaging in drug development. Curr Opin Chem Biol. 2009;13:360–71. doi: 10.1016/j.cbpa.2009.03.025. [DOI] [PubMed] [Google Scholar]
- 33.Pomper MG, Lee JS. Small animal imaging in drug development. Curr Pharm Des. 2005;11:3247–72. doi: 10.2174/138161205774424681. [DOI] [PubMed] [Google Scholar]
- 34.Rudin M, Rausch M, Stoeckli M. Molecular imaging in drug discovery and development: potential and limitations of nonnuclear methods. Mol Imaging Biol. 2005;7:5–13. doi: 10.1007/s11307-004-0954-z. [DOI] [PubMed] [Google Scholar]
- 35.Massoud TF, Gambhir SS. Molecular imaging in living subjects: seeing fundamental biological processes in a new light. Genes Dev. 2003;17:545–80. doi: 10.1101/gad.1047403. [DOI] [PubMed] [Google Scholar]
- 36.Kwekkeboom DJ, Kam BL, van Essen M, et al. Somatostatin-receptor-based imaging and therapy of gastroenteropancreatic neuroendocrine tumors. Endocr Relat Cancer. 2010;17:R53–73. doi: 10.1677/ERC-09-0078. [DOI] [PubMed] [Google Scholar]
- 37.Edwards WB, Xu B, Akers W, et al. Agonist-antagonist dilemma in molecular imaging: evaluation of a monomolecular multimodal imaging agent for the somatostatin receptor. Bioconjug Chem. 2008;19:192–200. doi: 10.1021/bc700291m. [DOI] [PMC free article] [PubMed] [Google Scholar]
- 38.Elias DR, Thorek DL, Chen AK, Czupryna J, Tsourkas A. In vivo imaging of cancer biomarkers using activatable molecular probes. Cancer Biomark. 2008;4:287–305. doi: 10.3233/cbm-2008-4602. [DOI] [PubMed] [Google Scholar]
- 39.Nomura H, Sato H, Seiki M, Mai M, Okada Y. Expression of membrane-type matrix metalloproteinase in human gastric carcinomas. Cancer Res. 1995;55:3263–6. [PubMed] [Google Scholar]
- 40.Wu ZY, Li JH, Zhan WH, He YL. Lymph node micrometastasis and its correlation with MMP-2 expression in gastric carcinoma. World J Gastroenterol. 2006;12:2941–4. doi: 10.3748/wjg.v12.i18.2941. [DOI] [PMC free article] [PubMed] [Google Scholar]
- 41.Koshiba T, Hosotani R, Wada M, et al. Involvement of matrix metalloproteinase-2 activity in invasion and metastasis of pancreatic carcinoma. Cancer. 1998;82:642–50. doi: 10.1002/(sici)1097-0142(19980215)82:4<642::aid-cncr5>3.0.co;2-n. [DOI] [PubMed] [Google Scholar]
- 42.Zhou M, Ghosh I. Quantum dots and peptides: a bright future together. Biopolymers. 2007;88:325–39. doi: 10.1002/bip.20655. [DOI] [PubMed] [Google Scholar]
- 43.Frangioni JV. In vivo near-infrared fluorescence imaging. Curr Opin Chem Biol. 2003;7:626–34. doi: 10.1016/j.cbpa.2003.08.007. [DOI] [PubMed] [Google Scholar]
- 44.Algar WR, Tavares AJ, Krull UJ. Beyond labels: a review of the application of quantum dots as integrated components of assays, bioprobes, and biosensors utilizing optical transduction. Anal Chim Acta. 2010;673:1–25. doi: 10.1016/j.aca.2010.05.026. [DOI] [PubMed] [Google Scholar]
- 45.Paulmurugan R, Gambhir SS. Monitoring protein-protein interactions using split synthetic renilla luciferase protein-fragment-assisted complementation. Anal Chem. 2003;75:1584–9. doi: 10.1021/ac020731c. [DOI] [PMC free article] [PubMed] [Google Scholar]
- 46.Paulmurugan R, Umezawa Y, Gambhir SS. Noninvasive imaging of protein-protein interactions in living subjects by using reporter protein complementation and reconstitution strategies. Proc Natl Acad Sci U S A. 2002;99:15608–13. doi: 10.1073/pnas.242594299. [DOI] [PMC free article] [PubMed] [Google Scholar]
- 47.Vande Velde G, Baekelandt V, Dresselaers T, Himmel-reich U. Magnetic resonance imaging and spectroscopy methods for molecular imaging. Q J Nucl Med Mol Imaging. 2009;53:565–85. [PubMed] [Google Scholar]
- 48.Rodriguez I, Perez-Rial S, Gonzalez-Jimenez J, et al. Magnetic resonance methods and applications in pharmaceutical research. J Pharm Sci. 2008;97:3637–65. doi: 10.1002/jps.21281. [DOI] [PubMed] [Google Scholar]
- 49.Blasberg RG, Tjuvajev JG. Molecular-genetic imaging: current and future perspectives. J Clin Invest. 2003;111:1620–9. doi: 10.1172/JCI18855. [DOI] [PMC free article] [PubMed] [Google Scholar]
- 50.Contag CH, Bachmann MH. Advances in in vivo bioluminescence imaging of gene expression. Annu Rev Biomed Eng. 2002;4:235–60. doi: 10.1146/annurev.bioeng.4.111901.093336. [DOI] [PubMed] [Google Scholar]
- 51.Jacobs A, Tjuvajev JG, Dubrovin M, et al. Positron emission tomography-based imaging of transgene expression mediated by replication-conditional, oncolytic herpes simplex virus type 1 mutant vectors in vivo. Cancer Res. 2001;61:2983–95. [PubMed] [Google Scholar]
- 52.Jacobs A, Voges J, Reszka R, Lercher M, Gossmann A, Kracht L. Positron-emission tomography of vector-mediated gene expression in gene therapy for gliomas. Lancet. 2001;358:727–9. doi: 10.1016/s0140-6736(01)05904-9. [DOI] [PubMed] [Google Scholar]
- 53.MacLaren DC, Gambhir SS, Satyamurthy N, et al. Repetitive, non-invasive imaging of the dopamine D2 receptor as a reporter gene in living animals. Gene Ther. 1999;6:785–91. doi: 10.1038/sj.gt.3300877. [DOI] [PubMed] [Google Scholar]
- 54.Fu DX, Tanhehco Y, Chen J, et al. Bortezomib-induced enzyme-targeted radiation therapy in herpesvirus-associated tumors. Nat Med. 2008;14:1118–22. doi: 10.1038/nm.1864. [DOI] [PMC free article] [PubMed] [Google Scholar]
- 55.Zhang CY, Lu J, Tsourkas A. Iron chelator-based amplification strategy for improved targeting of transferrin receptor with SPIO. Cancer Biol Ther. 2008;7:889–95. doi: 10.4161/cbt.7.6.5893. [DOI] [PubMed] [Google Scholar]
- 56.Gilad AA, McMahon MT, Walczak P, et al. Artificial reporter gene providing MRI contrast based on proton exchange. Nat Biotechnol. 2007;25:217–9. doi: 10.1038/nbt1277. [DOI] [PubMed] [Google Scholar]
- 57.Kiessling F. Noninvasive cell tracking. Handb Exp Pharmacol. 2008;305:21. doi: 10.1007/978-3-540-77496-9_13. [DOI] [PubMed] [Google Scholar]
- 58.Srinivas M, Aarntzen EH, Bulte JW, et al. Imaging of cellular therapies. Adv Drug Deliv Rev. 2010;62:1080–93. doi: 10.1016/j.addr.2010.08.009. [DOI] [PubMed] [Google Scholar]
- 59.Yaghoubi SS, Gambhir SS. PET imaging of herpes simplex virus type 1 thymidine kinase (HSV1-tk) or mutant HSV1-sr39tk reporter gene expression in mice and humans using [18F]FHBG. Nat Protoc. 2006;1:3069–75. doi: 10.1038/nprot.2006.459. [DOI] [PubMed] [Google Scholar]
- 60.de Vries IJ, Lesterhuis WJ, Barentsz JO, et al. Magnetic resonance tracking of dendritic cells in melanoma patients for monitoring of cellular therapy. Nat Biotechnol. 2005;23:1407–13. doi: 10.1038/nbt1154. [DOI] [PubMed] [Google Scholar]
- 61.Yaghoubi SS, Jensen MC, Satyamurthy N, et al. Noninvasive detection of therapeutic cytolytic T cells with 18F-FHBG PET in a patient with glioma. Nat Clin Pract Oncol. 2009;6:53–8. doi: 10.1038/ncponc1278. [DOI] [PMC free article] [PubMed] [Google Scholar]
- 62.Atkinson AJ, Colburn WA, DeGruttola VG, DeMets DL, Downing GJ, Hoth DF. Biomarkers and surrogate endpoints: preferred definitions and conceptual framework. Clin Pharmacol Ther. 2001;69:89–95. doi: 10.1067/mcp.2001.113989. [DOI] [PubMed] [Google Scholar]
- 63.Sarker D, Workman P. Pharmacodynamic biomarkers for molecular cancer therapeutics. Adv Cancer Res. 2007;96:213–68. doi: 10.1016/S0065-230X(06)96008-4. [DOI] [PubMed] [Google Scholar]
- 64.Workman P, Aboagye EO, Chung YL, et al. Minimally invasive pharmacokinetic and pharmacodynamic technologies in hypothesis-testing clinical trials of innovative therapies. J Natl Cancer Inst. 2006;98:580–98. doi: 10.1093/jnci/djj162. [DOI] [PubMed] [Google Scholar]
- 65.Kissel J, Brix G, Bellemann ME, et al. Pharmacokinetic analysis of 5-[18F]fluorouracil tissue concentrations measured with positron emission tomography in patients with liver metastases from colorectal adenocarcinoma. Cancer Res. 1997;57:3415–23. [PubMed] [Google Scholar]
- 66.Mankoff DA, Shields AF, Krohn KA. PET imaging of cellular proliferation. Radiol Clin North Am. 2005;43:153–67. doi: 10.1016/j.rcl.2004.09.005. [DOI] [PubMed] [Google Scholar]
- 67.Buxton RB, Alpert NM, Babikian V, Weise S, Correia JA, Ackerman RH. Evaluation of the 11CO2 positron emission tomographic method for measuring brain pH. I. pH changes measured in states of altered PCO2. J Cereb Blood Flow Metab. 1987;7:709–19. doi: 10.1038/jcbfm.1987.125. [DOI] [PubMed] [Google Scholar]
- 68.Philipp R. The use of problem-management questionnaires in environmental medicine. Public Health. 1992;106:481–2. doi: 10.1016/s0033-3506(05)80463-9. [DOI] [PubMed] [Google Scholar]
- 69.Morooka M, Kubota K, Kadowaki H, et al. 11C-methio-nine PET of acute myocardial infarction. J Nucl Med. 2009;50:1283–7. doi: 10.2967/jnumed.108.061341. [DOI] [PubMed] [Google Scholar]
- 70.Gupta N, Price PM, Aboagye EO. PET for in vivo pharmacokinetic and pharmacodynamic measurements. Eur J Cancer. 2002;38:2094–107. doi: 10.1016/s0959-8049(02)00413-6. [DOI] [PubMed] [Google Scholar]
- 71.Nunn AD. Molecular imaging and personalized medicine: an uncertain future. Cancer Biother Radiopharm. 2007;22:722–39. doi: 10.1089/cbr.2007.0417. [DOI] [PubMed] [Google Scholar]
- 72.Tolmachev V. Imaging of HER-2 overexpression in tumors for guiding therapy. Curr Pharm Des. 2008;14:2999–3019. doi: 10.2174/138161208786404290. [DOI] [PubMed] [Google Scholar]
- 73.Zhou J, Blakeley JO, Hua J, et al. Practical data acquisition method for human brain tumor amide proton transfer (APT) imaging. Magn Reson Med. 2008;60:842–9. doi: 10.1002/mrm.21712. [DOI] [PMC free article] [PubMed] [Google Scholar]
- 74.Zaheer A, Cho SY, Pomper MG. New agents and techniques for imaging prostate cancer. J Nucl Med. 2009;50:1387–90. doi: 10.2967/jnumed.109.061838. [DOI] [PMC free article] [PubMed] [Google Scholar]
- 75.Wright GL, Grob BM, Haley C, et al. Upregulation of prostate-specific membrane antigen after androgen-deprivation therapy. Urology. 1996;48:326–34. doi: 10.1016/s0090-4295(96)00184-7. [DOI] [PubMed] [Google Scholar]
- 76.Fair WR, Israeli RS, Heston WD. Prostate-specific membrane antigen. Prostate. 1997;32:140–8. doi: 10.1002/(sici)1097-0045(19970701)32:2<140::aid-pros9>3.0.co;2-q. [DOI] [PubMed] [Google Scholar]
- 77.Perner S, Hofer MD, Kim R, et al. Prostate-specific membrane antigen expression as a predictor of prostate cancer progression. Hum Pathol. 2007;38:696–701. doi: 10.1016/j.humpath.2006.11.012. [DOI] [PubMed] [Google Scholar]
- 78.Troyer JK, Beckett ML, Wright GL. Location of prostate-specific membrane antigen in the LNCaP prostate carcinoma cell line. Prostate. 1997;30:232–42. doi: 10.1002/(sici)1097-0045(19970301)30:4<232::aid-pros2>3.0.co;2-n. [DOI] [PubMed] [Google Scholar]
- 79.Nargund V, Al Hashmi D, Kumar P, et al. Imaging with radiolabelled monoclonal antibody (MUJ591) to prostate-specific membrane antigen in staging of clinically localized prostatic carcinoma: comparison with clinical, surgical and histological staging. BJU Int. 2005;95:1232–6. doi: 10.1111/j.1464-410X.2005.05511.x. [DOI] [PubMed] [Google Scholar]
- 80.Pandit-Taskar N, O’Donoghue JA, Morris MJ, et al. Antibody mass escalation study in patients with castration-resistant prostate cancer using 111In-J591: lesion detectability and dosimetric projections for 90Y radioimmunotherapy. J Nucl Med. 2008;49:1066–74. doi: 10.2967/jnumed.107.049502. [DOI] [PMC free article] [PubMed] [Google Scholar]
- 81.Tagawa ST, Beltran H, Vallabhajosula S, et al. Anti-prostate-specific membrane antigen-based radioimmunotherapy for prostate cancer. Cancer. 2010;116:1075–83. doi: 10.1002/cncr.24795. [DOI] [PMC free article] [PubMed] [Google Scholar]
- 82.Alt K, Wiehr S, Ehrlichmann W, et al. High-resolution animal PET imaging of prostate cancer xenografts with three different 64Cu-labeled antibodies against native cell-adherent PSMA. Prostate. 2010;70:1413–21. doi: 10.1002/pros.21176. [DOI] [PubMed] [Google Scholar]
- 83.Foss CA, Mease RC, Fan H, et al. Radiolabeled small-molecule ligands for prostate-specific membrane antigen: in vivo imaging in experimental models of prostate cancer. Clin Cancer Res. 2005;11:4022–8. doi: 10.1158/1078-0432.CCR-04-2690. [DOI] [PubMed] [Google Scholar]
- 84.Mease RC, Dusich CL, Foss CA, et al. N-[N-[(S)-1,3-Dicarboxypropyl]carbamoyl]-4-[18F]fluorobenzyl-L-cysteine, [18F]DCFBC: a new imaging probe for prostate cancer. Clin Cancer Res. 2008;14:3036–43. doi: 10.1158/1078-0432.CCR-07-1517. [DOI] [PMC free article] [PubMed] [Google Scholar]
- 85.Banerjee SR, Pullambhatla M, Byun Y, et al. 68Ga-labeled inhibitors of prostate-specific membrane antigen (PSMA) for imaging prostate cancer. J Med Chem. 2010;53:5333–41. doi: 10.1021/jm100623e. [DOI] [PMC free article] [PubMed] [Google Scholar]
- 86.Hillier SM, Maresca KP, Femia FJ, et al. Preclinical evaluation of novel glutamate-urea-lysine analogues that target prostate-specific membrane antigen as molecular imaging pharmaceuticals for prostate cancer. Cancer Res. 2009;69:6932–40. doi: 10.1158/0008-5472.CAN-09-1682. [DOI] [PMC free article] [PubMed] [Google Scholar]
- 87.Kularatne SA, Zhou Z, Yang J, Post CB, Low PS. Design, synthesis, and preclinical evaluation of prostate-specific membrane antigen targeted (99m)Tc-radioimaging agents. Mol Pharm. 2009;6:790–800. doi: 10.1021/mp9000712. [DOI] [PMC free article] [PubMed] [Google Scholar]
- 88.Lapi SE, Wahnishe H, Pham D, et al. Assessment of an 18F-labeled phosphoramidate peptidomimetic as a new prostate-specific membrane antigen-targeted imaging agent for prostate cancer. J Nucl Med. 2009;50:2042–8. doi: 10.2967/jnumed.109.066589. [DOI] [PMC free article] [PubMed] [Google Scholar]
- 89.Oka S, Hattori R, Kurosaki F, et al. A preliminary study of anti-1-amino-3-18F-fluorocyclobutyl-1-carboxylic acid for the detection of prostate cancer. J Nucl Med. 2007;48:46–55. [PubMed] [Google Scholar]
- 90.Schuster DM, Votaw JR, Nieh PT, et al. Initial experience with the radiotracer anti-1-amino-3-18F-fluorocyclobutane-1-carboxylic acid with PET/CT in prostate carcinoma. J Nucl Med. 2007;48:56–63. [PubMed] [Google Scholar]
- 91.Jani AB, Fox TH, Whitaker D, Schuster DM. Case study of anti-1-amino-3-F-18 fluorocyclobutane-1-carboxylic acid (anti-[F-18] FACBC) to guide prostate cancer radiotherapy target design. Clin Nucl Med. 2009;34:279–84. doi: 10.1097/RLU.0b013e31819e51e3. [DOI] [PubMed] [Google Scholar]
- 92.Dehdashti F, Picus J, Michalski JM, et al. Positron tomographic assessment of androgen receptors in prostatic carcinoma. Eur J Nucl Med Mol Imaging. 2005;32:344–50. doi: 10.1007/s00259-005-1764-5. [DOI] [PubMed] [Google Scholar]
- 93.Beheshti M, Langsteger W, Fogelman I. Prostate cancer: role of SPECT and PET in imaging bone metastases. Semin Nucl Med. 2009;39:396–407. doi: 10.1053/j.semnuclmed.2009.05.003. [DOI] [PubMed] [Google Scholar]
- 94.Kang JH, Chung JK. Molecular-genetic imaging based on reporter gene expression. J Nucl Med. 2008;49(Suppl 2):164S–79. doi: 10.2967/jnumed.107.045955. [DOI] [PubMed] [Google Scholar]
- 95.Serganova I, Mayer-Kukuck P, Huang R, Blasberg R. Molecular imaging: reporter gene imaging. Handb Exp Pharmacol. 2008;167:223. doi: 10.1007/978-3-540-77496-9_8. [DOI] [PubMed] [Google Scholar]
- 96.Deng WP, Wu CC, Lee CC, et al. Serial in vivo imaging of the lung metastases model and gene therapy using HSV1-tk and ganciclovir. J Nucl Med. 2006;47:877–84. [PubMed] [Google Scholar]
- 97.Wang HE, Yu HM, Liu RS, et al. Molecular imaging with 123I-FIAU, 18F-FUdR, 18F-FET, and 18F-FDG for monitoring herpes simplex virus type 1 thymidine kinase and ganciclovir prodrug activation gene therapy of cancer. J Nucl Med. 2006;47:1161–71. [PubMed] [Google Scholar]
- 98.Gambhir SS, Bauer E, Black ME, et al. A mutant herpes simplex virus type 1 thymidine kinase reporter gene shows improved sensitivity for imaging reporter gene expression with positron emission tomography. Proc Natl Acad Sci U S A. 2000;97:2785–90. doi: 10.1073/pnas.97.6.2785. [DOI] [PMC free article] [PubMed] [Google Scholar]
- 99.Hingorani M, Spitzweg C, Vassaux G, et al. The biology of the sodium iodide symporter and its potential for targeted gene delivery. Curr Cancer Drug Targets. 2010;10:242–67. doi: 10.2174/156800910791054194. [DOI] [PMC free article] [PubMed] [Google Scholar]
- 100.Barton KN, Stricker H, Brown SL, et al. Phase I study of noninvasive imaging of adenovirus-mediated gene expression in the human prostate. Mol Ther. 2008;16:1761–9. doi: 10.1038/mt.2008.172. [DOI] [PMC free article] [PubMed] [Google Scholar]
- 101.Ray P, Tsien R, Gambhir SS. Construction and validation of improved triple fusion reporter gene vectors for molecular imaging of living subjects. Cancer Res. 2007;67:3085–93. doi: 10.1158/0008-5472.CAN-06-2402. [DOI] [PubMed] [Google Scholar]
- 102.Long CM, van Laarhoven HW, Bulte JW, Levitsky HI. Magnetovaccination as a novel method to assess and quantify dendritic cell tumor antigen capture and delivery to lymph nodes. Cancer Res. 2009;69:3180–7. doi: 10.1158/0008-5472.CAN-08-3691. [DOI] [PMC free article] [PubMed] [Google Scholar]
- 103.Djulbegovic M, Beyth RJ, Neuberger MM, et al. Screening for prostate cancer: systematic review and meta-analysis of randomised controlled trials. BMJ. 2010;341:c4543. doi: 10.1136/bmj.c4543. [DOI] [PMC free article] [PubMed] [Google Scholar]
- 104.Deutscher SL. Phage display in molecular imaging and diagnosis of cancer. Chem Rev. 2010;110:3196–211. doi: 10.1021/cr900317f. [DOI] [PMC free article] [PubMed] [Google Scholar]
- 105.Kelly KA, Setlur SR, Ross R, et al. Detection of early prostate cancer using a hepsin-targeted imaging agent. Cancer Res. 2008;68:2286–91. doi: 10.1158/0008-5472.CAN-07-1349. [DOI] [PMC free article] [PubMed] [Google Scholar]
- 106.Tajima Y, Murakami M, Yamazaki K, et al. Sentinel node mapping guided by indocyanine green fluorescence imaging during laparoscopic surgery in gastric cancer. Ann Surg Oncol. 2010;17:1787–93. doi: 10.1245/s10434-010-0944-0. [DOI] [PubMed] [Google Scholar]
- 107.Noguchi M, Yokoi M, Nakano Y. Axillary reverse mapping with indocyanine fluorescence imaging in patients with breast cancer. J Surg Oncol. 2010;101:217–21. doi: 10.1002/jso.21473. [DOI] [PubMed] [Google Scholar]
- 108.Uhara H, Takata M, Saida T. Sentinel lymph node biopsy in Japan. Int J Clin Oncol. 2009;14:490–6. doi: 10.1007/s10147-009-0941-0. [DOI] [PubMed] [Google Scholar]
- 109.Kusano M, Tajima Y, Yamazaki K, Kato M, Watanabe M, Miwa M. Sentinel node mapping guided by indocyanine green fluorescence imaging: a new method for sentinel node navigation surgery in gastrointestinal cancer. Dig Surg. 2008;25:103–8. doi: 10.1159/000121905. [DOI] [PubMed] [Google Scholar]
- 110.Winer JH, Choi HS, Gibbs-Strauss SL, Ashitate Y, Colson YL, Frangioni JV. Intraoperative localization of insulinoma and normal pancreas using invisible near-infrared fluorescent light. Ann Surg Oncol. 2010;17:1094–100. doi: 10.1245/s10434-009-0868-8. [DOI] [PMC free article] [PubMed] [Google Scholar]
- 111.Gotoh K, Yamada T, Ishikawa O, et al. A novel image-guided surgery of hepatocellular carcinoma by indocya-nine green fluorescence imaging navigation. J Surg Oncol. 2009;100:75–9. doi: 10.1002/jso.21272. [DOI] [PubMed] [Google Scholar]
- 112.Keramidas M, Josserand V, Righini CA, Wenk C, Faure C, Coll JL. Intraoperative near-infrared image-guided surgery for peritoneal carcinomatosis in a preclinical experimental model. Br J Surg. 2010;97:737–43. doi: 10.1002/bjs.6986. [DOI] [PubMed] [Google Scholar]
- 113.Sheth RA, Upadhyay R, Stangenberg L, Sheth R, Weissleder R, Mahmood U. Improved detection of ovarian cancer metastases by intraoperative quantitative fluorescence protease imaging in a pre-clinical model. Gynecol Oncol. 2009;112:616–22. doi: 10.1016/j.ygyno.2008.11.018. [DOI] [PMC free article] [PubMed] [Google Scholar]
- 114.Massoud TF, Paulmurugan R, Gambhir SS. A molecularly engineered split reporter for imaging protein-protein interactions with positron emission tomography. Nat Med. 2010;16:921–6. doi: 10.1038/nm.2185. [DOI] [PMC free article] [PubMed] [Google Scholar]
- 115.Nunn AD. The cost of developing imaging agents for routine clinical use. Invest Radiol. 2006;41:206–12. doi: 10.1097/01.rli.0000191370.52737.75. [DOI] [PubMed] [Google Scholar]
- 116.Weber WA, Czernin J, Phelps ME, Herschman HR. Technology Insight: novel imaging of molecular targets is an emerging area crucial to the development of targeted drugs. Nat Clin Pract Oncol. 2008;5:44–54. doi: 10.1038/ncponc0982. [DOI] [PMC free article] [PubMed] [Google Scholar]
- 117.Mills G. The exploratory IND. J Nucl Med. 2008;49:45N–7N. [PubMed] [Google Scholar]
- 118.Vallabhajosula S. (18)F-labeled positron emission tomographic radiopharmaceuticals in oncology: an overview of radiochemistry and mechanisms of tumor localization. Semin Nucl Med. 2007;37:400–19. doi: 10.1053/j.semnuclmed.2007.08.004. [DOI] [PubMed] [Google Scholar]
- 119.Shields AF, Grierson JR, Dohmen BM, et al. Imaging proliferation in vivo with [F-18]FLT and positron emission tomography. Nat Med. 1998;4:1334–6. doi: 10.1038/3337. [DOI] [PubMed] [Google Scholar]
- 120.Graham MM. The clinical trials network of the society of nuclear medicine. Semin Nucl Med. 2010;40:327–31. doi: 10.1053/j.semnuclmed.2010.03.006. [DOI] [PubMed] [Google Scholar]