Abstract
Purpose
The lipid layer of the tear film reduces evaporation and hence limits hyperosmolarity; the latter can cause ocular surface damage in dry eye conditions. The barrier to evaporation depends on the structure of the lipid layer, so that, for example, localized regions of thin lipid could cause increased evaporation. It is therefore important to study the detailed structure of the lipid layer, and high resolution microscope for this purpose is described here. To broaden the range of observations, both normal and dry eye conditions were included in this study, but a systematic comparison of the two conditions will be reserved for future reports.
Methods
The microscope incorporates the following features. First, a long working distance microscope objective is used with a high numerical aperture and resolution. Second, because such a high resolution objective has a limited depth of focus, 2000 images are recorded with a video camera over a 20 s period, with the expectation that some images will be in focus. Third, illumination is from a stroboscopic light source having a flash duration of less than 0.1 ms, to avoid blurring from movement of the lipid layer. Fourth, the image is in focus when the edge of the image is sharp – this is used to select images in good focus. Fifth, an aid is included to help align the cornea at normal incidence to the axis of the objective so that the whole lipid image can be in focus. Illustrative results are presented derived from over 10,000 images from 375 subjects.
Results
Images could generally be described as containing localized “objects” within an extensive “background”. Backgrounds were of two types – dark (thin) “seas” and “irregular” (thicker). Sea backgrounds were less common and included irregular “islands” and round “lenses” of lipid. Irregular backgrounds included thick “droplets” and thin “dots”. Islands were fluid and on occasion turned into lenses. Dots sometimes, but not always, seem to increase in size between blinks; sometimes they had a flower-like outline. Droplets were very stable, with little change during the interblink interval. Within about 0.1 seconds after a blink, sea backgrounds were relatively more common than at later times, droplets were less common, and the lipid layer was significantly thinner; objects described as “snowflakes” and “clouds” tended to occur in this early period.
Discussion
Lipid islands within a sea background show many of the characteristics of dewetting including formation of round “lakes” (holes), rupture of the lake walls to form larger irregular lakes, further rupture to form islands which eventually form circular lenses. The observation of thick, narrow ridges surrounding lakes and islands is another characteristic of dewetting. Dewetting indicates that, in this case, the lipid layer has a negative “spreading coefficient”, perhaps because of a lack of polar lipids at the interface with the aqueous layer. Conversely, when the whole surface seems to be covered in lipid, the spreading coefficient may be positive, indicating adequate polar lipids at the interface. Dots, particularly those with flower-like outlines, may be related to “lipid domains” observed in monolayers. The fact that lipid droplets within an irregular background are stable over the inter-blink interval, indicates that their origin is either due to other phases (compression, upstroke) of the blink cycle, or that they correspond to the “fat droplets” observed in Meibomian glands. The stability of irregular backgrounds could be due to solid or gel-like properties of the lipid layer, but may also be due to an absence of overall force (from surface tension and pressure gradients) on the lipid layer.
The role of evaporation in dry eye disorders is well established.[1] Tear hyperosmolarity, one of two “core mechanisms” of dry eye disorders[1] is related to an increase in the ratio of evaporation rate to tear secretion rate.[2] In evaporative dry eye, EDE, evaporation rate is increased with normal tear secretion; in aqueous deficient dry eye, ADDE, tear secretion rate is reduced with normal evaporation; therefore, the ratio of evaporation to tear secretion rate, and hence osmolarity, is increased in both EDE and ADDE, and evaporation is important in both disorders.[2–3] Correspondingly, considering both disorders, hyperosmolarity may be the best marker of dry eye severity.[4] Hyperosmolarity is an important cause of ocular surface inflammation and damage.[5–6] The osmolarity of the precorneal tear film may reach much higher levels than reported values obtained from the tear meniscus.[5, 7–8]
The other “core mechanism” of dry eye is tear film instability which is assessed by tear breakup time measurements.[1] We have argued that breakup is closely related to the thinning rate (reduction of tear thickness) of the tear film which can be observed between blinks[9] and that this thinning is largely due to evaporation.[8, 10–11] Thus there is evidence that evaporation plays an important role in both hyperosmolarity and tear film instability, and in both EDE and ADDE. Correspondingly, tear evaporation rates have been reported to be increased in dry eyes.[12–13]
Evaporation is controlled by the lipid layer of the tear film. Evaporation rate of the rabbit precorneal tear film was increased by a factor of 15, from 0.47 to 7 μm/min, after the lipid layer was washed away.[14] Correspondingly, evaporation from the human tear film has been related to lipid layer pattern.[15] A report that both evaporation and meibomian gland dropout increase with age is consistent with an expected correlation between evaporation and lipid thickness.[16]
If tear thinning between blinks is largely due to evaporation,[8, 10–11] then tear thinning rate should be inversely related to mean lipid thickness. This has been demonstrated by “spectral interferometry”; for example, five subjects with lipid thickness less than 24 nm all had “rapid” thinning rates of over 4μm/min while 31 of 33 subjects with lipid thickness over 30.5 nm had “slow” thinning rates of less than 4 μm/min.[17] However the correlation between thinning rate and lipid thickness was not perfect, with a Spearman Correlation of R=−0.385. Possible reasons for this lack of perfect correlation include contributions of non-evaporative mechanisms such as “tangential flow” of tears (along the corneal surface), measurement errors in lipid thickness and thinning rate, the effect of variability of precorneal air currents on evaporation rate, the effect of lipid layer composition and structure on evaporation, and nonuniformity of lipid layer thickness within the 33 μm diameter measurement spot. With regard to this last reason, it was found that fits to the observed reflection spectra could be improved by assuming that the lipid thickness varied within the measurement spot, but it was not possible to determine the exact characteristics of this thickness variation.[17] To appreciate the possible contribution of thickness variation to evaporation rate, consider the rabbit tear film discussed above,[14] but after the lipid layer over half the cornea has been removed and added to the other half to make a double thickness. The total evaporation over the exposed half will be half that of an eye totally denuded of lipid, and so 15/2=7.5 times greater than that for a uniform lipid layer having the same total precorneal lipid. Even ignoring evaporation from the other half of the corneal surface, evaporation would be greatly increased by this redistribution of lipid. Thus, evaporation depends not only on mean lipid thickness but also on its spatial variability.
An aim of this study was therefore to investigate the spatial variability of the lipid layer with a purpose-built microscope of the highest practical resolution. Previous purpose-built systems for imaging the lipid layer have generally covered a large area with relatively low resolution,[18–22] whereas higher resolution microscopy has used systems designed for other purposes such as differential interference microscopy[23–25] slit lamp biomicroscopy[23, 26] non-contact endothelial cameras[20, 25] specular microscopy[27] and confocal microscopy.[28–29] Limitations of such systems may include objectives of relatively low numerical aperture (thus limiting resolution), blur due to lipid layer movement during relatively long exposures, and lack of focusing and alignment aids; the current system was designed to minimize such limitations.
In addition to investigating spatial variability, this study provides details of the fine structure of the lipid layer and its changes in the interval between blinks. While this study demonstrates the characteristics of images obtained from both normals and dry eye disorders, a more systematic analysis of differences between dry eyes and normals will be deferred to future publications.
METHODS
The high resolution microscope
The microscope includes the following five features. First, a long working distance microscope objective is used with the highest readily obtainable numerical aperture (0.6). Second, because such a high resolution objective has a limited depth of focus (about 1 μm), 2000 images are recorded with a video camera over a 20 s period, with the expectation that some images will be in focus. Third, illumination is from a stroboscopic light source having a flash duration of less than 0.1 ms, to avoid blurring from movement of the lipid layer and eye. Fourth, it is arranged that the image is in focus when the edge of the image is sharp – in this way, it is possible to decide whether an apparently blurred image is due to lack of sharp features or to poor focus. Fifth, an aid is included to help align the cornea at normal incidence to the axis of the objective so that the whole lipid image can be in focus.
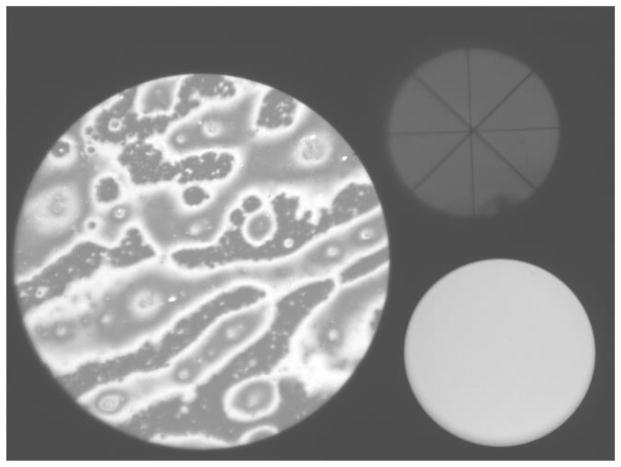
Figure B shows that the microscope records three “spots”. On the left the “image spot” records an area of the lipid layer of 200 μm diameter. The system is designed so that this image is in focus when the edge of the image is in focus. On the upper right is the “alignment spot” which was used for four purposes. First, alignment of the cornea normal to the microscope axis was achieved when the vertical/horizontal cross hairs (“+”) intersect at the same point as the diagonal cross hairs (“x”). Second, this spot shows any obstruction from eye lashes (some is seen near the bottom of the spot) and is used to estimate a “lash obstruction fraction”, e.g., a value of 0.1 means that 10% of the imaging beam was obstructed by eye lashes and 90% was unobstructed, and a corresponding correction was made to reflectance estimates. Third, the alignment spot was used as a coarse focusing aid (unlike the image spot, this spot remains visible with considerable defocus; the required direction of movement of the microscope for focusing is indicated by increasing size of the alignment spot). Finally, the alignment spot was used to detect the occurrence of blinks. The “monitor spot” at the lower right records the intensity of the stroboscopic light source, which varies slightly from one flash to the next.
Figure B.
Image obtained with the microscope. The lipid layer is seen in the “image spot” on the left. The alignment spot on the upper right is used to align the cornea at normal incidence to the axis of the microscope objective. The monitor spot, at lower right, is used for monitoring the intensity of the stroboscopic flash. See text for details. (xx add subject details to all images?) Normal tear film, 57 year old, white female.
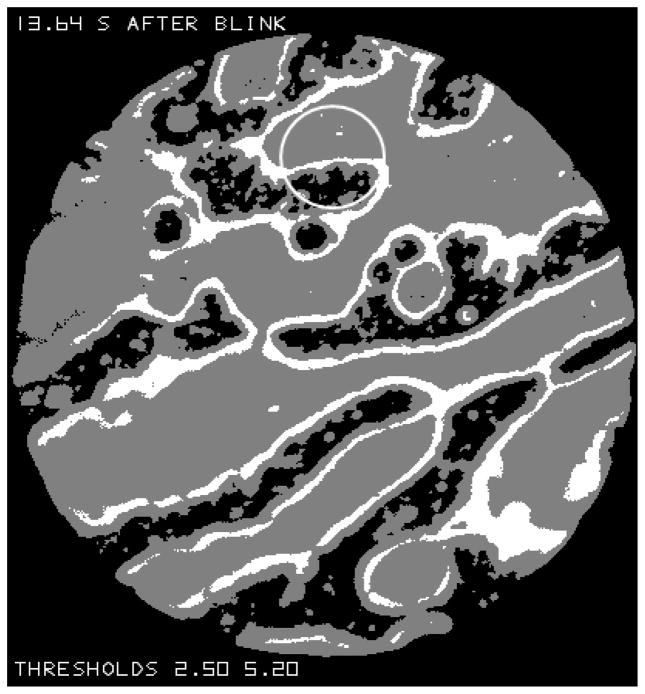
A program was written to process the video recording of 2000 images, including estimating the blur of the image spot from the blur of the upper, lower, left and right edges, and selecting those images with a mean edge blur below some criterion value. Pixel responses in the image spot were converted to reflectance values (see below). The program detected the time of occurrence of the upstroke of blinks. It could be used to increase the contrast of the image spot to help visualize low contrast detail and to “threshold” the image spot, i.e., display all pixels in a specified reflectance range by a uniform grey, black or white level (see Figure L). Additionally, reflectance histograms could be generated for the central 90% of the diameter of the image spot (thus avoiding the effects of any blurring near the spot edge).
Figure L.
The image from Figure B after it has been “thresholded” so that black regions give reflectance less than 2.5%, white regions give reflectance over 5.2% and grey regions give intermediate reflectance. The grey region marked “a” probably corresponds to relatively thick lipid (see text). The circle near the top corresponds to the 33 μm measurement spot used previously to measure lipid thickness.[17]
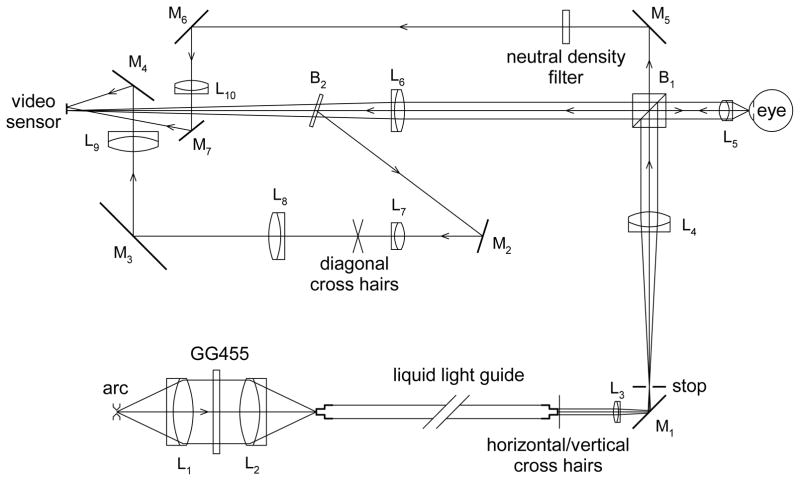
Figure D gives details of the optical system. It should be noted that, although the numerical aperture of the objective is 0.6, the illumination beam has a smaller numerical aperture of 0.5 (this has implications for the effect of local distortions of the lipid layer surface – see below). Radiation level at the cornea was measured using a thermopile (ST150, Dexter Research, Dexter, MI) and found to be 51 μW, which is less than the threshold limit value for exposures of >1000 s.[30] Each pixel in the image corresponds to 0.5 μm on the lipid layer. Resolution was estimated from images of tiny dust particles on a glass plate; the intensity distribution near the smallest particles could be fitted with a two dimensional Gaussian function with a standard deviation of 0.5 μm, corresponding to a point spread function with a full width at half maximum of 1.2 μm.
Figure D.
Microscope optical system. Lenses are denoted L (L1, L2, L5, L7 and L8 are actually multi-element lenses), mirrors are denoted M, and beam splitters B. A PerkinElmer (Salem, MA) FX-1160 short arc Xenon flashlamp, giving 100 flashes per second, is focused by L1 and L2 on the entrance aperture of a liquid light guide. The GG455 filter (Schott, Mainz, Germany) absorbs wavelengths below 455 nm thus reducing chromatic aberration in the microscope objective. Horizontal/vertical cross hairs are placed against the exit aperture of the liquid light guide and are focused by L3 and L4 on the rear focal plane of the 20X microscope objective, L5 (Edmund Optics High Resolution, Infinity Corrected, Barrington, NJ); these cross hairs form a fixation target for the subject and are also used in the alignment spot. The stop is in the focal plane of L4 and forms the boundary of the “image spot”. The sensor of the A602F video camera (resolution 656x490 pixels, Basler, Ahrensburg, Germany), on which the lipid layer image is formed, is in the focal plane of L6; therefore, the lipid layer is in focus when its boundary is in focus, and so the blur of this boundary indicates the blur of the lipid layer image. The beam reflected by glass plate beamsplitter, B2, is used for the “alignment spot”. The reflected image of the horizontal/vertical cross hairs is focused on the diagonal cross hairs and moves when the eye is misaligned laterally or vertically; both cross hairs are then re-imaged on the video sensor to form the alignment spot. The part of the illumination beam transmitted through the cube beamsplitter, B1, generates the “monitor spot”. The main optical system, after the liquid light guide, was mounted on a slit lamp base, while the input to the light guide was on a separate table.
The response of any pixel in the image spot depends on two factors – the thickness of the lipid layer which determines its reflectance, and any local distortion (e.g., convexity) of the lipid layer surface (see Appendix). To estimate the first factor, it is necessary to estimate the “spectral response function” of the video system (corresponding to the combined effects of spectral energy distribution of the source, transmission and reflectance spectra of components in the optical pathway, and spectral sensitivity of the video camera). This was estimated by measuring responses in the imaging spot after placing each of 14 long pass filters in the reflected beam between beam splitter B1 and lens L6 in Figure D, starting with the GG455 filter which was moved from the position in Figure D; the GG455 filter was then replaced by other filters, without being returned to its original position. Thus, for example, the response to the GG455 filter minus the response to the next filter in the sequence, GG 475, corresponds to a spectral band from about 455 to 475 nm, and thus has an approximate mean wavelength of 465 nm.
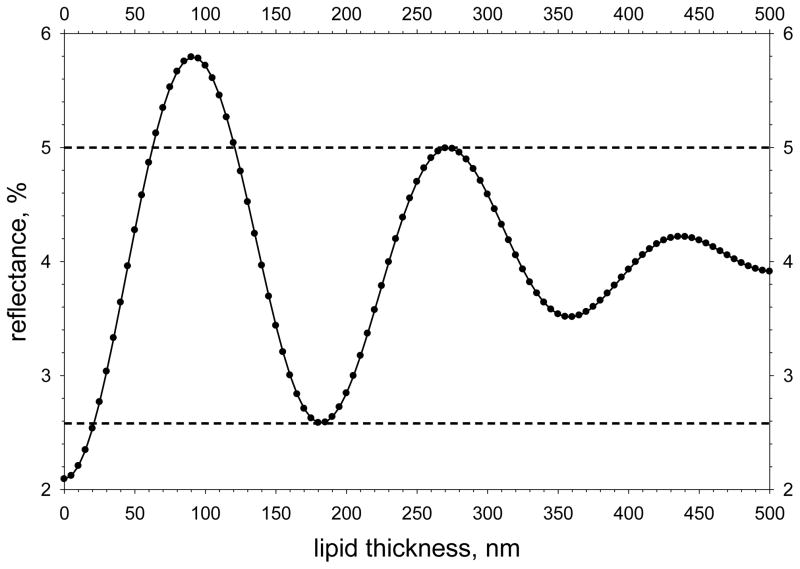
To estimate reflectance from pixel response, reflection from the front surface of a plate of BK7 crown glass was imaged (the reflection from the rear surface was greatly out of focus and estimated to contribute less than 0.2% of the reflected light); the reflectance from the glass plate was calculated from Fresnel’s Equation[31] taking account of the spectral response function determined above. A small correction was made for non-linearity of the video sensor. The relation between reflectance and lipid thickness is shown in Figure F and was calculated using standard equations[32] taking account of the spectral response function of the system (see above), together with the refractive index and dispersion of meibomian lipid,[33] and the refractive index of aqueous tears,[34] assumed to have the same dispersion as water. Horizontal dashed lines have been drawn corresponding to reflectances of 2.58% and 5.00%. When reflectance is less than 2.58%, lipid thickness is less than 21 nm; when reflectance is greater than 5.00%, lipid thickness is between 62 and 121 nm; when reflectance is between 2.58 and 5.00%, there is more ambiguity because lipid thickness may be between 21 and 62 nm, but could also be over 121 nm.
Figure F.
Calculated reflectance as a function of lipid thickness. Horizontal dashed lines have been drawn through the minimum corresponding to a lipid thickness of half a (mean) wavelength and the maximum corresponding to three quarters of a wavelength (see text for implications).
Subjects and experimental procedure
The images presented here are selected from a study of 375 subjects, giving over 10,000 images which were evaluated to be of at least “fair” quality on the basis of the sharpness of the edge of the image spot (see above). 335 of these subjects (xx normals and xx having dry eye conditions) were enrolled in a “Dry Eye in Menopause” study (principal investigator, KK Nichols) while 20 normals and 20 dry eye subjects were enrolled in a separate study which included low resolution imaging of the lipid layer. (xx add male/female, age data?) The study adhered to the principles of the Declaration of Helsinki and was approved by the Biomedical Institutional Review Board of the Ohio State University. Informed consent was obtained from all subjects after explanation of the procedure.
The subject’s head was positioned on a chin and head rest. After alignment, recordings were made for 20 seconds, with normal blinking. (xx – add other tests?)
Statistical analysis was performed with Minitab for Windows (State College, PA) using non-parametric statistics including Mann-Whitney, Spearman Correlation and Fisher Exact Tests. A probability, P<0.05 was considered significant.
RESULTS
Lipid thickness variability
A “thresholded” copy of the image in Figure B is shown in Figure L. Black regions correspond to reflectance less than 2.5% (expected lipid thickness less than 20 nm, see Figure F), white regions give reflectance over 5.2% (expected thickness 67 to 117 nm), and grey regions give reflectance between these two levels (expected thickness 20 to 67 nm or over 117 nm). (These reflectance thresholds were chosen to be slightly lower and higher, respectively, than the values illustrated by dashed lines in Figure F, to prevent misclassification due to slight uncertainties in reflectance estimates.)
The circle near the top of Figure L corresponds to the size of the 33 μm measurement spot we have used to measure lipid thickness[17]. It is uncertain whether the grey region at the top of this circle corresponds to lipid thickness in the range 20 to 67 nm or over 117 nm. As noted in that study, better fits to reflectance spectra could be obtained by assuming that the lipid thickness in the measurement spot was variable rather than uniform. In accordance with that, it is seen that lipid thickness within the 33 μm circle in Figure L may vary from under 20 nm to over 67 nm and perhaps to over 117 nm.
Effect of surface distortion together with defocus
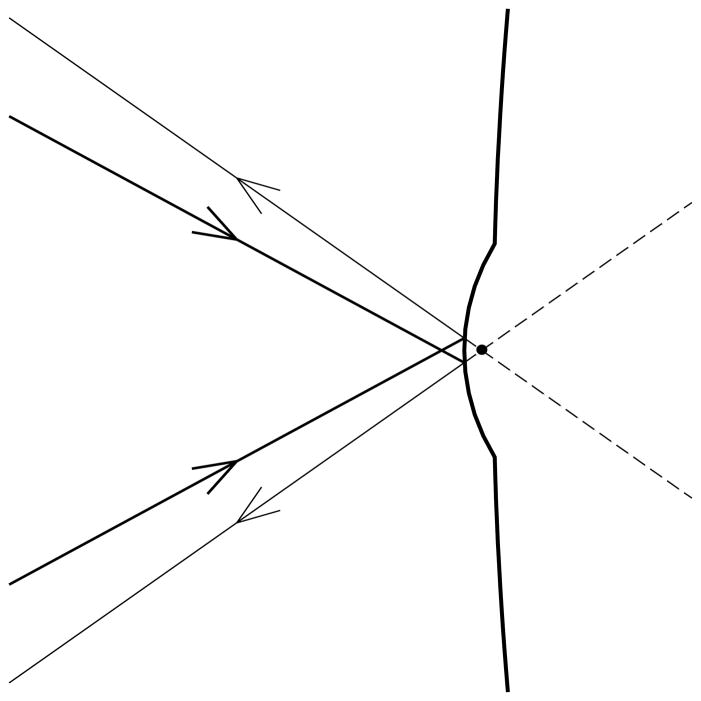
As illustrated in the Appendix, if the microscope objective is focused behind a convexity of the lipid surface, it will appear bright, whereas it will appear dark if focused in front of the convexity. This effect is illustrated in Figure N which shows two successive images of a relatively large object above the center of the image spot. Interference fringes are seen near the edge of this object, which are probably too close together to be resolved near the center, implying a relatively thick object protruding somewhat from the surface. Small bright spots are seen in Figure Na, which tend to be replaced by dark dots 0.01 seconds later in Figure Nb. Based on the discussion of Figure H, these spots may be interpreted as irregularities (probably convexities) on the surface of the object. Some parts of the object were dark both before and after the change in focus, perhaps because the surface was so distorted that some of the reflected beam did not enter the microscope objective. Thus, the change in appearance with focus indicates that this object has a rough surface. Much of the image outside this large object does not change between the two micrographs, as expected for a smooth surface.
Figure N.
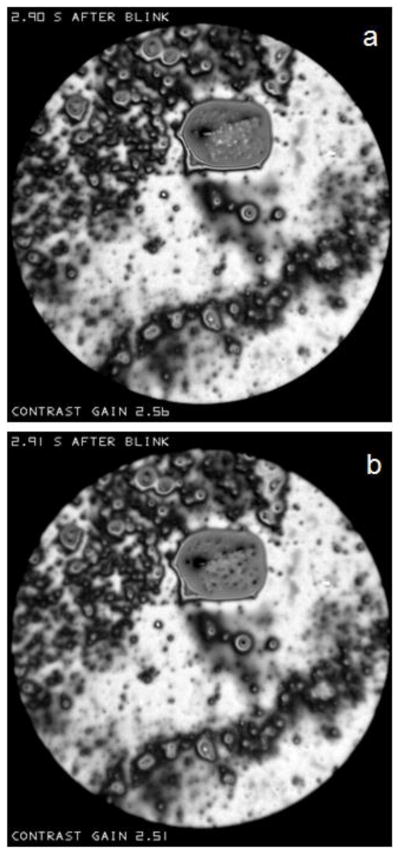
Effect of a change of focus in an interval of 0.01 seconds between (a) and (b) on the reflectance of the relatively large object above the center of the image spot. Light spots on the object surface change to dark dots, as predicted if there is surface roughness (e.g., convexities). “Contrast gain” in this and later figures, indicates how much the contrast has been increased compared to the recorded image. Normal tear film, 51 year old, white female.
Figure H.
The effect of a convexity on the surface of the lipid layer on the amount of light which appears to emanate from the black dot which is a point in the focal plane of the objective. Thin rays demarcate the cone of reflected light which has a greater cone angle than the cone of incident light, given by the thick rays. The corresponding intensity of the image is therefore increased by the increased angular diameter of the reflected light cone coming from this point.
Structure of the lipid layer - backgrounds
In accordance with the “principle of explicit naming”,[35] it is helpful to give names (noted here by quotation marks) to structures observed in the lipid layer for purposes of description, analysis and discussion. The structure of the lipid layer may often be described as containing localized “objects” within an extensive “background”. Nomenclature used in this paper is summarized in Table 1. One type of background, which will be called a “sea”, is shown in Figure P. It is uniform and dark (thin) and, in this case, contains small light (thicker) “objects”. The mean reflectance from this sea was about 2.3%, thus corresponding to a lipid thickness of about 14 nm (Figure F). Given the uncertainty in reflectance estimates discussed previously, it is not possible to determine the exact lipid thickness – it could be absent, or a monolayer, or up to about 20 nm in thickness.
Table 1.
Proposed nomenclature
Figure P.
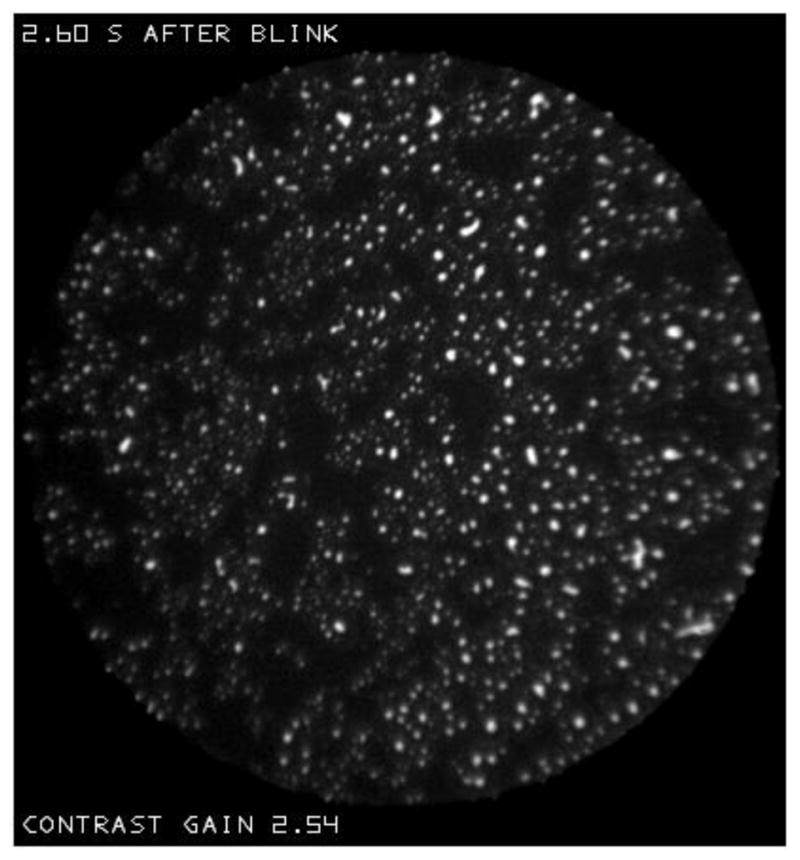
An example of the “sea” type of “background”. It is uniform and dark (thin) and, in this case, contains small “spots”-light (thicker) “objects”. Normal tear film, 82 year old white female.
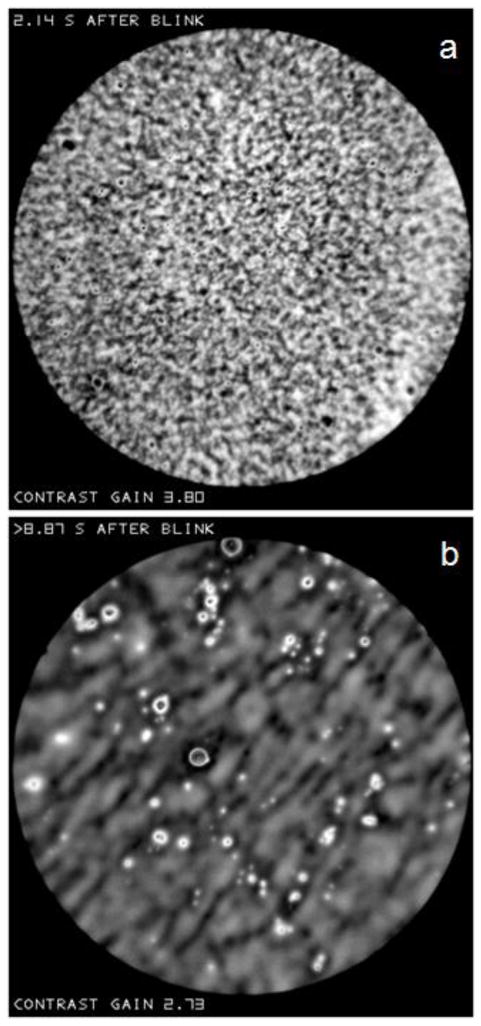
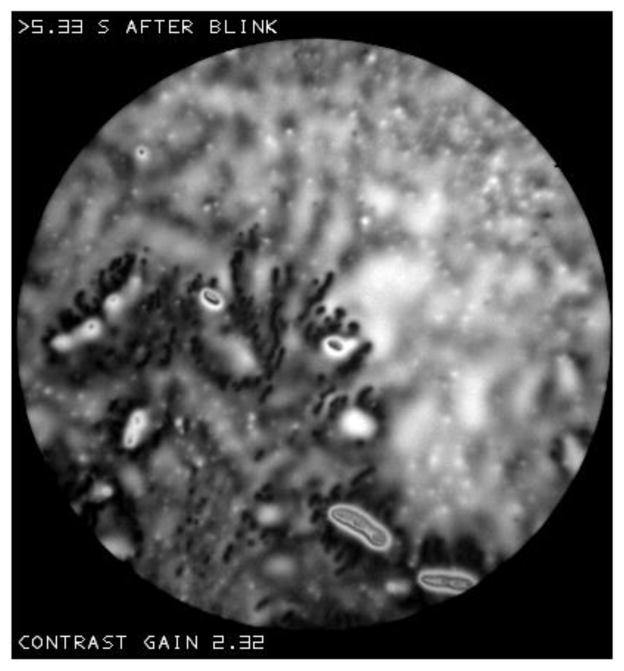
Other backgrounds, which will be called “irregular” are more common than sea backgrounds. They are less uniform in appearance and have higher reflectance than the sea background, implying greater thickness. The background in Figure R(a) has a relatively fine random texture with no obvious tendency to any orientation and little evidence of localized objects. The background in Figure R(b) differs in a number of ways. This background appears more blurred than that in Figure R(a), but this blur is not due to defocus as objects in the image appear sharp, and the edge of the image spot is as sharp as in Figure R(a). The background in Figure R(b) has a tendency to a diagonal orientation and has more obvious localized objects than Figure R(a).
Figure R.
Examples of “irregular” backgrounds. In (a) a fine random texture is seen with no obvious orientation and few localized objects. Normal tear film, 74 year old, white female. In (b) the texture is more blurred with a tendency to a diagonal organization; localized objects are more obvious. Normal tear film, 60 year old, white female.
It may be noted that a background with a thickness of about 90 nm, near the peak of the reflectance versus lipid thickness curve of Figure F, will show relatively little reflectance variation. Thus a lipid layer with a thickness variation from 40 to 50 nm will give a reflectance variation from 3.64% to 4.28% - a range of 0.64% - whereas a thickness variation from 80 to 100 nm gives a reflectance variation from 5.67% to 5.79% - a range of only 0.12%. Thus, when the lipid layer is about 90 nm thick, it will appear to be relatively uniform – this is the case for much of the background in Figure N.
Structure of the lipid layer – thick objects
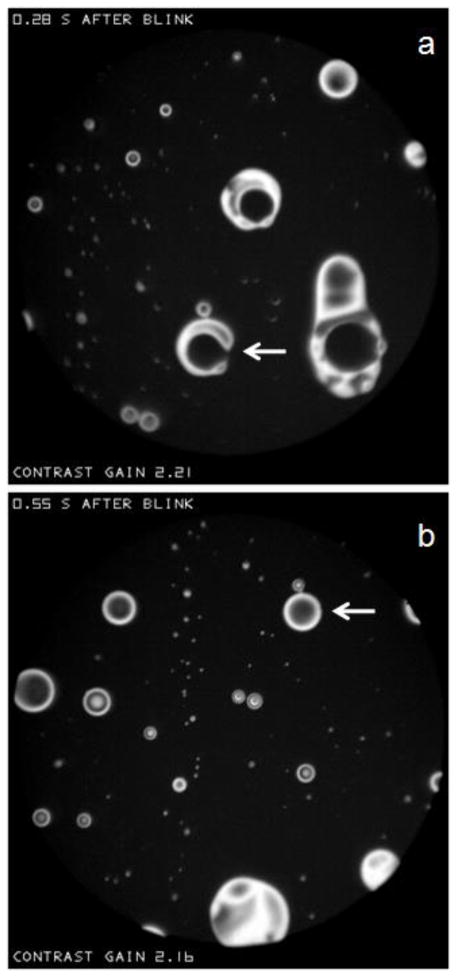
As noted above, Figure P shows light (and therefore thick) “spots” within a dark “sea”. Figure T shows larger objects within a dark sea, for one subject at two different times, 0.28 and 0.55 s, after the same blink. Objects with a circular outline will be called “lenses” because their shapes are similar to that of convex lenses; the term lens has also been used to describe similar structures of hydrophobic oil on water.[36] Lenses often show interference fringes in accordance with Figure F. Thus, lenses with a central dark spot surrounded by a single light ring have a central thickness of about 180 nm, those with a central light spot surrounded by one dark and one light ring have a central thickness of about 270 nm, and so on. More irregular objects in a sea, such as the C shaped object indicated by the arrow in (a) will be called “islands”. Such islands typically appear to be quite fluid; for example this C shaped object, in only 0.27 seconds, becomes the lens indicated by the arrow in (b).
Figure T.
Circular “lenses” and irregularly shaped “islands” in a dark sea. The arrow in (a) points to a C shaped island which, 0.27 seconds later, becomes the lens indicated by the arrow in (b). Dry eye condition, 54 year old white female.
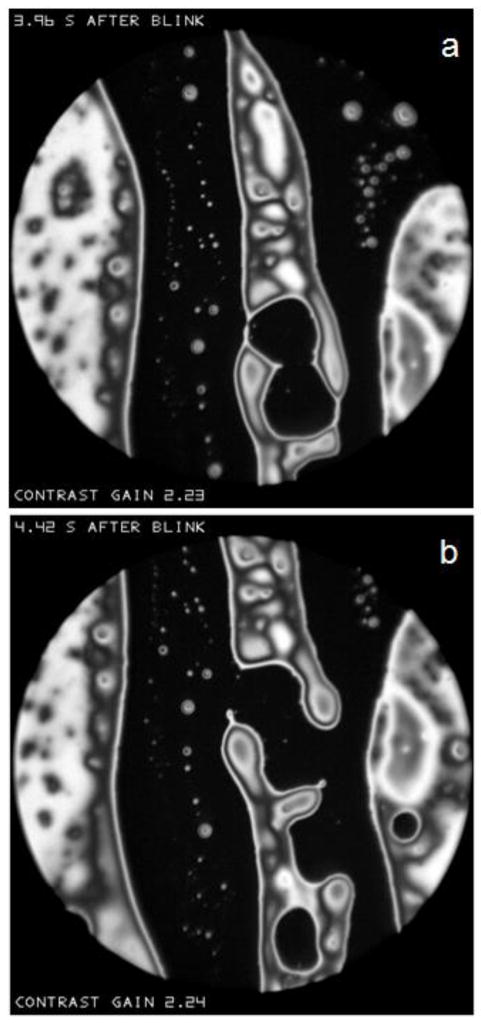
Some relatively large islands, together with numerous small lenses are shown in Figure V. Again, considerable changes occur in the shape of the islands in the 0.46 second interval between (a) and (b). It may be noted that the distinction between “objects” and “backgrounds” is rather arbitrary in this case – the island objects extend off the edge of the image spot, and could be as large as the sea backgrounds.
Figure V.
Large islands and small lenses within a sea. Considerable changes in the islands occur in the 0.46 second interval between (a) and (b). Dry eye condition, 60 year old, white female.
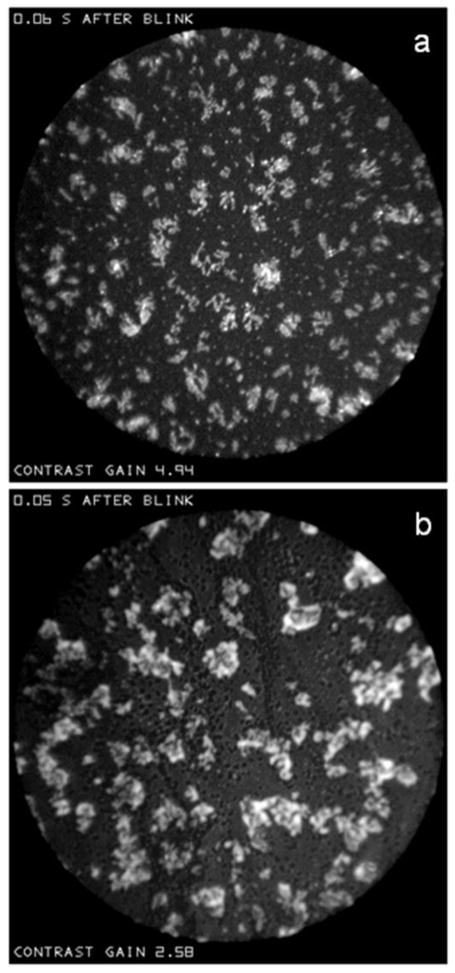
Figure X illustrates, for two different subjects, rather similar types of object embedded in “sea” backgrounds which might be described as (a) “snowflakes” and (b) “clouds”. These patterns tend to occur just after a blink – these examples were recorded 0.06 and 0.05 seconds after a blink, respectively. These images were recorded so soon after a blink that considerable obstruction by eyelashes was observed in the “alignment spot”, making reflectance and lipid thickness estimates particularly uncertain. However, in (b), dark “dots” are visible within the sea, indicating that the lipid layer had a finite thickness over most of the sea; the reflectance of the sea was about 10% greater than that of the dots, indicating that the lipid thickness over the sea was at least 10 nm, even if the dots correspond to bare aqueous – see Figure F.
Figure X.
(a) “Snowflakes” (dry eye condition, 53 year old, white female), and (b) “clouds” (dry eye condition, 55 year old, white female) within “sea” backgrounds. As indicated at the top of each image, these were recorded very soon after a blink.
The “objects” in Figures P, T, V and X were all surrounded by dark (therefore thin), relatively uniform, “seas”. The large object described in Figure N, however, was surrounded by a relatively thick “irregular” background and will be called a “droplet”; many smaller droplets are also visible in that figure. Small droplets tend to have a circular outlines, whereas large droplets tend to have an irregular outline, perhaps caused by fusion of smaller droplets. Interference fringes are seen in many droplets, as with the lenses and islands of Figures T and V; often, some fringes are too narrow to be resolved implying that the droplets are relatively thick.
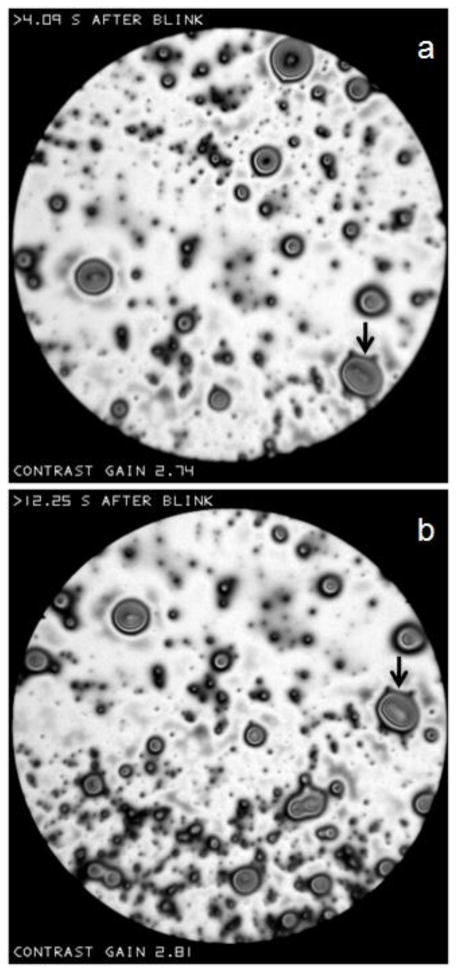
In Figure Z, the arrows show two images of the same droplet taken with an intervening interval of 8.16 seconds. There seems to be very little change in the droplet between the two images (except a slight change in reflectance which may be due to a change of focus as described in Figures H and N). The stability of this droplet over this long interval is to be contrasted with the fluidity seen over much shorter intervals in the islands of Figures T and V.
Figure Z.
“Droplets” observed against a light, “irregular” background. There is little change in the shape of droplets (e.g., the droplet marked by arrows) in the 8.16 second interval between (a) and (b). Normal tear film, 58 year old, white female.
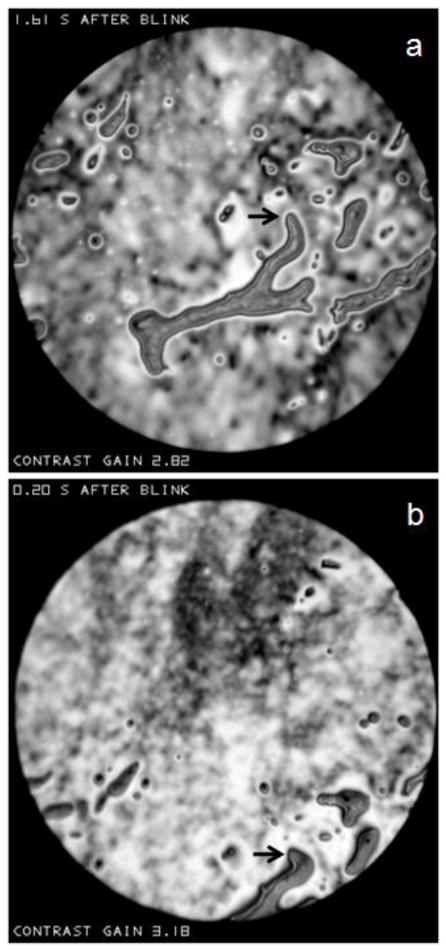
Figure a shows that droplets can have complicated and elongated shapes – the arrow in (a) points to a projection looking like the toe of a high heeled boot. The image in (b) was recorded about one second later, after a partial blink. That this was a partial blink is demonstrated by the fact that the “alignment spot” was totally obstructed by the lid for only 0.01 seconds, compared to a mean obstruction time of 0.05 seconds for seven other blinks of this subject. The toe of the boot (arrow) appears to have been dented by the blink and the pattern of droplets has been compressed along the vertical direction. No examples have been found of changes caused by a full blink, perhaps because the lipid layer is much altered by such a blink, but also because it is unlikely that the same area of lipid will be observed again in the small image area.
Figure a.
(a) “Droplets” of complicated and elongated shape. The arrow points to a projection like the toe of a boot. (b) After a partial blink, the toe has been dented and the pattern of droplets has been compressed vertically. Dry eye condition, 30 year old white male.
Structures of the lipid layer – thin objects
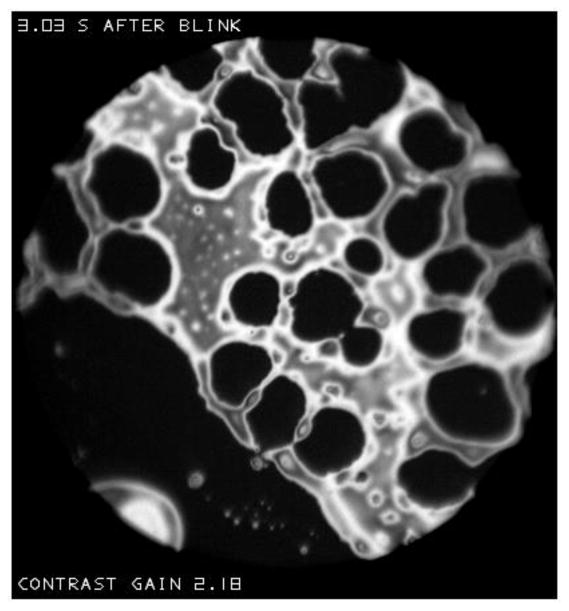
Figure T(a) and V show examples of islands with dark (thin) holes which will be called “lakes”; this term will be applied when a “sea” rather than an “irregular” background is observed. The C-shaped island in Figure T(a) may have developed from rupture of the wall of a lake in a ring-shaped island such as the one near the center of that figure. Similarly, two walls of the large lake in Figure V(a) rupture to form a channel between the seas on either side of the island, and hence to divide the island into two. Figure b shows multiple lakes which have formed in a large island next to a sea (same subject as Figure V but after a different blink). There are signs that the walls between lakes can rupture, to form larger irregularly shaped lakes.
Figure b.
Multiple “lakes” in a large island. This is for the same subject as Figure V, but after a different blink.
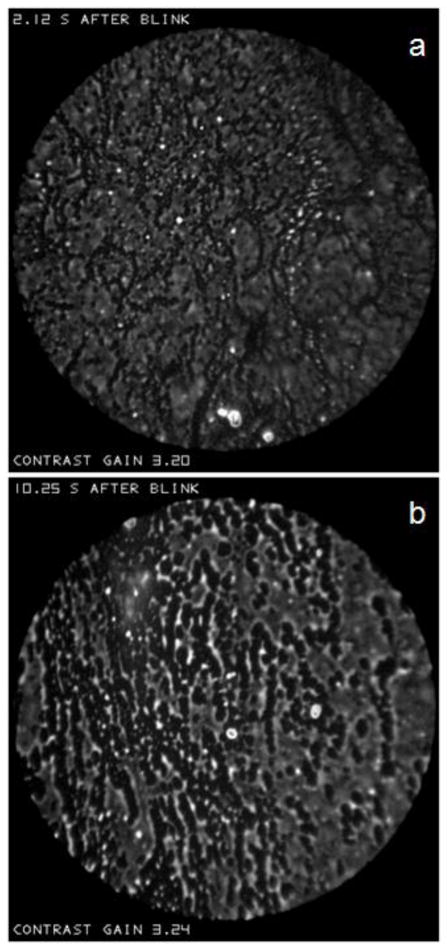
Figure d shows two images at different times after the same blink, which contain dark (thin) objects or “dots” within an “irregular” surround. (The term “dots” will be used for small dark objects, whereas “spots” will be used for small light objects). The dots expand in size in the 8.13 seconds between (a) and (b). In (a) the dots tend to form rows and a network, and there is still a tendency for dots to form rows in (b). The dots in (b) tend to be surrounded by lighter (thicker) lipid, perhaps corresponding to lipid which has been displaced laterally from over the thin dots. Dots tend to occur when the lipid layer is relatively thin; estimated mean lipid thickness was 18 and 19 nm in (a) and (b) respectively and so considerably less than reported mean values.[37]
Figure d.
Dark “dots” at two different times after a blink. The dots expand in the 8.13 second interval between (a) and (b). Dry eye condition, 61 year old black female.
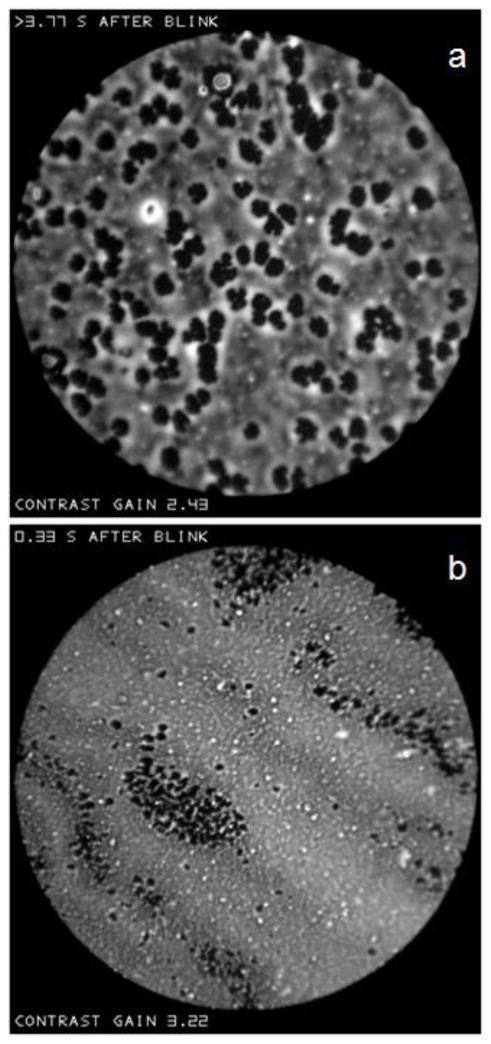
Figure f(a) shows that dots can have a lobular or flower-like shape. Figure f(b) shows that dark dots may form extensive clusters; dots congregate in regions where the background is darker (thinner). In contrast to Figure d, there were no obvious changes in dot size with time after a blink in the recordings for either Figure f(a) or f(b). The dark regions in Figures B and L may correspond to even more extensive clustering of dots. Figure h shows that dots may tend to cluster round droplets. This figure shows a good example of a “blurred” background (cf. Figure R(b)).
Figure f.
(a) Lobular or flower-like dots. Normal tear film, 57 year old, black female. (b) Clustering of dots. Normal tear film, 67 year old white female.
Figure h.
Clustering of dots around droplets. Dry eye condition, 64 year old black female.
Lipid layer changes in the inter-blink interval
To study changes in the lipid layer during the inter-blink interval, characteristics were compared at short, long and intermediate times after a blink. Fifty images, one per subject, were first selected with the shortest delay after a blink, ranging from 0.01 to 0.14 seconds. Then, another 50 images, from 50 new subjects, were selected with the longest delays – 10.20 to 19.53 seconds. Finally, another 50 images, again from new subjects, were selected at intermediate delays – 3.00 to 3.57 seconds. In this way, all 150 images were obtained from different subjects, and were thus independent for statistical analysis.
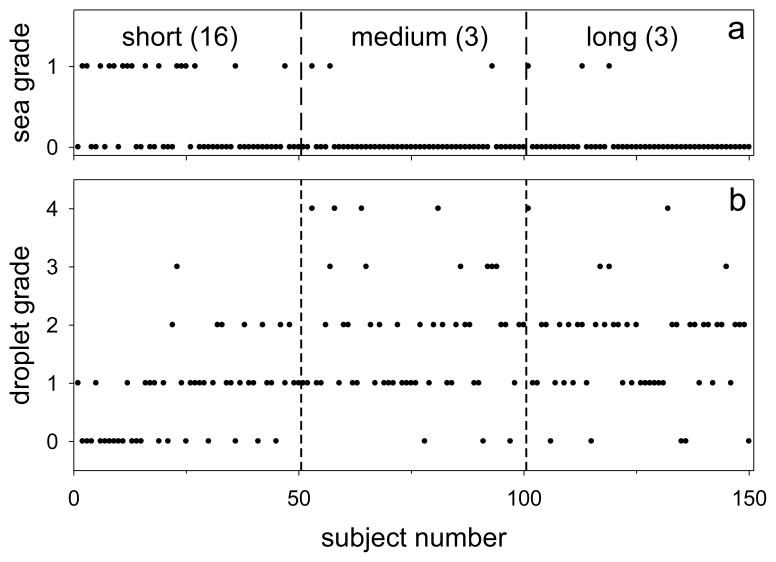
The 150 images in this test series were randomized, and analyzed for two characteristics by an observer who was not familiar with any images from the study. He was first asked to grade whether the “background” was better described as a dark, relatively uniform, “sea” (grade=1) or as lighter and “irregular” (grade=0); he was provided with two examples of each type of background (similar to those presented above), chosen from subjects not included in the test series. Results are shown in Figure j(a), where subjects have been ordered by time after a blink; thus delays for Subjects 1 and 50 were 0.01 and 0.14 seconds, respectively. It is seen that the probability of a “sea” grade was much greater just after a blink – 16/50=0.32 – than at the intermediate and later times – 3/50=0.06 in both cases. The difference between short and medium probabilities (and between short and long) was significant – P<0.002 (Fisher Exact Test). Inspection suggests that the probability of a sea grade was particularly high early in the “short” interval (e.g., the first 0.09 s); this suggestion is supported by a statistical difference between the times associated with grades 1 and 0 in the short interval (P<0.01, Mann-Whitney Test).
Figure j.
Changes in lipid layer structure as a function of short (0.01–0.14 s), medium (3.00–3.57 s) and long (10.20–19.53 s) times after a blink. (a) “Backgrounds” graded as “sea”=1, “irregular”=0. Numbers in parentheses are the number of sea grades observed in 50 images. (b) Grades of density and size of “droplets” on a scale of 0 (absent or rare) to 4 (dense).
The other characteristic evaluated was the prevalence (number and size) of “droplets” present, on a scale of 0 (absent or rare) to 4 (dense). The observer was provided with an example for each grade; Figure R(a) would probably have been rated Grade 0, Figure R(b) as 1, Figure Z as 3 and Figure N as 4. Results of this analysis are in Figure j(b). It is seen that droplet density tends to be low just after a blink; only one image was rated in Grades 3 or 4 in the short delay period, compared to 10 and 5 respectively in the medium and long delay periods. Grades for the short delay were significantly lower than for both the medium and long delays (P<0.0001 for both, Mann-Whitney test) but there was no significant difference between medium and long delays. Within the first 0.08 seconds after a blink, droplet grades did not exceed one; within the “short” interval of Figure j(b), there was a significant correlation between droplet grade and time after a blink (Spearman correlation, R=0.47, P=0.001).
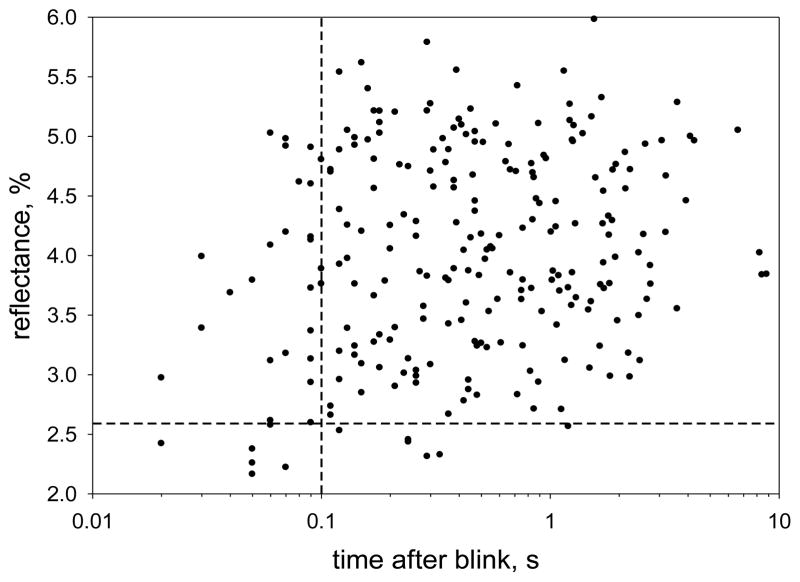
There is an increased probability of low reflectance images immediately after a blink. Because the imaging beam may be obstructed by eye lashes, particularly just after a blink, the reflectance values included a correction for any “lash obstruction fraction” – see methods. In an analysis of 5526 images, 7 out of 35 (20%) recorded at less than 0.1 seconds after a blink had a mean reflectance of less than 2.58%, implying a thickness of less than 21 nm (see Figure F); for all longer delays, only 1.4% of images had reflectance less than 2.58%. For statistical analysis, independent samples were obtained by selecting the image with the shortest delay for each of 243 subjects. The results are plotted in Figure l, where dashed lines correspond to 0.1 seconds and 2.58% reflectance. In this case, 6 out of 29 images (20.7%) recorded at less than 0.1 seconds after a blink had a mean reflectance of less than 2.58%, whereas only 5 out of 214 (2.3%) recorded at longer delays had such a low reflectance; the probability of this low reflectance (thin lipid) was significantly greater for the short delay range (P<0.002, Fisher Exact Test).
Figure l.
Mean reflectance of the lipid layer as a function of time after a blink. The image with the shortest delay after a blink was selected for 243 subjects. Dashed lines correspond to 0.1 seconds after a blink and 2.58% reflectance (see text for analysis).
DISCUSSION
The blink cycle and lipid layer structure
The dynamics and structure of the lipid layer involves three processes. First, lipid is delivered from the meibomian glands to the pre-ocular lipid layer. This is thought to be a two stage process with secretion of lipid to a reservoir on the lid margin followed by transfer to the lipid layer.[38] However, it may also involve direct secretion from the glands to the lipid layer.[39] Second, restructuring of the lipid layer can occur after delivery, as observed in Figures T, V, a and d. Third, lipid is removed from the pre-ocular tear film, e.g., by deposition on the eyelid margins and lashes.[40]
These three processes can be related to the following three phases of the blink cycle. The “inter-blink phase” will be defined as the period after the upper lid comes to rest after one blink and before the down-stroke of the next blink. It may be considered to have two sub-phases – an upward drift of the lipid layer for about the first 2 seconds after a blink followed by a (roughly) stationary period.[11, 41–42] In this study, restructuring of the lipid layer did not differ obviously between these two sub-phases, e.g., change in island shape could occur just after a blink during the upward drift (Figure T) or considerably later during the stable period (Figure V). However, as discussed later, the upward drift may make some contribution to observed changes in lipid structure with time after a blink (e.g., Figures j and l). The second, “compressive phase” (downstroke) of the blink cycle can cause, in the case of a full blink, a great reduction in lipid layer area and corresponding increase in lipid thickness.[43] Finally, the “upstroke” phase of the blink is responsible for the deposition of the pre-ocular tear film[44] together with a renewed lipid layer.
This study provides insights into the contribution of the inter-blink phase to the restructuring of the lipid layer. Considerable changes were observed for “islands” and “lenses” within a dark “sea”. Thus, in Figure T, it is seen that a C-shaped island is transformed into a circular lens. This is reminiscent of studies showing that hydrophobic oils on water do not spread but form similar lenses.[36] The superficial film will retract to form lenses if the “spreading coefficient” S= γw−(γf+γfw) is negative, where γw, γf and γfw are, respectively, the surface tension of water and the oil film and the interfacial tension between the film and water; conversely, if the spreading coefficient is positive the film will spread to cover the water surface. Thus the formation of lenses in Figures T and V indicates that the spreading coefficient of the lipid layer is negative in these cases. In Figure V, projections from islands are seen to retract – again this indicates that the spreading coefficient is negative. A likely explanation for a negative spreading coefficient in these examples is an unusually large interfacial tension, γfw, (as in the case of a hydrophobic oil on water),[36] perhaps due to a lack of normal surfactant molecules (e.g., polar lipids),[45] at the interface.
Whereas the inter-blink phase is evidently important in the structure of islands and the formation of lenses (Figures T and V) it does not seem to play a detectable role in the structure and formation of droplets (Figure Z). This implies that the origin of droplets is not associated with the inter-blink phase, but may be associated either with the compressive or upstroke phases of the blink cycle, or else with the process of lipid delivery from meibomian glands to the lipid layer. It is not obvious how either the compressive or upstroke phase of the blink could generate droplets. However, droplets could be associated with delivery from the meibomian glands to the lipid layer, if they correspond to the “fat droplets” which have been described in meibomian acinar cells.[46] It is suggested that these fat droplets may be delivered intact to the lipid layer where they become the droplets seen in Figures N, R(b), Z, a, d and h. This would imply that the lipid secretion from the meibomian glands can be in the form of an emulsion of these fat droplets.
In contrast to the stability of droplets and irregular background in Figure Z during the inter-blink phase, the dark “dots” in Figure d appear to expand over time. However in other recordings such as Figure f, there was no apparent increase in the size of dots (perhaps indicating that the physical characteristics of those dots differ from those in Figure d).
Restructuring of the lipid layer structure caused by the “compressive phase” of a partial blink is shown in Figure a. After the blink, the toe of the boot-shaped droplet had been distorted and the lipid layer had been compressed along the vertical dimension. It seems likely that the large compression of the lipid layer from a full blink[43] would cause considerably greater restructuring.
The “upstroke” phase of the blink is associated with a number of altered lipid layer characteristics. For a period of about 0.1 seconds after the blink, there is an increased probability of a “sea” rather than an “irregular” background – Figure j(a). Additionally, Figure j(b) shows that droplets are less common in this period. Figure l shows that there is an increased chance of a thin lipid layer in this period. Figure X gives examples of “snowflakes” and “clouds” which seem to be more common in this than in later periods. A common factor in all these observations may be reduction in the quantity of lipid, including polar lipid. During the upstroke phase, lipid may be transferred from the upper meniscus to the pre-corneal lipid layer more rapidly than it can be replenished in the upper meniscus, leading to lipid depletion over both the meniscus and tear film as the upper lid ascends.[37, 47–48] A reduction in total lipid may cause the reduced occurrence of droplets, whereas a reduction in polar lipids may cause retraction of the lipid (somewhat similar to Figures T and V) exposing a “sea” background. Surface tension is inversely related to surfactant concentration.[41] The relative lack of lipid (probably including polar lipid) in Figure X may be expected to cause relatively high surface tension;[41] this high surface tension will tend to pull in neighboring areas of surface, increasing lipid and polar lipid density so that the lipid layer spreads over the surface and fills in the sea background – as observed in Figure j(a).
It should be noted that the changes after a blink discussed above may have some contribution from the upward drift of the tear film; the lipid layer observed at a certain time after a blink will have travelled upwards since the time the tear film was deposited, and the deposited lipid thickness may have been greater at that earlier time. For example, for an upward drift velocity of about 7 mm/s,[42] the lipid layer observed 0.1 second after a blink would have been deposited 0.7 mm below the location of the image.
Relation to surface physical chemistry
It has already been noted that the “islands” and “lenses” seen against dark “seas” in Figures T and V may be caused by negative spreading pressures in these lipid films, perhaps related to a lack of surfactant. Films with negative spreading pressure can undergo a process of “dewetting”.[49–50] In that process, an initially continuous film develops small circular holes, which expand until the ridges between them rupture to form larger irregular holes; further rupture of the ridges leads to isolated irregular patches of film which eventually form circular patches.[50–51] Figures T, V and b show similar structures, as follows. A small circular “lake” (hole) is seen on the right of Figure V(b), larger, irregular lakes are seen in Figure b, and the transformation from an “island” (irregular patch) to a “lens” (circular patch) is shown in the C-shaped object of Figure T. Dewetting is characterized by a narrow, relatively thick ridge at the edge of a retracting film.[52] Correspondingly, islands and lakes in Figures V and b are surrounded by ridges indicated by narrow, light bands. In conclusion, many aspects of Figures T, V and b can be related to a process of dewetting related to negative spreading pressure in the lipid islands and lenses.
The dark “dots” in Figures d may correspond to the initial process of dewetting – this suggestion is supported by the expansion of the dots during the inter-blink interval and the observation of lighter regions (ridges) surrounding the dots in Figure d(b), somewhat similar to the light bands in Figure V. However, another possibility should be considered – namely that the dots have similarities to lipid “domains” which are observed in monolayers.[53–55] Domains are localized regions whose composition or structure differs from surrounding lipid.[53–54] Although the lipid layer is typically thicker than a monolayer, it is possible that the polar sub-layer[45] may show localized regions similar to domains; for example, if there is insufficient quantity of the usual polar lipids in this sub-layer, other lipids may be substituted to complete the sub-layer and these may form localized regions similar to monolayer domains. If so, perhaps these substituted lipids do not readily support overlying non-polar lipids which are therefore displaced centrifugally, leading to the observed thin dark dots, surrounded by a thicker ridge, as in Figures d(b) and f(a). The flower-shaped dots in Figure f(a) may be related to flower-shaped domains observed in monolayers.[56] These shapes are thought to derive from an equilibrium between the effects of repulsive electrostatic forces between lipid molecules and a “line tension” which tends to minimize the domain perimeter.[53] Clustering of dots in Figure f(b) occurs when the lipid background is relatively dark (thin) perhaps because there is insufficient polar lipid to form a continuous interface with the aqueous layer, requiring substitution of other lipids, as suggested above.
The stability of the droplets and irregular background in Figure Z indicates that these structures have a gel-like structure which is resistant to deformation forces.[57] If the lipid layer were fluid, surface tension and interfacial tension with the aqueous layer would generate high pressure within the droplets, which would generate centrifugal flow of lipid, causing thinning and flattening. The surface roughness of the large droplet in Figure N is consistent with the suggestion of gel-like structure – if the droplet were fluid, surface tension forces would be expected to smooth this surface. It should be noted that the lipid layer does not act like a rigid solid; if the lower lid is displaced upward, the whole lipid layer appears to compress like an elastic membrane with reducing movement toward the upper lid.[58] An important characteristic of the lipid layer is the reversibility of the compression-expansion cycle of the blink;[59] a solid lipid layer such as cholesteryl myristate, will not expand to its original structure after a compression.[55]
In conclusion, it is expected that high resolution microscopy of the lipid layer will provide information about the mechanisms of dry eye disorders. It may be noted that the striking abnormalities of the lipid layer involving islands, lenses and lakes in Figures T, V and b were for dry eye patients; lipid abnormalities similar to lenses have been described in Sjogren’s Syndrome.[27] We propose that these abnormalities are cause by a negative spreading pressure of the lipid layer, perhaps due to a lack of surfactants such as polar lipid. The snowflakes and clouds in Figure X also corresponded to dry eye patients. The dark dots in Figures d and h were from dry eye patients, but those for the two subjects in Figure f were from normals. A more systematic analysis of the relation of high resolution lipid micrographs and dry eye signs and symptoms is planned.
Appendix – Effect of surface distortion together with defocus
Whereas lipid thickness is the main factor contributing to lipid layer reflectance, another factor controlling response of some pixels is the combined effect of local distortion of the lipid layer surface together with defocus. This is illustrated in Figure H which shows a convexity on the lipid surface. The black dot gives a point in the focal plane of the objective which in this case is behind the lipid surface. The cone of light reflected from this convexity is shown by the thin rays, and is determined by the incident cone of illumination given by the thick rays (as noted previously, the numerical aperture of the incident beam is 0.5 and so is less than the numerical aperture of the objective, 0.6). It is seen that the reflected cone of light has a greater cone angle than the incident cone and so this point in the image will therefore appear brighter. Correspondingly, the image would appear dimmer if the objective is focused in front of the concavity of the lipid layer. Examples of this effect of focus are given in Figure N. A severe distortion of the lipid surface may deflect the reflected beam so much that some of it does not enter the objective, again causing dimming of the corresponding image point.
Contributor Information
P. Ewen King-Smith, College of Optometry, The Ohio State University, Columbus, OH 43210.
Jason J. Nichols, College of Optometry, The Ohio State University, Columbus, OH 43210.
R. J. Braun, Department of Mathematical Sciences, University of Delaware, Newark, DE 19716
Kelly K. Nichols, College of Optometry, The Ohio State University, Columbus, OH 43210.
References
- 1.Lemp MA, et al. The definition and classification of dry eye disease: Report of the Definition and Classification Subcommittee of the International Dry Eye WorkShop (2007) Ocul Surf. 2007;5(2):75–92. doi: 10.1016/s1542-0124(12)70081-2. [DOI] [PubMed] [Google Scholar]
- 2.Levin MH, Verkman AS. Aquaporin-dependent water permeation at the mouse ocular surface: in vivo microfluorimetric measurements in cornea and conjunctiva. Invest Ophthalmol Vis Sci. 2004;45(12):4423–32. doi: 10.1167/iovs.04-0816. [DOI] [PubMed] [Google Scholar]
- 3.Bron AJ, et al. Predicted phenotypes of dry eye: proposed consequences of its natural history. Ocul Surf. 2009;7(2):78–92. doi: 10.1016/s1542-0124(12)70299-9. [DOI] [PubMed] [Google Scholar]
- 4.Sullivan BD, et al. An objective approach to dry eye disease severity. Invest Ophthalmol Vis Sci. 2010;51(12):6125–30. doi: 10.1167/iovs.10-5390. [DOI] [PubMed] [Google Scholar]
- 5.Liu H, et al. A link between tear instability and hyperosmolarity in dry eye. Invest Ophthalmol Vis Sci. 2009;50(8):3671–9. doi: 10.1167/iovs.08-2689. [DOI] [PubMed] [Google Scholar]
- 6.Luo L, et al. Hyperosmolar saline is a proinflammatory stress on the mouse ocular surface. Eye Contact Lens. 2005;31(5):186–93. doi: 10.1097/01.icl.0000162759.79740.46. [DOI] [PubMed] [Google Scholar]
- 7.Bron AJ, et al. Using osmolarity to diagnose dry eye: a compartmental hypothesis and review of our assumptions. Adv Exp Med Biol. 2002;506(Pt B):1087–95. doi: 10.1007/978-1-4615-0717-8_153. [DOI] [PubMed] [Google Scholar]
- 8.King-Smith PE, et al. Contributions of evaporation and other mechanisms to tear film thinning and breakup: a review. Optom Vis Sci. 2008;85:623–30. doi: 10.1097/OPX.0b013e318181ae60. [DOI] [PubMed] [Google Scholar]
- 9.Nichols JJ, Mitchell GL, King-Smith PE. Thinning rate of the precorneal and prelens tear films. Invest Ophthalmol Vis Sci. 2005;46(7):2353–61. doi: 10.1167/iovs.05-0094. [DOI] [PubMed] [Google Scholar]
- 10.Kimball SH, King-Smith PE, Nichols JJ. Evidence for the major contribution of evaporation to tear film thinning between blinks. Invest Ophthalmol Vis Sci. 2010;51(12):6294–7. doi: 10.1167/iovs.09-4772. [DOI] [PMC free article] [PubMed] [Google Scholar]
- 11.King-Smith PE, et al. The contribution of lipid layer movement to tear film thinning and breakup. Invest Ophthalmol Vis Sci. 2009;50(6):2747–56. doi: 10.1167/iovs.08-2459. [DOI] [PubMed] [Google Scholar]
- 12.Mathers W. Evaporation from the ocular surface. Exp Eye Res. 2004;78(3):389–94. doi: 10.1016/s0014-4835(03)00199-4. [DOI] [PubMed] [Google Scholar]
- 13.Tomlinson A, Doane MG, McFadyen A. Inputs and outputs of the lacrimal system: review of production and evaporative loss. The Ocular Surface. 2009;7(4):17–29. doi: 10.1016/s1542-0124(12)70186-6. [DOI] [PubMed] [Google Scholar]
- 14.Mishima S, Maurice DM. The oily layer of the tear film and evaporation from the corneal surface. Exp Eye Res. 1961;1:39–45. doi: 10.1016/s0014-4835(61)80006-7. [DOI] [PubMed] [Google Scholar]
- 15.Craig JP, Tomlinson A. Importance of the lipid layer in human tear film stability and evaporation. Optom Vis Sci. 1997;74(1):8–13. doi: 10.1097/00006324-199701000-00014. [DOI] [PubMed] [Google Scholar]
- 16.Mathers WD, Lane JA. Meibomian gland lipids, evaporation, and tear film stability. Adv Exp Med Biol. 1998;438:349–60. doi: 10.1007/978-1-4615-5359-5_50. [DOI] [PubMed] [Google Scholar]
- 17.King-Smith PE, Hinel EA, Nichols JJ. Application of a novel interferometric method to investigate the relation between lipid layer thickness and tear film thinning. Invest Ophthalmol Vis Sci. 2010;51(5):2418–2423. doi: 10.1167/iovs.09-4387. [DOI] [PMC free article] [PubMed] [Google Scholar]
- 18.Doane MG. An instrument for in vivo tear film interferometry. Optom Vis Sci. 1989;66(6):383–8. doi: 10.1097/00006324-198906000-00008. [DOI] [PubMed] [Google Scholar]
- 19.Goto E, Tseng SC. Kinetic analysis of tear interference images in aqueous tear deficiency dry eye before and after punctal occlusion. Invest Ophthalmol Vis Sci. 2003;44(5):1897–905. doi: 10.1167/iovs.02-0818. [DOI] [PubMed] [Google Scholar]
- 20.Guillon JP. Tear film structure and contact lenses. In: Holly FJ, editor. The preocular tear film in health, disease and contact lens wear. Dry Eye Institute; Lubbock, TX: 1986. pp. 914–939. [Google Scholar]
- 21.Korb DR, et al. Tear film lipid layer thickness as a function of blinking. Cornea. 1994;13(4):354–9. doi: 10.1097/00003226-199407000-00012. [DOI] [PubMed] [Google Scholar]
- 22.Yokoi N, Komuro A. Non-invasive methods of assessing the tear film. Exp Eye Res. 2004;78(3):399–407. doi: 10.1016/j.exer.2003.09.020. [DOI] [PubMed] [Google Scholar]
- 23.Forst G. Observation of two structures of the tear film lipid layer. Ophthalmic Physiol Opt. 1988;8(2):190–2. doi: 10.1111/j.1475-1313.1988.tb01036.x. [DOI] [PubMed] [Google Scholar]
- 24.Hamano H, Kawabe H, Mitsunaga S. Even field microscope for observation of the eye. Contact Intraocul Lens Med J. 1982;8(2):81–6. [PubMed] [Google Scholar]
- 25.Kilp H, et al. Tear film observation by reflecting microscopy and differential interference contrast microscopy. In: Holly FJ, editor. The preocular tear film in health, disease and contact lens wear. Dry Eye Institute; Lubbock, TX: 1986. pp. 564–569. [Google Scholar]
- 26.Josephson JE. Appearance of the preocular tear film. Am J Optom Physiol Opt. 1983;60:883–887. [Google Scholar]
- 27.Danjo Y, Hamano T. Observation of precorneal tear film in patients with Sjogren’s syndrome. Acta Ophthalmol Scand. 1995;73(6):501–5. doi: 10.1111/j.1600-0420.1995.tb00324.x. [DOI] [PubMed] [Google Scholar]
- 28.Mathers WD, Lane JA, Zimmerman MB. Assessment of the tear film with tandem scanning confocal microscopy. Cornea. 1997;16(2):162–8. [PubMed] [Google Scholar]
- 29.Torens S, et al. Imaging of the microarchitecture and dynamics of the break-up phenomena of the preocular tear film with the aid of laser scanning microscopy. Ophthalmologe. 2000;97(9):635–9. doi: 10.1007/s003470070053. [DOI] [PubMed] [Google Scholar]
- 30.ACGIH. Threshold Limit Values for chemical substances and physical agents and biological exposure indices. Cincinnati: 1995. p. 107. [Google Scholar]
- 31.Jenkins FA, White HE. Fundamentals of optics. 4. New York: McGraw-Hill; 1976. [Google Scholar]
- 32.King-Smith PE, Fink BA, Fogt N. Three interferometric methods for measuring the thickness of layers of the tear film. Optom Vis Sci. 1999;76(1):19–32. doi: 10.1097/00006324-199901000-00025. [DOI] [PubMed] [Google Scholar]
- 33.Tiffany JM. Refractive index of meibomian and other lipids. Curr Eye Res. 1986;5(11):887–9. doi: 10.3109/02713688609029242. [DOI] [PubMed] [Google Scholar]
- 34.Craig JP, et al. Refractive index and osmolality of human tears. Optom Vis Sci. 1995;72(10):718–24. doi: 10.1097/00006324-199510000-00004. [DOI] [PubMed] [Google Scholar]
- 35.Marr D. Early processing of visual information. Philos Trans R Soc Lond B Biol Sci. 1976;275(942):483–519. doi: 10.1098/rstb.1976.0090. [DOI] [PubMed] [Google Scholar]
- 36.Langmuir I. Oil lenses on water and the nature of monomolecular expanded films. J Chem Phys. 1933;1:756–776. [Google Scholar]
- 37.King-Smith PE, et al. The thickness of the tear film. Curr Eye Res. 2004;29(4–5):357–68. doi: 10.1080/02713680490516099. [DOI] [PubMed] [Google Scholar]
- 38.Knop E, Knop N, Schirra F. Meibomian glands. Part II: physiology, characteristics, distribution and function of meibomian oil. Ophthalmologe. 2009;106(10):884–92. doi: 10.1007/s00347-009-2019-9. [DOI] [PubMed] [Google Scholar]
- 39.McDonald JE. Surface phenomena of tear films. Trans Am Ophthalmol Soc. 1968;66:905–39. [PMC free article] [PubMed] [Google Scholar]
- 40.Khanal S, Millar TJ. Nanoscale phase dynamics of the normal tear film. Nanomedicine. 2010;6(6):707–13. doi: 10.1016/j.nano.2010.06.002. [DOI] [PubMed] [Google Scholar]
- 41.Berger RE, Corrsin S. A surface tension gradient mechanism for driving the pre-corneal tear film after a blink. J Biomech. 1974;7(3):225–38. doi: 10.1016/0021-9290(74)90013-x. [DOI] [PubMed] [Google Scholar]
- 42.Owens H, Phillips JR. Tear spreading rates: post-blink. Adv Exp Med Biol. 2002;506(Pt B):1201–4. doi: 10.1007/978-1-4615-0717-8_170. [DOI] [PubMed] [Google Scholar]
- 43.Holly FJ. Physical chemistry of the normal and disordered tear film. Trans Ophthalmol Soc U K. 1985;104( Pt 4):374–80. [PubMed] [Google Scholar]
- 44.Wong H, Fatt I, Radke CJ. Deposition and Thinning of the Human Tear Film. J Colloid Interface Sci. 1996;184(1):44–51. doi: 10.1006/jcis.1996.0595. [DOI] [PubMed] [Google Scholar]
- 45.McCulley JP, Shine W. A compositional based model for the tear film lipid layer. Trans Am Ophthalmol Soc. 1997;95:79–88. discussion 88–93. [PMC free article] [PubMed] [Google Scholar]
- 46.Sirigu P, Shen RL, Pinto da Silva P. Human meibomian glands: the ultrastructure of acinar cells as viewed by thin section and freeze-fracture transmission electron microscopies. Invest Ophthalmol Vis Sci. 1992;33(7):2284–92. [PubMed] [Google Scholar]
- 47.Aydemir E, Breward CJ, Witelski TP. The Effect of Polar Lipids on Tear Film Dynamics. Bull Math Biol. 2010 doi: 10.1007/s11538-010-9555-y. [DOI] [PubMed] [Google Scholar]
- 48.Jones MB, et al. The effect of the lipid layer on tear film behaviour. Bull Math Biol. 2006;68(6):1355–81. doi: 10.1007/s11538-006-9105-9. [DOI] [PubMed] [Google Scholar]
- 49.Craster RV, Matar OK. Dynamics and stability of thin liquid films. Reviews of Modern Physics. 2009;81(3):1131–1198. [Google Scholar]
- 50.Reiter G. Unstable Thin Polymer-Films - Rupture and Dewetting Processes. Langmuir. 1993;9(5):1344–1351. [Google Scholar]
- 51.Sharma A. Breakup and dewetting of the corneal mucus layer. An update. Adv Exp Med Biol. 1998;438:273–80. doi: 10.1007/978-1-4615-5359-5_39. [DOI] [PubMed] [Google Scholar]
- 52.Seemann R, et al. Dynamics and structure formation in thin polymer melt films. Journal of Physics-Condensed Matter. 2005;17(9):S267–S290. [Google Scholar]
- 53.Mcconnell HM. Structures and Transitions in Lipid Monolayers at the Air-Water-Interface. Annual Review of Physical Chemistry. 1991;42:171–195. [Google Scholar]
- 54.Mudgil P, Torres M, Millar TJ. Adsorption of lysozyme to phospholipid and meibomian lipid monolayer films. Colloids Surf B Biointerfaces. 2006;48(2):128–37. doi: 10.1016/j.colsurfb.2006.01.017. [DOI] [PubMed] [Google Scholar]
- 55.Nishimura SY, et al. Effect of lysozyme adsorption on the interfacial rheology of DPPC and cholesteryl myristate films. Langmuir. 2008;24(20):11728–33. doi: 10.1021/la8016485. [DOI] [PubMed] [Google Scholar]
- 56.Karttunen M, et al. Lipid domain morphologies in phosphatidylcholine-ceramide monolayers. Langmuir. 2009;25(8):4595–600. doi: 10.1021/la803377s. [DOI] [PubMed] [Google Scholar]
- 57.Leiske DL, et al. The interfacial viscoelastic properties and structures of human and animal Meibomian lipids. Exp Eye Res. 2010;90(5):598–604. doi: 10.1016/j.exer.2010.02.004. [DOI] [PubMed] [Google Scholar]
- 58.Ehlers N. The Precorneal Film. Biomicroscopical, Histological and Chemical Investigations. Acta Ophthalmol Suppl. 1965;(SUPPL 81):1–134. [PubMed] [Google Scholar]
- 59.Bron AJ, et al. Functional aspects of the tear film lipid layer. Exp Eye Res. 2004;78:367–370. doi: 10.1016/j.exer.2003.09.019. [DOI] [PubMed] [Google Scholar]


