Abstract
Accumulation of extracellular matrix (ECM) in glomerular mesangium correlates with loss of renal function in diabetic nephropathy. However, the mechanisms underlying are still incompletely known. In the present study, we explored the role of caveolae in ECM production in rat mesangial cells (MCs) stimulated by high glucose or transforming growth factor-β1 (TGF-β1), and investigated the possible mechanisms. High glucose (HG) or TGF-β1 significantly increased collagen-1 and fibronectin expression at both mRNA and protein levels in time- course dependent manners, and simultaneously induced caveolin-1 tyrosine phosphorylation. Disruption of caveolae with Methyl-β-cyclodextrin (β-MCD) prevented HG and TGF-β1 induced caveolin-1 tyrosine phosphorylation, and attenuated fibronectin but not collagen-1 production. This effect of β-MCD on fibronectin production could be abolished by cholesterol, which restored HG and TGF-β1 induced caveolin-1 tyrosine phosphorylation. In addition, HG and TGF-β1 induced fibronectin production was attenuated by a caveolin-1 scaffold domain peptide. These findings indicate that mesangial cell caveolae regulate fibronectin production at least partly through caveolin-1 phosphorylation.
Keywords: Caveolae, mesangial cells, high glucose, TGF-β1, fibronectin
Introduction
Diabetic nephropathy (DN) is a severe microvascular complication of diabetes and the leading cause of end-stage renal disease (ESRD) [1]. A typical morphological alteration in diabetic kidney is the accumulation of extracellular matrix (ECM) in glomeruli that correlates with the loss of renal function [2]. The most common matrix proteins detected include collagen I, III, IV and fibronectin [3]. Under diabetic condition, the synthesis of these proteins is upregulated in mesangial cells (MCs), which ultimately leads to glomerulosclerosis [4].
Hyperglycemia is the primary pathogenic factor for diabetic nephropathy. So far, multiple mechanisms have been proposed for high glucose induced renal injury, including activation of various vasoactive hormone pathways like the renin-angiotensin system and endothelins [5], induction of oxidative stress [6], and production of advanced glycation end products (AGEs) [7]. Of note, in vitro studies showed that high glucose could increase the synthesis of certain extracellular matrix (ECM) components in mesangial cells through induction of transforming growth factor-β1 (TGF-β1) and TGF-β type II receptor expression [8,9].
(TGF-β1) is a critical regulator of ECM that has been implicated in fibrogenesis of various tissues including the kidney [10,11] In human and experimental diabetic nephropathy, the expression of transforming growth factor beta is elevated [12]. Disruption of TGF-β1 signaling significantly attenuated glomerular mesangial matrix expansion in diabetic animal models [13]. All the above studies indicate that both hyperglycemia and TGF-β are involved in ECM accumulation in the mesangium in diabetic nephropathy. Revealing the signaling networks that mediate hyperglycemia and TGF-β-induced ECM overproduction may provide novel targets for the prevention and treatment of DN.
Caveolae are flask-shaped, cholesterol-enriched plasma membrane invaginations in a variety of cell types. As caveolae are highly enriched in cholesterol, agents such as β-methyl-cyclodextrin (β-MCD), which bind and sequester membrane cholesterol, can be used to disrupt caveolae to study the function of these microdomains. Caveolin-1 is the principle structural protein of caveolae, and plays an essential role in the formation of caveolae [14]. In addition, as a scaffolding protein, caveolin-1 can interact with multiple signaling molecules, including receptor tyrosine kinases, non-receptor tyrosine kinases and G-proteins. Through these interactions, caveolin-1 sequesters these proteins within caveolae and modulates their activity [15]. In response to various stimuli including oxidative stress and TGF-β1 [16,17], caveolin-1 can be phosphorylated at tyrosine-14 by the Src family kinases. Although the functional significance of tyrosine phosphorylation on caveolin-1 is unclear, some studies showed that it might have regulatory effects on interactions between caveolin-1 and other proteins [18,19]. In an idiopathic pulmonary fibrosis mouse model, overexpression of caveolin-1 markedly ameliorated bleomycin (BLM)-induced pulmonary fibrosis [11]. In mesangial cells, caveolae were shown to be required for TGF-β-induced fibronectin production [20].
In the present study, we aimed to further investigate the role of caveolae of mesangial cells in the pathogenesis of diabetic nephropathy, and to explore the possible mechanisms.
Materials and methods
Materials
Rabbit polyclonal anti-caveolin-1 was purchased form BD Transduction Laboratories (Lexingten, KY, USA). Anti-phospho-caveolin-1 (Y14) was from Cell Signaling Technology (Danvers, USA). Anti-collagen-1 was from Abcam (MA, USA). Horse radish peroxidease (HRP)-conjugated goat anti-mouse and anti-rabbit secondary antibodies were from ZSGB-Bio (Beijing, China). Recombinant Human TGF-β1 was purchased from Pepro Tech (New Jersey, USA). Methyl-b-cyclodextrin (b-MCD) was from Sigma (St. Louis, MO, USA). All other materials were purchased from standard suppliers.
Caveolin-1 scaffold domain peptide
The caveolin-1 scaffolding domain peptide corresponding to amino acids (CSD peptide, amino acids 82-101, DGIWKASFTTFTVTKYWFYR) with an additional Antennapedia internalization sequence (RQIKIWFQNRRMKWKK) was synthesized by SBS Biotech (Beijing, China). A cav-1 scrambled control peptide (CSC, WGIDKAFFTTSTVTYKWFRY) with an Antennapedia internalization sequence (RQIKIWFQNRRMKWKK) was synthesized for control. The cells were incubated with the peptides for 30 min before treatment with high glucose or TGF-β1.
Cell culture
Rat mesangial cells were cultured in Dulbecco’s Modified Eagle’s Medium (DMEM) containing 5.5 mmol/L glucose, 10% fetal calf serum at 37°C in 5% CO2, and passaged by trypisinization. For experiments, cells were passaged 1:5 by trypsinization and allowed to grow overnight before being made quiescent by serum deprivation for 24 h. The resultant sub-confluent (70-80%) cultures were treated as indicated. To examine the effects of hyperglycemia and TGF-β1 on ECM production, MCs were treated with D-glucose (30 mmol/L) or TGF-β1 (10 ng/ml, Peprotech) for the indicated time periods. Mannitol (24.5 mmol/L) was used for osmotic control. To examine the effects of β-MCD, cells were pretreated with 5 mmol/L β-MCD for 1 h in the presence or absence of cholesterol.
Real time RT-PCR
Total RNA was extracted using TRIZOl Reagent according to the manufacturer’s procedures (Takara Bio, Otsu, Shiga, Japan). The first strand cDNAs served as the template for quantitative PCR performed in eppendorf Real Time PCR System (Eppendorf Mastercycler ep realplex, Germany) using SYBR green PCR reagent (Takara Bio, Otsu, Shiga, Japan). qPCR was conducted according to the instructions of Takara SYBR Premix Taq TMII under the following conditions: pre- DNA denaturation at 95°C for 30 seconds; the amplification was carried out for 40 cycles with conditions of 5 seconds denaturation at 95°C and annealing for 34 seconds at temperatures: 58°C for Cav-1, 59°C for Col-1 or FN, and 60°C for GAPDH. All experiments were performed in triplicate. The results were expressed as the OD ratio relative to GAPDH. Primers used in the experiments were shown in Table 1.
Table 1.
Primer sequences used for RT-PCR
| Primer | Sequence (forward primer/reverse primer) |
|---|---|
| Cav-1 | 5’-CGGGAACAGGGCAACATCTAC-3’ |
| 5’-CTTCTGGTTCCGCAATCACATC-3’ | |
| Col-1 | 5’-GACATGTTCAGCTTTGTGGACCTC-3’ |
| 5’-GGGACCCTTAGGCCATTGTGTA-3’ | |
| FN | 5’-TGACTCGCTTTGACTTCACCAC-3’ |
| 5’-CATCTCCTTCCTCGCTCAGTTC-3’ | |
| GAPDH | 5’-GGCACAGTCAAGGCTGAGAATG-3’ |
| 5’-ATGGTGGTGAAGACGCCAGTA-3’ |
Western blot analysis
Samples were homogenized in RIPA (Radio-Immunoprecipitation Assay) lysis buffer containing protease and phosphatase inhibitors. Protein concentration was determined by a bicinchoninic acid (BCA) method (Pierce, IL, USA). Proteins (80 μg from each sample) were resolved on SDS-PAGE gels and transferred to a NC membrane (nitrocellulose membrane). Subsequently, the membrane was blocked in 5% non fat milk for 1 hour and incubated with primary antibodies overnight at 4°C with gentle agitation, followed by incubation with the HRP-conjugated anti-rabbit or anti-mouse secondary antibody (1:5000 dilution) for 1 hour at room temperature. After washing with PBS, immune complexes were detected using enhanced chemiluminescence (ECL) method. The relative intensity was determined with the Image J software. Primary antibodies used are as follows: Polyclonal anti-caveolin-1 (1:2000, BD), polyclonal anti-p-cavelin-1y14 (1:1000, CST), anti-type I Collagen-α1 chain (1:1000, Abeam), anti-β-actin (1:1000, ZSGQ).
Enzyme-linked immunosorbent assay
5,000 mesangial cells/well seeded in a 96-well plate, and treated for the indicated time. The supernatant was collected at each time point. Fibronectin concentration was determined using ELISA kit according to the manufacturers’ instructions. Absorbance values were measured with a microplate reader (Bio-Rad iMark, Richmond, CA, USA) at a wavelength of 450 nm, and translated into a protein concentration in accordance with the standard curve.
Statistical analysis
All data were presented as mean ± SEM, and analyzed with one-way analysis of variance (ANOVA) followed by Newman-Keuls test. All analyses were performed using SPSS 17.0. A value of P < 0.05 was considered statistically significant.
Results
Effects of high glucose and TGF-β1 on fibronectin, collagen-1 and caveolin-1 mRNA expression
MC cells were treated with high glucose (HG) (30 mmol/l) or TGF-β1 (10ng/ml) for the indicated periods. At each time point, the mRNA levels of caveolin-1 (Cav-1), fibronectin (FN) and collagen-1 (Col-1) were determined by real time RT-PCR. As shown in Figure 1, both HG and TGF-β1 significantly increased Col-1 and FN mRNA expression as early as 12 h after treatments, and reached peak at 24 h. Cav-1 mRNA expression was not changed.
Figure 1.
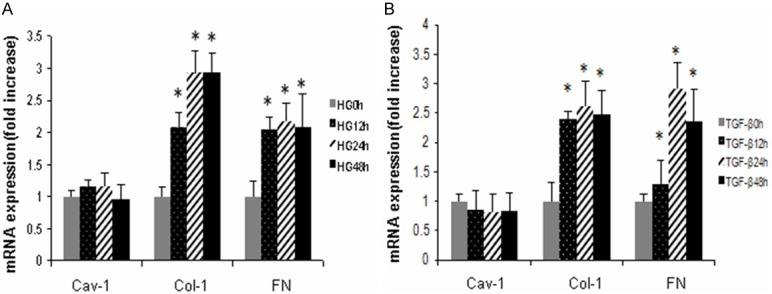
Effects of HG/TGF-β1 on caveolin-1, collagen-1 and fibronectin mRNA expression. MCs cells were treated with HG (30 mmol/L) or TGF-β1 (10 ng/ml) 0, 12, 24 or 48 h. Caveolin-1, collagen-1 and fibronectin mRNA expression was determined by real time RT-PRC (A) HG induced caveolin-1, collagen-1 and fibronectin mRNA expression (n = 3). (B) TGF-β1 induced caveolin-1, collagen-1 and fibronectin mRNA expression (n = 3). *P < 0.05, vs. 0 h.
Effects of HG and TGF-β1 on fibronectin, collagen-1 protein expression
Next, we determined the effects of HG and TGF-β1 on FN, and Col-1 protein expression. MC cells were treated with HG (30 mmol/l) or TGF-β1 (10 ng/ml) as described above. Col-1 protein level was determined by Western blotting; FN concentration was determined by ELISA. As shown in Figure 2, HG significantly increased Col-1 protein expression at 24 h and FN protein expression at 12 h; TGF-β1 significantly increased both Col-1 and FN protein expression as early as 12 h (Figure 2).
Figure 2.
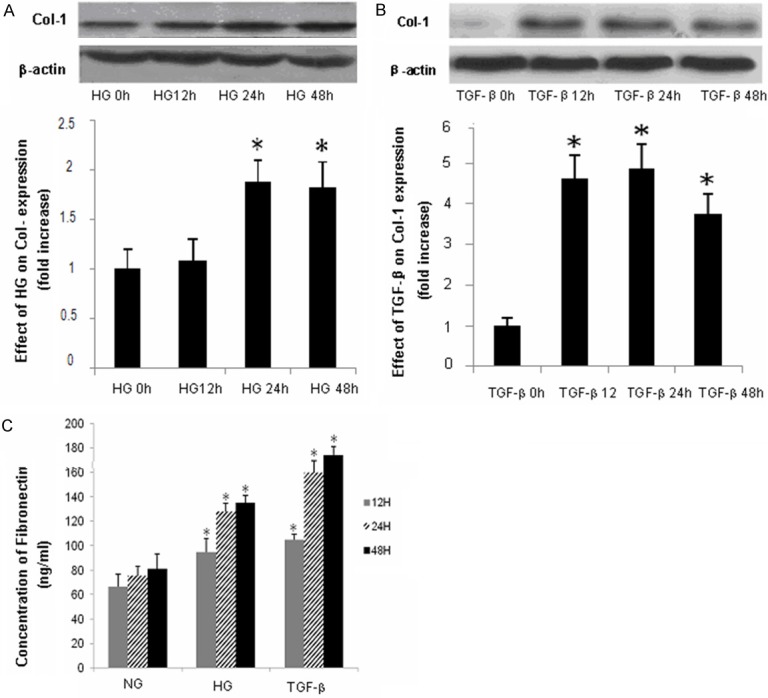
Effects of HG/TGF-β1 on collagen-1 and Fibronectin protein expression. MCs cells were treated with HG (30 mmol/L) or TGF-β1 (10 ng/ml) 0, 12, 24 or 48 h. Collagen-1 protein expression was determined by Western blotting; fibronectin level was determined by ELISA. (A, B) Representative results of Western Blots for collagen-1 (n = 3), (C) Quantitative analysis of fibronectin expression (n = 3). *P < 0.05, vs. controls.
Effects of HG and TGF-β1 on caveolin-1 tyrosine phosphorylation
To explore a possible role of caveolin-1 in ECM production, we determined the effects of HG and TGF-β1 on caveolin-1 expression and tyrosine phosphorylation. MC cells were treated with HG (30 mmol/l) or TGF-β1 (10 ng/ml) for the indicated periods. Caveolin-1 expression and phosphorylation were evaluated by Western blotting. As shown in Figure 3, HG treatment significantly induced cav-1 tyrosine phosphorylation as early as 1 h, which peaked at 1.5 h; TGF-β1 significantly induced cav-1 tyrosine phosphorylation at 1 h, which lasted up to 2.5 h.
Figure 3.
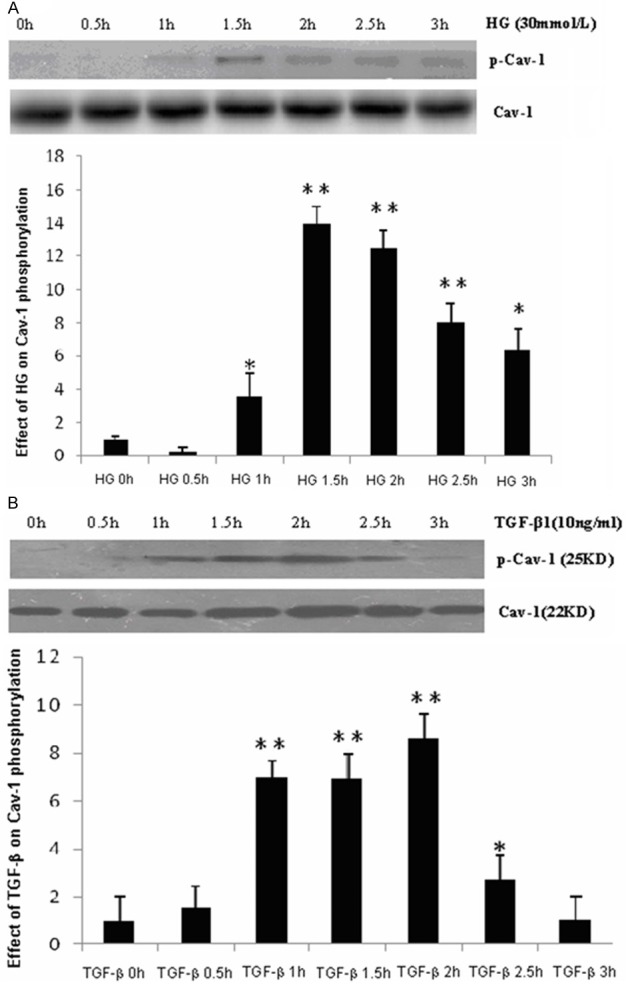
Effects of HG/TGF-β1 on caveolin-1 tyrosine phosphorylation (Y-14). MCs were serum starved for 6 h and subsequently treated with HG or TGF-β1 for indicated time periods. A. HG induced for caveolin-1 phosphorylation (n = 3). B. TGF-β1 induced caveolin-1 phosphorylation (n = 3). Results of quantitative analyses are presented in the corresponding lower panels. *P < 0.05, vs. 0 h; **P < 0.01, vs. 0 h.
Effects of β-MCD on HG- and TGF-β1 induced caveolin-1 tyrosine phosphorylation
β-MCD is a cholesterol-sequestering agent, which is able to disrupt the structure of caveolae, and is extensively used to study the function of these microdomains. Here we determined the effects of β-MCD on HG- and TGF-β1 induced Cav-1 tyrosine phosphorylation. MCs were pretreated with β-MCD (5 mmol/l) for 1 h, followed by HG (30 mmol/l)/or TGF-β1 (10 ng/ml) treatment for 2 h in the absence or presence of cholesterol (15 μg/ml). As shown in Figure 4, β-MCD pre-treatment significantly inhibited HG and TGF-β1 -induced Cav-1 tyrosine phosphorylation. This effect of β-MCD was abrogated by cholesterol.
Figure 4.
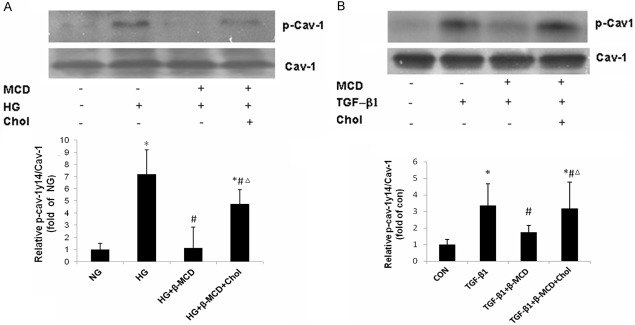
Effects of β-MCD on HG/TGF-β1 induced caveolin-1 tyrosine phosphorylation. MCs were pretreated with β-MCD (5 mmol/l), continued to be present during subsequent treatments) for 1 h, followed by HG (30 mmol/l) or TGF-β1 (10 ng/ml) treatment for 2 h in the absence or presence of cholesterol (15 μg/ml). A. Effect of β-MCD on HG induced caveolin-1 tyrosine phosphorylation (n = 3). B. Effects of β-MCD on TGF-β1 induced caveolin-1 tyrosine phosphorylation (n = 3). Results of quantitative analyses are presented in the corresponding lower panels. A. *P < 0.01, vs. NG; #P < 0.01, vs. HG; ΔP < 0.01, vs. HG + β-MCD. B. *P < 0.01, vs. CON; #P < 0.01, vs. TGF-β1; ΔP < 0.01, vs. TGF-β1 + β-MCD.
Effects of β-MCD on HG and TGF-β1 induced fibronectin, collagen-1 protein expression
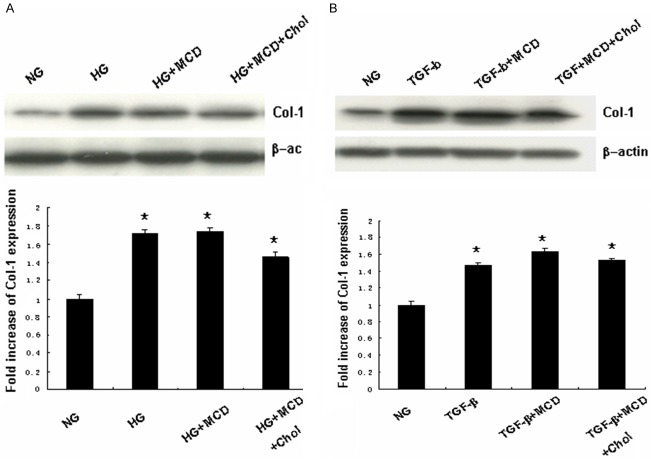
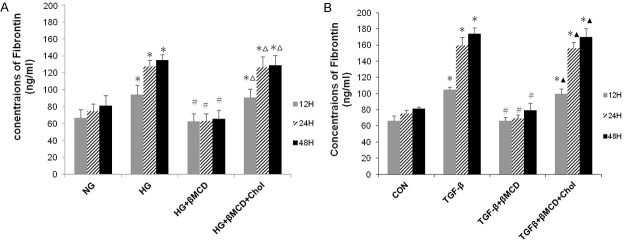
In subsequent experiments, we determined the effects of β-MCD on HG and TGF-β1 induced Col-1 and FN protein expression. MCs were left untreated or pre-treated with β-MCD (5 mmol/l) for 1 h, and then treated with HG (30 mmol/l) or TGF-β1 (10 ng/ml) in the absence or presence of cholesterol (15 μg/ml) for the indicated periods. Collagen-1 protein expression was determined by Western blotting. The supernatant was collected, and fibronectin concentration was determined by ELISA. As shown in Figures 5, 6, β-MCD pre-treatment significantly decreased HG and TGF-β1 induced FN production, but had no evident effect on HG and TGF-β1 induced Col-1 protein expression. The effect of β-MCD on FN production was abrogated by cholesterol.
Figure 5.
Effect of β-MCD on HG/TGF-β1 induced collagen-1 protein expression. MCs were left untreated or pre-treatmented with β-MCD (5 mmol/l), continued to be present during subsequent treatments) for 1 h, followed by HG (30 mmol/l) or TGF-β1 (10 ng/ml) for 48 h in the absence or presence of cholesterol (15 μg/ml). Collagen-1 protein expression was determined by Western blotting. A. Representative result of Western blots for collagen-1 protein expression induced by HG (n = 3). B. Representative result of Western blots for collagen-1 protein expression induced by TGF-β1 (n = 3). Results of quantitative analyses are presented in the corresponding lower panels. A. *P < 0.05, vs. NG. B. *P < 0.05, vs. controls.
Figure 6.
Effect of β-MCD on HG/ TGF-β1 induced fibronectin exression. MCs were left untreated or pre-treatmented with β-MCD (5 mmol/l) for 1 h, and then treated with HG (30 mmol/l) or TGF-β1 (10 ng/ml) in the absence or presence of cholesterol (15 μg/ml) for the indicated periods. The supernatant was collected, and fibronectin concentration was determined by ELISA. A. HG induced fibronectin exression (n = 3). B. TGF-β1-induced fibronectin expression (n = 3). A. *P < 0.01, vs. NG; #P < 0.01, vs. HG.; ΔP < 0.01, vs. HG. + β-MCD. B. *P < 0.01, vs. CON; #P < 0.01, vs. TGF-β1; ▲P < 0.01, vs. TGF-β1 + β-MCD.
HG and TGF-β1 induced fibronectin production was attenuated by a caveolin-1 scaffold domain peptide
To further confirm the role of caveolin-1 in HG and TGF-β1 induced fibronectin production, we treated the MC cells with a cell permeable caveolin-1 scaffold domain peptide (CSD peptide), which is supposed to compete with endogenous caveolin-1 for interacting with other proteins. As shown in Figure 7, CSD peptide significantly attenuated HG and TGF-β1 induced fibronectin production, whereas the control peptide had no effects.
Figure 7.

HG and TGF-β1 induced fibronectin production was attenuated by a caveolin-1 scaffold domain peptide. MCs were pre-treated with caveolin-1 scaffold domain peptide (CSD peptide, 5 uM) or control peptide (CSC peptide, 5 uM) for 30 min, and then treated with HG (30 mmol/l) or TGF-β1 (10 ng/ml) for 48 h. The supernatant was collected, and fibronectin concentration was determined by ELISA. (A) HG induced fibronectin production; (B) TGF-β1 induced fibronectin production. *P < 0.05, vs. control; **P < 0.01, vs. control. #P < 0.05, vs. control; ##P < 0.01, vs. control.
Discussion
In the present study, we demonstrated that both HG and TGF-β1 significantly increased collagen-1 and fibronectin protein and mRNA expression in rat mesangial cells in a time-course dependent manners. Along with these responses, HG and TGF-β1 induced caveolin-1 tyrosine phosphorylation. Disruption of caveolae prevented HG and TGF-β1 induced caveolin-1 tyrosine phosphorylation, and attenuated HG and TGF-β1 induced fibronectin production. In addition, HG and TGF-β1 induced fibronectin production was attenuated by a caveolin-1 scaffold domain peptide. These findings suggest that mesangial cell caveolae may play a role in fibronectin overproduction under diabetic conditions, which may contribute to the pathogenesis of diabetic nephropathy.
Hyperglycemia is the primary pathogenic factor for diabetic nephropathy. Hyperglycemia may induce renal injury through multiple mechanisms, including activation of renin-angiotensin system and endothelins, induction of oxidative stress, and production of AGEs [5-7]. In the present study, we demonstrated that high glucose directly upregulated collagen-1 and fibronectin expression in rat mesangial cells. In addition to hyperglycemia, many other factors such as TGF-β may also play important roles in the pathogenesis of diabetic nephropathy. In human and experimental diabetic nephropathy, the expression of TGF-β is elevated [12]. TGF- β1 is a well-known mediator in the initiation and progression of fibrosis [21]. In pulmonary fibroblasts, TGF-β1 was shown to induce collagen-1 and fibronectin overexpression [11]. In diabetic animal models, disruption of TGF-β signaling significantly attenuated glomerular mesangial matrix expansion [13]. In the present study, we demonstrated that TGF-β1 significantly increased collagen-1 and fibronectin expression in rat messantial cells in both mRNA and protein levels.
Caveolae are small flask-shaped invaginations of the plasma membrane that serve as platforms for multiple signaling processes [14]. Caveolin-1, a 21 to 24-kDa integral membrane protein, is a principal structural component of caveolae [15]. In the kidney of both human and rodents, caveolin-1 is most abundant in the muscle layer of blood vessels, parietal epithelial cells (PECs) and endothelial cells [22]. Renal mesangial cells have similar characteristics as vascular smooth muscle cells, which are rich in caveolae as well. There is evidence showing that platelet-derived growth factor (PDGF) receptor is localized in caveolae membrane in mesangial cells, and caveolin may play a role in the pathogenesis of the mesangial proliferative glomerular diseases through PDGF signaling [22]. So far, the role of mesangial cell caveolae in the pathogenesis of diabetic nephropathy has not been well documented. A recent study showed that caveolin-1 expression is reduced in the endothelial cells of renal blood vessels in streptozocin-induced diabetic rats, which may contribute to the development of diabetic nephropathy through inhibition of endothelial NO synthase (eNOS) and NO production [23].
To explore the potential role of caveolae in mesangial cell in diabetic nephropathy, we examined the effects of β-MCD on TGF-β1 and HG induced ECM production. β-MCD is a cholesterol-sequestering agent, which is the most commonly used agent to disrupt caveolae. Our results showed that β-MCD treatment significantly attenuated TGF-β1 and HG induced fibronectin production, but had no evident effect on collagen-1 expression. These results suggest that mesangial cell caveolae may have a preferential regulatory role in fibronectin production.
Caveolin-1 is the structural protein of caveolae. Previous studied showed that caveolin-1 can physically interact with multiple signaling molecules and modulates their activity [15,19,24]. Caveolin-1 was first identified as a major substrate of Src kinase [25]. Micro-sequencing of Src-phosphorylated caveolin-1 revealed that phosphorylation occurs within the extreme N-terminal region of full-length caveolin-1 [26]. In addition to Src, other stimuli including mechanotransduction, oxidative stress, insulin and EFG have been also showed to induce caveolin-1 tyrosine phosphorylation [19,27-29]. Importantly, tyrosine phosphorylation on caveolin-1 may enhance the interactions between caveolin-1 and other proteins [18,19]. In the present study, we demonstrated that both TGF-β1 and HG significantly induced caveolin-1 tyrosine phosphorylation, which coincided with an upregulation of fibronectin production. Disruption of caveolae with β-MCD prevented HG and TGF-β1 induced caveolin-1 tyrosine phosphorylation, and attenuated fibronectin production. Furthermore, this effect of β-MCD on fibronectin production could be abolished by cholesterol, which restored HG and TGF-β1 induced caveolin-1 tyrosine phosphorylation. These results suggested that caveolae may play a role in regulation of fibronectin production through caveolin-1 phosphorylation.
A recent study showed that phosphorylated caveolin-1 could interact with and activate RhoA, and RhoA mediated downstream signaling pathways play essential roles in regulation of ECM genes expression [20]. This study highlights the importance of interactions between caveolin-1 and other signaling molecules in regulation of ECM production. In line with this study, we demonstrated that a caveolin-1 scaffold domain peptide attenuated HG and TGF-β1 induced fibronectin production. The caveolin-1 scaffold domain peptide is supposed to compete with endogenous caveolin-1 for interacting with other proteins.
In summary, we demonstrated that the mesangial cell caveolae play a role in regulation of fibronectin production in response to high glucose and TGF-β1 stimulation. The mechanism may involve the phosphorylation of caveolin-1 and its interactions with other signaling molecules.
Acknowledgements
This study was supported by Nature Science Foundation of Shandong Province (No. Y2006C36, No. ZR2012HL50).
Disclosure of conflict of interest
None.
References
- 1.Marshall SM. Recent advances in diabetic nephropathy. Clin Med. 2004;3:277–282. doi: 10.7861/clinmedicine.4-3-277. [DOI] [PMC free article] [PubMed] [Google Scholar]
- 2.Mauer SM, Steffes MW, Ellis EN, Sutherland DE, Brown DM, Goetz FC. Structural-functional relationships in diabetic nephropathy. J Clin Invest. 1984;74:1143–1155. doi: 10.1172/JCI111523. [DOI] [PMC free article] [PubMed] [Google Scholar]
- 3.Mason RM, Wahab NA. Extracellular matrix metabolism in diabetic nephropathy. J Am Soc Nephrol. 2003;14:1358–1373. doi: 10.1097/01.asn.0000065640.77499.d7. [DOI] [PubMed] [Google Scholar]
- 4.Lin CL, Wang JY, Ko JY, Huang YT, Kuo YH, Wang FS. Dickkopf-1 promotes hyperglycemia-induced accumulation of mesangial matrix and renal dysfunction. J Am Soc Nephrol. 2010;21:124–35. doi: 10.1681/ASN.2008101059. [DOI] [PMC free article] [PubMed] [Google Scholar]
- 5.Cooper ME. Interaction of metabolic and hemodynamic factors in mediating experimental diabetic nen K. Diabetologia. 2001;44:1957–1972. doi: 10.1007/s001250100000. [DOI] [PubMed] [Google Scholar]
- 6.Singh DK, Winocour P, Farrington K. Oxidative stress in early diabetic nephropathy: fueling the fire. Nat Rev Endocrinol. 2011;7:176–184. doi: 10.1038/nrendo.2010.212. [DOI] [PubMed] [Google Scholar]
- 7.Wendt T, Harja E, Bucciarelli L, Qu W, Lu Y, Rong LL, Jenkins DG, Stein G, Schmidt AM, Yan SF. Rage modulates vascular inflammation and athero-sclerosis in a murine model of type 2 diabetes. Atherosclerosis. 2006;185:70–77. doi: 10.1016/j.atherosclerosis.2005.06.013. [DOI] [PubMed] [Google Scholar]
- 8.Li JH, Huang XR, Zhu HJ, Johnson R, Lan HY. Role of TGF-beta signaling in extracellular matrix production under high glucose conditions. Kidney Int. 2003;63:2010–2019. doi: 10.1046/j.1523-1755.2003.00016.x. [DOI] [PubMed] [Google Scholar]
- 9.Isono M. Mogyorósi A, Han DC, Hoffman BB, Ziyadeh FN. Stimulation of TGF-beta type II receptor by high glucose in mouse mesangial cells and in diabetic kidney. Am J Physiol Renal Physiol. 2000;278:F830–838. doi: 10.1152/ajprenal.2000.278.5.F830. [DOI] [PubMed] [Google Scholar]
- 10.Schnaper HW, Hayashida T, Hubchak SC, Poncelet AC. TGF-beta signal transduction and mesangial cell fibrogenesis. Am J Physio Renal Physiol. 2003;284:F243–252. doi: 10.1152/ajprenal.00300.2002. [DOI] [PubMed] [Google Scholar]
- 11.Wang XM, Zhang Y, Kim HP, Zhou Z, Feghali-Bostwick CA, Liu F. Caveolin-1: a critical regulator of lung fibrosis in idiopathic pulmonary fibrosis. J Exp Med. 2006;203:2895–2906. doi: 10.1084/jem.20061536. [DOI] [PMC free article] [PubMed] [Google Scholar]
- 12.Yamamoto T, Nakamura T, Noble NA, Ruoslahti E, Border WA. Expression of transforming growth factor beta is elevated in human and experimental diabetic nephropathy. Proc Natl Acad Sci U S A. 1993;90:1814–1818. doi: 10.1073/pnas.90.5.1814. [DOI] [PMC free article] [PubMed] [Google Scholar]
- 13.Wang A, Ziyadeh FN, Lee EY, Pyagay PE, Sung SH, Sheardown SA. Interference with TFGbeta signaling by Smad3-knockout in mice limits diabetic glomerulosclerosis without affecting albuminuria. Am J Physiol Renal Physiol. 2007;293:F1657–1665. doi: 10.1152/ajprenal.00274.2007. [DOI] [PubMed] [Google Scholar]
- 14.Razani B, Lisanti MP. Caveolins and caveolae: molecular and functional relationships. Exp Cell Res. 2001;271:36–44. doi: 10.1006/excr.2001.5372. [DOI] [PubMed] [Google Scholar]
- 15.Okamoto T, Schlegel A, Scherer PE, Lisanti MP. Caveolins, a family of scaffolding proteins for organizing ‘‘preassembled signaling complexes’’ at the plasma membrane. J Biol Chem. 1998;273:5419–5422. doi: 10.1074/jbc.273.10.5419. [DOI] [PubMed] [Google Scholar]
- 16.Sanguinetti AR, Cao H, Corley Mastick C. Fyn is required for oxidative- and hyperosmotic-stress-induced tyrosine phosphorylation of caveolin-1. Biochem J. 2003;376:159–168. doi: 10.1042/BJ20030336. [DOI] [PMC free article] [PubMed] [Google Scholar]
- 17.Samarakoon R, Chitnis SS, Higgins SP, Higgins CE, Krepinsky JC, Higgins PJ. Redox-induced src kinase and caveolin-1 signaling in TGF-β1-initiated smad2/3 activation and pai-1 expression. PLoS One. 2011;6:e22896. doi: 10.1371/journal.pone.0022896. [DOI] [PMC free article] [PubMed] [Google Scholar]
- 18.Cao H, Courchesne WE, Mastick CC. A phosphotyrosine-dependent protein interaction screen reveals a role for phosphorylation of caveolin-1 on tyrosine 14: recruitment of c-terminal src kinase. J Biol Chem. 2002;277:8771–8774. doi: 10.1074/jbc.C100661200. [DOI] [PubMed] [Google Scholar]
- 19.Radel C, Rizzo V. Integrin mechanotransduction stimulates caveolin-1 phosphorylation and recruitment of csk to mediate actin reorganization. Am J Physiol Heart Circ Physiol. 2005;288:H936–945. doi: 10.1152/ajpheart.00519.2004. [DOI] [PubMed] [Google Scholar]
- 20.Peng F, Zhang B, Wu D, Ingram AJ, Gao B, Krepinsky JC. TGFbeta induced RhoA activation and fibronectin production in mesangial cells require caveolae. Am J Physiol Renal Physiol. 2008;295:F153–164. doi: 10.1152/ajprenal.00419.2007. [DOI] [PMC free article] [PubMed] [Google Scholar]
- 21.Lasky JA, Brody AR. Interstitial fibrosis and growth factors. Environ Health Perspect. 2000;108:751–76212. doi: 10.1289/ehp.00108s4751. [DOI] [PMC free article] [PubMed] [Google Scholar]
- 22.Tamai O, Oka N, Kikuchi T, Koda Y, Soejima M, Wada Y. Caveolae in mesangial cells and caveolin expression in mesangial proliferative glomerulonephritis. Kidney int. 2001;59:471–480. doi: 10.1046/j.1523-1755.2001.059002471.x. [DOI] [PubMed] [Google Scholar]
- 23.Komers R, Schutzer WE, Reed JF, Lindsley JN, Oyama TT, Buck DC. Altered endothelial nitric oxide synthase targeting and conformation and caveolin-1 expression in the diabetic kidney. Diabetes. 2006;55:1651–1659. doi: 10.2337/db05-1595. [DOI] [PubMed] [Google Scholar]
- 24.Razani B, Zhang XL, Bitzer M, von Gersdorff G, Böttinger EP, Lisanti MP. Caveolin-1 regulates transforming growth factor (TGF)-beta/Smad signaling through an interaction with the TGFbeta type I receptor. J Biol Chem. 2001;276:6727–6738. doi: 10.1074/jbc.M008340200. [DOI] [PubMed] [Google Scholar]
- 25.Glenney JR Jr, Zokas L. Novel tyrosine kinase substrates from rous sarcoma virus transformed cells are present in the membrane cytoskeleton. J Cell Biol. 1989;108:2401–2408. doi: 10.1083/jcb.108.6.2401. [DOI] [PMC free article] [PubMed] [Google Scholar]
- 26.Li S, Seitz R, Lisanti MP. Phosphorylation of caveolin by src tyrosine kinases: the a-isoform of caveolin is selectively phosphorylated by v-src in vivo. J Biol Chem. 1996;271:3863–3868. [PubMed] [Google Scholar]
- 27.Percy CJ, Pat BK, Healy H, Johnson DW, Gobe GC. Phosphorylation of caveolin-1 is anti-apoptotic and promotes cell attachment during oxidative stress of kidney cells. Pathology. 2008;40:694–701. doi: 10.1080/00313020802436402. [DOI] [PubMed] [Google Scholar]
- 28.Mastick CC, Brady MJ, Saltiel AR. Insulin stimulates the tyrosine phosphorylation of caveolin. J Cell Biol. 1995;129:1523–1531. doi: 10.1083/jcb.129.6.1523. [DOI] [PMC free article] [PubMed] [Google Scholar]
- 29.Kim YN, Wiepz GJ, Guadarrama AG, Bertics PJ. Epidermal growth factor-stimulated tyrosine phosphorylation of caveolin-1. enhanced caveolin-1 tyrosine phosphorylation following aberrant epidermal growth factor receptor status. J Biol Chem. 2000;275:7481–7491. doi: 10.1074/jbc.275.11.7481. [DOI] [PubMed] [Google Scholar]


