MR imaging–guided focused ultrasound, applied weekly to the hippocampus of TgCRND8 mice, led to improvements in cognition, potentially mediated by reduced plaque load and increased neuronal plasticity.
Abstract
Purpose
To validate whether repeated magnetic resonance (MR) imaging–guided focused ultrasound treatments targeted to the hippocampus, a brain structure relevant for Alzheimer disease (AD), could modulate pathologic abnormalities, plasticity, and behavior in a mouse model.
Materials and Methods
All animal procedures were approved by the Animal Care Committee and are in accordance with the Canadian Council on Animal Care. Seven-month-old transgenic (TgCRND8) (Tg) mice and their nontransgenic (non-Tg) littermates were entered in the study. Mice were treated weekly with MR imaging–guided focused ultrasound in the bilateral hippocampus (1.68 MHz, 10-msec bursts, 1-Hz burst repetition frequency, 120-second total duration). After 1 month, spatial memory was tested in the Y maze with the novel arm prior to sacrifice and immunohistochemical analysis. The data were compared by using unpaired t tests and analysis of variance with Tukey post hoc analysis.
Results
Untreated Tg mice spent 61% less time than untreated non-Tg mice exploring the novel arm of the Y maze because of spatial memory impairments (P < .05). Following MR imaging–guided focused ultrasound, Tg mice spent 99% more time exploring the novel arm, performing as well as their non-Tg littermates. Changes in behavior were correlated with a reduction of the number and size of amyloid plaques in the MR imaging–guided focused ultrasound–treated animals (P < .01). Further, after MR imaging–guided focused ultrasound treatment, there was a 250% increase in the number of newborn neurons in the hippocampus (P < .01). The newborn neurons had longer dendrites and more arborization after MR imaging–guided focused ultrasound, as well (P < .01).
Conclusion
Repeated MR imaging–guided focused ultrasound treatments led to spatial memory improvement in a Tg mouse model of AD. The behavior changes may be mediated by decreased amyloid pathologic abnormalities and increased neuronal plasticity.
© RSNA, 2014
Introduction
Disease-modifying therapeutics for treatment of Alzheimer disease (AD) are desperately needed to deal with the growing number of patients with AD and the ever-increasing burden of caring for patients with AD on the health care system (1). Current therapies that address the symptoms of dementia (ie, acetylcholinesterase inhibitors and memantine) show modest and temporary benefits in these patients (2). Furthermore, most current and evolving therapies are designed for patients showing mild cognitive impairment. Treatment options for patients with moderate to late-stage disease are limited.
Magnetic resonance (MR) imaging–guided focused ultrasound has emerged as a method for noninvasive, temporary, and localized opening of the blood-brain barrier (BBB) to improve drug delivery from the blood to the brain (3). Safe and reproducible BBB opening is achieved by delivering clinically approved microbubble contrast agent intravenously at the onset of MR imaging–guided focused ultrasound treatment (3). The intravascular microbubbles oscillate when they pass through the focal region of the ultrasound beam, leading to increased transcellular transport and widening of the tight junctions (4,5). MR imaging–guided focused ultrasound has been used to temporarily permit entry of several imaging and therapeutic agents to the brain (6–10), including antiamyloid antibodies, which were shown to effectively reduce plaque load in the TgCRND8 mouse model of AD (11). When MR imaging–guided focused ultrasound was applied throughout one hemisphere, plaque load was significantly reduced even without additional drug delivery (12). It was suggested that this behavior was mediated by infiltration of endogenous immunoglobulin or the activation of glial cells (12). These studies highlight the potential of MR imaging–guided focused ultrasound to help reduce AD pathologic abnormalities. In addition, MR imaging–guided focused ultrasound plus microbubbles was recently shown to increase neuronal plasticity in the hippocampus. MR imaging–guided focused ultrasound increased the proliferation and survival of newborn neurons in the hippocampus in healthy mice that do not exhibit memory impairments (13). However, it is unknown whether focused ultrasound can also improve hippocampal plasticity in the presence of AD pathologic abnormalities and whether these improvements contribute to improved learning and memory performance in a model that exhibits memory deficits. In this study, we evaluated whether the reported MR imaging–guided focused ultrasound–mediated reductions in plaque load and increases in plasticity can lead to behavior improvements, which would support MR imaging–guided focused ultrasound–mediated BBB opening as a potential treatment for AD.
MR imaging provides superior image contrast and spatial resolution required to target specific brain structures. By targeting focused ultrasound to relevant brain regions, the effect of BBB opening is limited to areas most affected by pathologic abnormalities. A key feature of AD is the reduction in hippocampal-based cognitive performance, and TgCRND8 mice (hereafter, also referred to as Tg mice) show significant deficits in spatial learning tasks. We performed MR imaging–guided focused ultrasound treatments in the bilateral hippocampus and then assessed changes in the Y-maze test of spatial memory and the plasticity of newborn neurons in the hippocampus. In this study, we aimed to validate whether repeated MR imaging–guided focused ultrasound treatments targeted to the hippocampus, a brain structure relevant for AD, could modulate pathologic abnormalities, plasticity, and behavior.
Materials and Methods
Animals
All animal procedures were approved by the Animal Care Committee at Sunnybrook Research Institute (Toronto, Ontario, Canada) and are in accordance with the guidelines established by the Canadian Council on Animal Care. Seven-month-old transgenic mice (TgCRND8) from the Centre for Research in Neurodegenerative Disease (University of Toronto, Toronto, Ontario, Canada) have a double mutation of the amyloid precursor protein 695 (KM670/671/NL and V717F) and develop amyloid pathologic abnormalities and cognitive deficits by 3 months of age (14). TgCRND8 mice were bred to non-TgCRND8 mice (hereafter, also referred to as non-Tg mice), and both Tg and non-Tg offspring were housed in the animal facility at Sunnybrook Research Institute. Mouse pups were tail clipped and genotyped to determine if they carried the transgenic genes by using polymerase chain reaction (14). Non-Tg mice were randomly assigned to MR imaging–guided focused ultrasound–treated (n = 8) and untreated (n = 8) groups. TgCRND8 mice were also randomly assigned to MR imaging–guided focused ultrasound–treated (n = 7) and untreated (n = 6) groups. Fewer TgCRND8 mice were used per group because of the natural death of the animals throughout the experiment. All experiments were performed between November 2012 and July 2013.
MR imaging–guided Focused Ultrasound
MR imaging–guided focused ultrasound was performed by one author (A.B., with 3 years of experience). A spherically curved focused transducer (1.68 MHz), with a 75-mm diameter and a 60-mm radius of curvature, was used to generate a focal spot approximately 0.73 mm in the lateral direction by 4.5 mm in the axial direction (full width at half maximum pressure). A custom-manufactured polyvinylidene difluoride hydrophone was inserted into a small perforation in the center of the transmit transducer. For each experiment, the focused ultrasound positioning system was registered with 7-T MR imaging (BioSpin 7030; Bruker, Billerica, Mass) by obtaining an MR image of the sonicated location of a phantom and registering the coordinates.
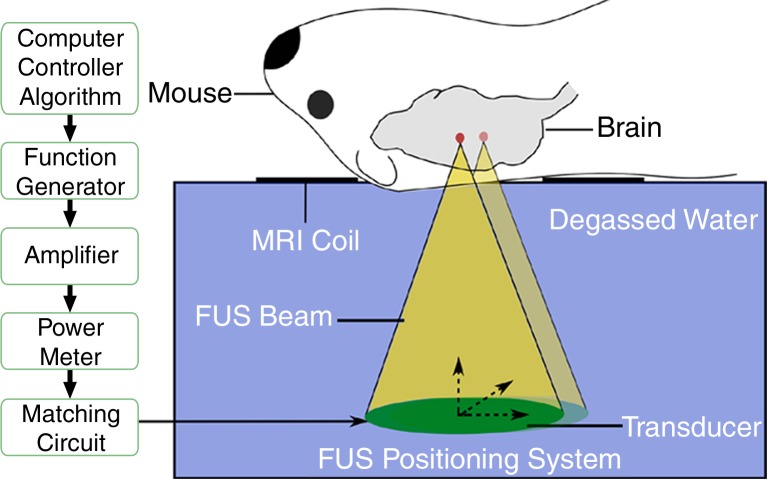
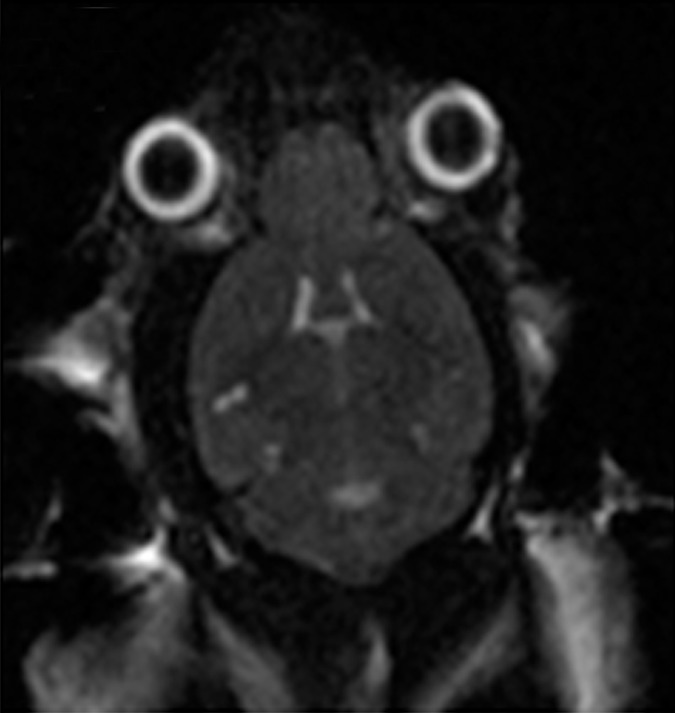
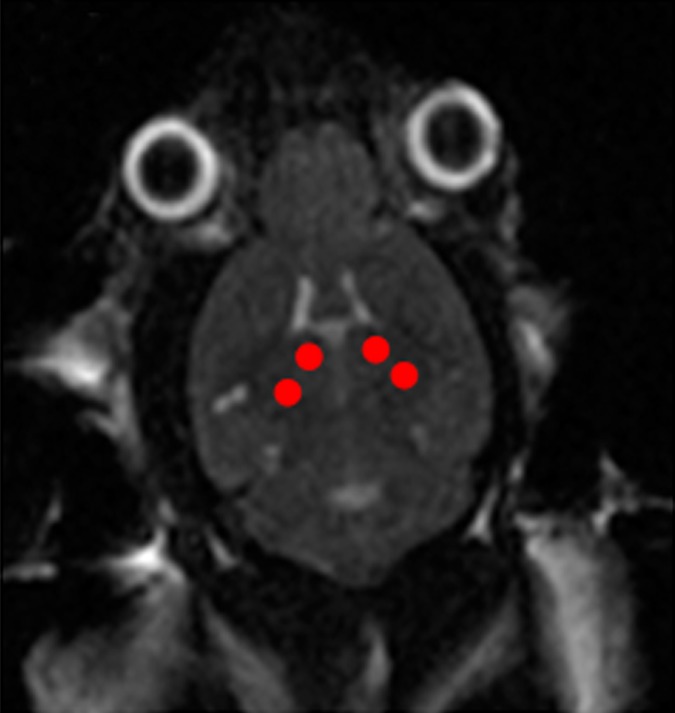
Animals were anesthetized and placed supine on a positioning sled for MR imaging (Fig 1f). T2-weighted images (2000/60) were acquired and used for targeting the focused ultrasound beam to the dorsal hippocampus on both sides of the brain (Fig 1a, 1b). Two target spots were chosen in each of the dorsal hippocampi to cover the entire structure. The positioning sled was then fixed to the triple-axis positioning system (15) equipped with an in-house–manufactured focused transducer and hydrophone (Fig 1f). The animal’s head was coupled to a water bath. Animals were administered an intravenous dose of 0.02 mL per kilogram of body weight of microbubble contrast agent (Definity; Lantheus Medical Imaging, North Billerica, Mass) at the onset of sonication (Fig 1a). Two subsequent sonications, each treating two spots in either the left or right hippocampus, were completed 5 minutes apart by using standard BBB opening parameters (10-msec bursts, 1-Hz burst repetition frequency, 120 seconds in total duration). The applied acoustic pressure was increased incrementally with each burst, and the acoustic emissions were recorded by the hydrophone. The acoustic information was processed in real time with an algorithm that detects subharmonic emissions (16). Once subharmonic emissions that are indicative of enhanced microbubble activity are detected, the acoustic pressure is reduced to half and maintained until the end of the sonication. Using this feedback controller algorithm, the ultrasound pressure is standardized to the microbubble response in each animal and eliminates in situ pressure fluctuations due to variations in skull thickness or differences in vasculature between animals (16). The mean peak pressure reached was calculated by averaging the peak pressure required for BBB opening in each of the four treatment locations per animal. The peak pressure was then averaged again across the three treatments to obtain the mean peak pressure for each animal.
Figure 1f:
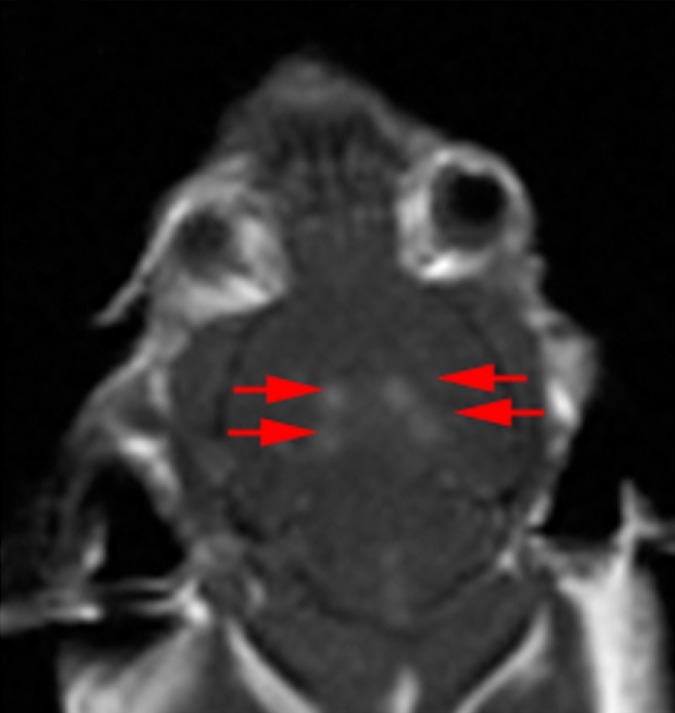
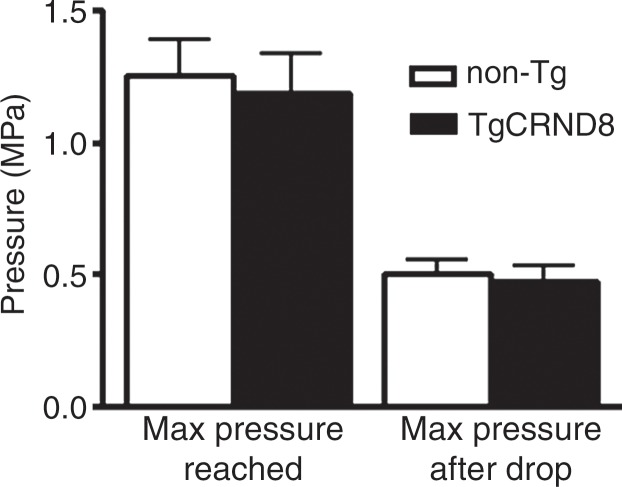
MR imaging (MRI)–guided focused ultrasound (FUS)–induced BBB permeability in the bilateral hippocampus. (a) Axial T2-weighted MR image (repetition time msec/echo time msec, 2000/60) revealed identification of target regions in the brain. (b) Same image as in a shows four spots corresponding to the bilateral hippocampus that were chosen. (c) Posttreatment contrast material–enhanced axial T1-weighted image (500/10) confirms that BBB opening was restricted to the targeted locations. (d) Bar graph shows that there was no significant difference in the levels of contrast enhancement between TgCRND8 mice (138% enhancement) and non-Tg littermates (148% enhancement), indicating that the levels of BBB opening were consistent between groups. (e) Bar graph shows that there was no difference in the mean peak pressure (megapascals) required to open the BBB by using the acoustic controller algorithm. The mean peak pressure reached during the sonications was estimated to be 1.25 MPa ± 0.13 (standard error of the mean) in the non-Tg mice and 1.18 MPa ± 0.15 in the TgCRND8 mice. (f) Schematic of the experimental setup. In d and e, bars represent means, and error bars represent standard errors of the means.
Figure 1a:
MR imaging (MRI)–guided focused ultrasound (FUS)–induced BBB permeability in the bilateral hippocampus. (a) Axial T2-weighted MR image (repetition time msec/echo time msec, 2000/60) revealed identification of target regions in the brain. (b) Same image as in a shows four spots corresponding to the bilateral hippocampus that were chosen. (c) Posttreatment contrast material–enhanced axial T1-weighted image (500/10) confirms that BBB opening was restricted to the targeted locations. (d) Bar graph shows that there was no significant difference in the levels of contrast enhancement between TgCRND8 mice (138% enhancement) and non-Tg littermates (148% enhancement), indicating that the levels of BBB opening were consistent between groups. (e) Bar graph shows that there was no difference in the mean peak pressure (megapascals) required to open the BBB by using the acoustic controller algorithm. The mean peak pressure reached during the sonications was estimated to be 1.25 MPa ± 0.13 (standard error of the mean) in the non-Tg mice and 1.18 MPa ± 0.15 in the TgCRND8 mice. (f) Schematic of the experimental setup. In d and e, bars represent means, and error bars represent standard errors of the means.
Figure 1b:
MR imaging (MRI)–guided focused ultrasound (FUS)–induced BBB permeability in the bilateral hippocampus. (a) Axial T2-weighted MR image (repetition time msec/echo time msec, 2000/60) revealed identification of target regions in the brain. (b) Same image as in a shows four spots corresponding to the bilateral hippocampus that were chosen. (c) Posttreatment contrast material–enhanced axial T1-weighted image (500/10) confirms that BBB opening was restricted to the targeted locations. (d) Bar graph shows that there was no significant difference in the levels of contrast enhancement between TgCRND8 mice (138% enhancement) and non-Tg littermates (148% enhancement), indicating that the levels of BBB opening were consistent between groups. (e) Bar graph shows that there was no difference in the mean peak pressure (megapascals) required to open the BBB by using the acoustic controller algorithm. The mean peak pressure reached during the sonications was estimated to be 1.25 MPa ± 0.13 (standard error of the mean) in the non-Tg mice and 1.18 MPa ± 0.15 in the TgCRND8 mice. (f) Schematic of the experimental setup. In d and e, bars represent means, and error bars represent standard errors of the means.
Immediately following sonications, gadolinium-based contrast agent, gadodiamide (Omniscan; GE Healthcare, Mississauga, Ontario, Canada), 0.2 mL/kg, was injected, and contrast-enhanced T1-weighted images (500/10) were used to confirm BBB opening with focused ultrasound (Fig 1c). The amount of relative enhancement was estimated by measuring pixel intensity in a 2 × 2-mm region of interest and expressing the intensity as a percentage of a reference region of the brain by using a custom program (Matlab; MathWorks, Natick, Mass). The intensity values were averaged over each of the four spots per animal. The enhancement levels for each animal were averaged over the 3 weeks of treatment. Animals underwent an MR imaging–guided focused ultrasound treatment to open the BBB in each hippocampus once per week for 3 consecutive weeks. For 24 hours after each treatment for opening the BBB, mice were weighed and monitored until normal nesting and grooming behaviors were observed. These treatments were followed by a week of behavioral testing, and the mice were sacrificed at 8 months of age.
Figure 1c:
MR imaging (MRI)–guided focused ultrasound (FUS)–induced BBB permeability in the bilateral hippocampus. (a) Axial T2-weighted MR image (repetition time msec/echo time msec, 2000/60) revealed identification of target regions in the brain. (b) Same image as in a shows four spots corresponding to the bilateral hippocampus that were chosen. (c) Posttreatment contrast material–enhanced axial T1-weighted image (500/10) confirms that BBB opening was restricted to the targeted locations. (d) Bar graph shows that there was no significant difference in the levels of contrast enhancement between TgCRND8 mice (138% enhancement) and non-Tg littermates (148% enhancement), indicating that the levels of BBB opening were consistent between groups. (e) Bar graph shows that there was no difference in the mean peak pressure (megapascals) required to open the BBB by using the acoustic controller algorithm. The mean peak pressure reached during the sonications was estimated to be 1.25 MPa ± 0.13 (standard error of the mean) in the non-Tg mice and 1.18 MPa ± 0.15 in the TgCRND8 mice. (f) Schematic of the experimental setup. In d and e, bars represent means, and error bars represent standard errors of the means.
Y-Maze Analysis
The Y-maze analysis was performed by one author (S.D., with 1 year of experience). The Y maze consisted of three identical white plastic arms (50 cm × 10 cm × 10 cm) placed at 120° from each other and with visual cues placed around the room. To evaluate spatial memory, mice were allowed to explore two arms for 10 minutes, followed by a 90-minute intertrial interval, and then they were returned to the maze with access to all three arms. Videos were analyzed by using rodent behavior tracking software (Videotrack; ViewPoint Behavior Technology, Montreal, Quebec, Canada). This test is based on the natural tendency of mice to explore new environments (in this case, the novel arm), as mice with intact hippocampal memory function will spend more of the testing time exploring the novel arm (17). The mice had to enter the distal quadrant of the novel arm to be counted as time spent “exploring the novel arm.” The percentage of time spent in the distal quadrant of the novel arm was calculated as a percentage of the total time in the Y maze. The maximum alternation index test was based on evidence that mice tend to alternate entry into each of the three arms, choosing to enter the less recently visited arm. After a 5-minute exposure to all three arms, the maximum alternation index is expressed as the number of completed triads as a percentage of the total arm entries.
Immunohistochemical Analysis
Immunohistochemical analysis was performed by one author (A.B., with 7 years of experience). Mice were anesthetized and sacrificed by means of intracardiac perfusion with 4% paraformaldehyde. Brains were removed, postfixed in formaldehyde, and immersed in 30% sucrose. Coronal sections of 50 μm were cut through the hippocampus by using a cryostat and were stained with mouse anti-6F3d (1:200) (Dako, Glostrup, Denmark) to visualize amyloid plaques or goat antidoublecortin (1:200) (DCX; Santa Cruz Biotechnology, Santa Cruz, Calif) to identify newly born or immature neurons. Donkey antimouse Alexa 555 (Invitrogen, Burlington, Ontario, Canada) and Donkey-antigoat Alexa 555 (Invitrogen) were used as secondary antibodies.
Plaque Analysis
Plaque analysis was performed by one author (S.Y., with 1 year of experience). Z-stack images from six equally spaced sections spanning the hippocampus of each mouse were obtained by using the 10× objective of the laser scanning microscope (LSM510; Zeiss, Oberkochen, Germany) with a helium-neon laser at wavelength 543 nm and an emission filter of 585/50. Gray-scale maximum intensity projection images were adjusted automatically for brightness and contrast by using ImageJ (18). The total number of plaques and the cross-sectional area of the plaques were automatically calculated by using the particle analysis function of ImageJ. Sections were visually assessed for plaque-coated vessels, and these were excluded from the analysis. The plaque data were measured on individual sections, and an average size and number were obtained for each animal. The unpaired Student t test was used to compare treated and nontreated TgCRND8 mice.
Analysis of Immature Neurons in the Dentate Gyrus
The analysis of immature neurons in the dentate gyrus was performed by three authors (A.B., with 2 years of experience; N.E. and O.H., with 1 year of experience each). Following immunohistochemical analysis for DCX, which was used to identify newborn neurons in the dentate gyrus of the hippocampus, Z-stacks of the entire dentate gyrus were obtained by using the laser scanning microscope (LSM510; Zeiss) and the setting described above. Z-stacks of the images were obtained from four equally spaced sections from the hippocampus of each animal. The neuronal cell bodies were counted by using the Cell Counter plug-in (ImageJ). Approximately 200–400 cell bodies were counted in each animal and were expressed as the total number of cells per section. Neuronal processes (dendrites) extending from each DCX-positive cell body were traced by using Simple Neurite Tracer (ImageJ), as long as the process was vertically oriented into the granular cell layer (19). The total dendrite length was calculated by using spreadsheet software (Excel; Microsoft, Redmond, Wash). To better characterize the branching pattern of these longer dendrites, Sholl analysis was performed. Sholl analysis uses the number of dendrite intersections with concentric circles to describe the dendrite branching pattern. The three-dimensional morphologic characteristics of the dendrites were analyzed by using a Fiji-compatible Sholl analysis plug-in (19). We used concentric circles at radial increments of 1 μm. The data on dendrite intersections were consolidated and postprocessed by using software (Matlab; MathWorks).
Data and Statistical Analyses
Statistical analysis was performed by one author (A.B., with 7 years of experience) using software (GraphPad Prism 5.0; GraphPad Software, San Diego, Calif). Two-tailed, unpaired t tests were used to compare MR imaging–guided focused ultrasound–treated animals and untreated animals with respect to measurements of plaque size and number. One-way analysis of variance with the Tukey posttest was used to determine significant differences between the groups of non-Tg and TgCRND8 mice and untreated and treated mice with respect to enhancement levels, mean peak pressure reached, time in novel arm, maximum alternation index, dendrite number and path length, and the Sholl analysis. A significant difference was noted if P was less than .05. Figures were created with software (Photoshop; Adobe, San Jose, Calif).
Results
MR imaging–guided focused ultrasound was targeted to the bilateral hippocampus by using T2-weighted MR images (Fig 1a, 1b). Following MR imaging–guided focused ultrasound, effective BBB opening in the targeted location was evaluated by using contrast-enhanced T1-weighted images (Fig 1c). The relative amount of BBB opening correlates with the enhancement level on T1-weighted MR images (20). We found no significant difference in the levels of contrast enhancement between TgCRND8 mice (138% enhancement) and non-Tg littermates (148% enhancement), indicating that the levels of BBB opening were consistent between groups (Fig 1d). There was no difference in the mean peak pressure in megapascals required to open the BBB by using the acoustic controller algorithm. The mean peak pressure reached during the sonications was estimated to be 1.25 MPa ± 0.13 in the non-Tg mice and 1.18 MPa ± 0.15 in the TgCRND8 mice (Fig 1e). After reaching this peak value, the pressure amplitude was reduced to one-half for the remainder of the sonication. Therefore, consistent BBB opening was achieved by using similar acoustic pressures in both TgCRND8 and non-Tg mice.
Figure 1d:
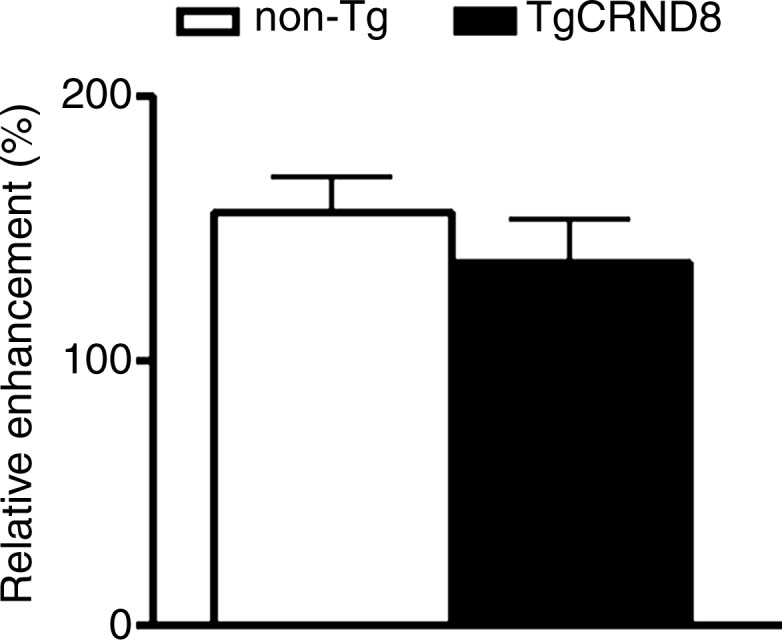
MR imaging (MRI)–guided focused ultrasound (FUS)–induced BBB permeability in the bilateral hippocampus. (a) Axial T2-weighted MR image (repetition time msec/echo time msec, 2000/60) revealed identification of target regions in the brain. (b) Same image as in a shows four spots corresponding to the bilateral hippocampus that were chosen. (c) Posttreatment contrast material–enhanced axial T1-weighted image (500/10) confirms that BBB opening was restricted to the targeted locations. (d) Bar graph shows that there was no significant difference in the levels of contrast enhancement between TgCRND8 mice (138% enhancement) and non-Tg littermates (148% enhancement), indicating that the levels of BBB opening were consistent between groups. (e) Bar graph shows that there was no difference in the mean peak pressure (megapascals) required to open the BBB by using the acoustic controller algorithm. The mean peak pressure reached during the sonications was estimated to be 1.25 MPa ± 0.13 (standard error of the mean) in the non-Tg mice and 1.18 MPa ± 0.15 in the TgCRND8 mice. (f) Schematic of the experimental setup. In d and e, bars represent means, and error bars represent standard errors of the means.
Figure 1e:
MR imaging (MRI)–guided focused ultrasound (FUS)–induced BBB permeability in the bilateral hippocampus. (a) Axial T2-weighted MR image (repetition time msec/echo time msec, 2000/60) revealed identification of target regions in the brain. (b) Same image as in a shows four spots corresponding to the bilateral hippocampus that were chosen. (c) Posttreatment contrast material–enhanced axial T1-weighted image (500/10) confirms that BBB opening was restricted to the targeted locations. (d) Bar graph shows that there was no significant difference in the levels of contrast enhancement between TgCRND8 mice (138% enhancement) and non-Tg littermates (148% enhancement), indicating that the levels of BBB opening were consistent between groups. (e) Bar graph shows that there was no difference in the mean peak pressure (megapascals) required to open the BBB by using the acoustic controller algorithm. The mean peak pressure reached during the sonications was estimated to be 1.25 MPa ± 0.13 (standard error of the mean) in the non-Tg mice and 1.18 MPa ± 0.15 in the TgCRND8 mice. (f) Schematic of the experimental setup. In d and e, bars represent means, and error bars represent standard errors of the means.
TgCRND8 and non-Tg littermates were treated multiple times in the same location to demonstrate that repeated MR imaging–guided focused ultrasound treatments to a structure relevant for the treatment of AD are well tolerated. All mice recovered well from the anesthetic administered and were found to nest and groom normally at 24 hours after each MR imaging–guided focused ultrasound treatment (data not shown). Over the course of the experiment, TgCRND8 mice weighed significantly less than their non-Tg littermates, but weight was unaffected by MR imaging–guided focused ultrasound treatments, indicating normal feeding patterns following recovery from ultrasound exposure (data not shown).
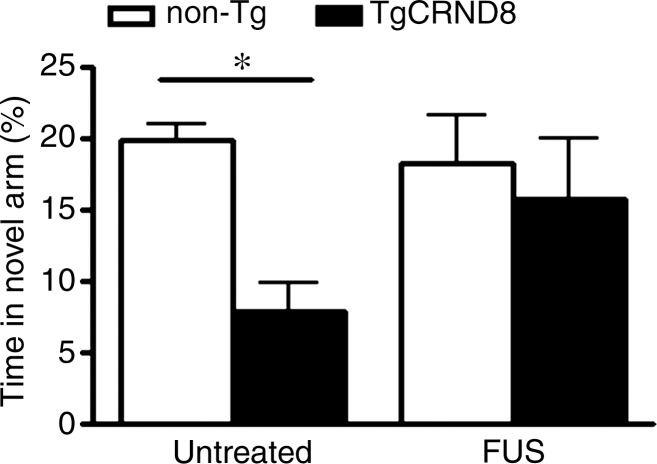
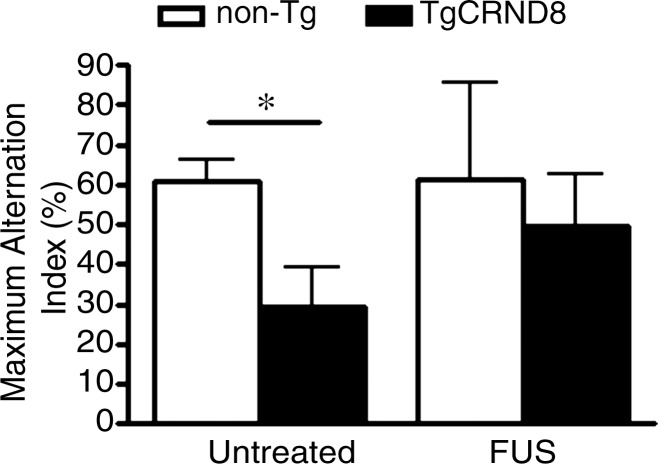
We found that 8-month-old untreated TgCRND8 mice spent 24 seconds (8% of the total time) exploring the novel arm of the Y maze, compared with 1 minute spent by the nontransgenic littermates (20% of the total time). The 61% less time spent in the novel arm by the TgCRND8 mice was significant (P < .05) (Fig 2a) (21). Following MR imaging–guided focused ultrasound treatments, TgCRND8 mice spent 48 seconds exploring the novel arm (16% of the total time), representing a 99% increase in the time spent in the novel arm. This time was similar to the time that the treated non-Tg mice spent, which was 54 seconds (18% of the total time), in the novel arm. Using the maximum alternation index test, TgCRND8 mice performed the correct alternation 29% of the time; by comparison, non-Tg mice performed the correct alternation 61% of the time. The 52% reduction in maximum alternations was significant (P < .05) (Fig 2b). Following MR imaging–guided focused ultrasound treatment, the TgCRND8 mice increased the number of completed alternations to 50%, a level that was comparable to that of the non-Tg mice.
Figure 2a:
MR imaging–guided focused ultrasound (FUS)–treated TgCRND8 mice perform better in the Y maze than untreated TgCRND8 mice. (a) Bar graph shows that TgCRND8 mice spent 24 seconds (8% of the total time) exploring the novel arm of the Y maze, compared with 1 minute spent by the non-Tg mice (20% of the total time). The 61% difference between the TgCRND8 mice and the non-Tg mice was significant (P < .05). Following MR imaging–guided focused ultrasound, TgCRND8 mice spent 99% more time in the novel arm (48 seconds, 16% of the total time), which was similar to the 54 seconds that the mice treated with MR imaging–guided focused ultrasound spent exploring the novel arm (18% of the total time). (b) Bar graph shows that TgCRND8 mice perform 52% fewer completed alternations than the non-Tg littermates (P < .05), but after MR imaging–guided focused ultrasound treatment, the TgCRND8 mice performed the correct alternation 50% of the time, which was similar to result for the treated non-Tg mice who performed correct alternations 61% of the time. Bars represent means, and error bars represent standard errors of the mean, with n = 6–8 per group. A significant difference is noted if P < .05. * = P < .05.
Figure 2b:
MR imaging–guided focused ultrasound (FUS)–treated TgCRND8 mice perform better in the Y maze than untreated TgCRND8 mice. (a) Bar graph shows that TgCRND8 mice spent 24 seconds (8% of the total time) exploring the novel arm of the Y maze, compared with 1 minute spent by the non-Tg mice (20% of the total time). The 61% difference between the TgCRND8 mice and the non-Tg mice was significant (P < .05). Following MR imaging–guided focused ultrasound, TgCRND8 mice spent 99% more time in the novel arm (48 seconds, 16% of the total time), which was similar to the 54 seconds that the mice treated with MR imaging–guided focused ultrasound spent exploring the novel arm (18% of the total time). (b) Bar graph shows that TgCRND8 mice perform 52% fewer completed alternations than the non-Tg littermates (P < .05), but after MR imaging–guided focused ultrasound treatment, the TgCRND8 mice performed the correct alternation 50% of the time, which was similar to result for the treated non-Tg mice who performed correct alternations 61% of the time. Bars represent means, and error bars represent standard errors of the mean, with n = 6–8 per group. A significant difference is noted if P < .05. * = P < .05.
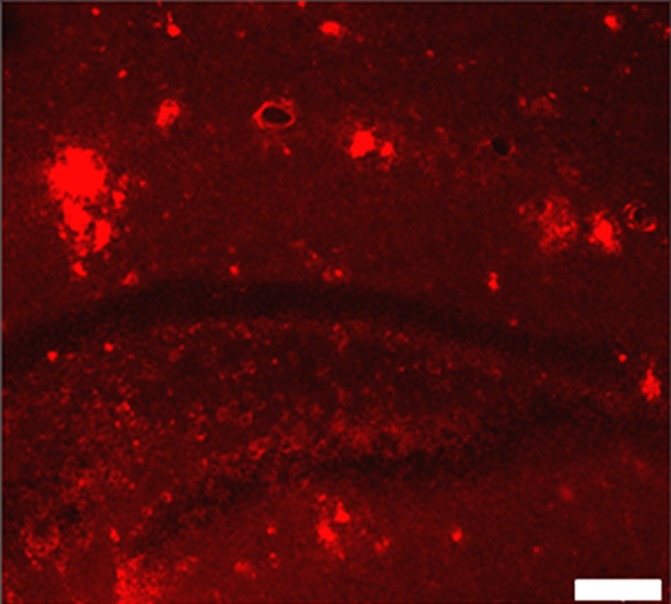
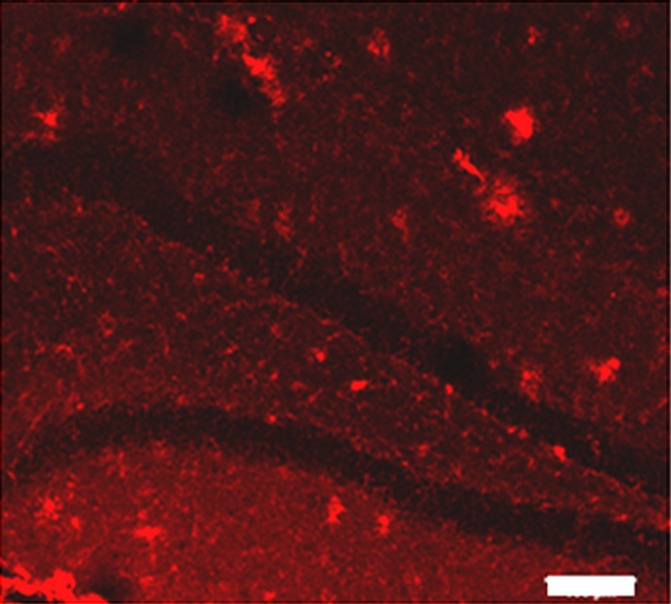
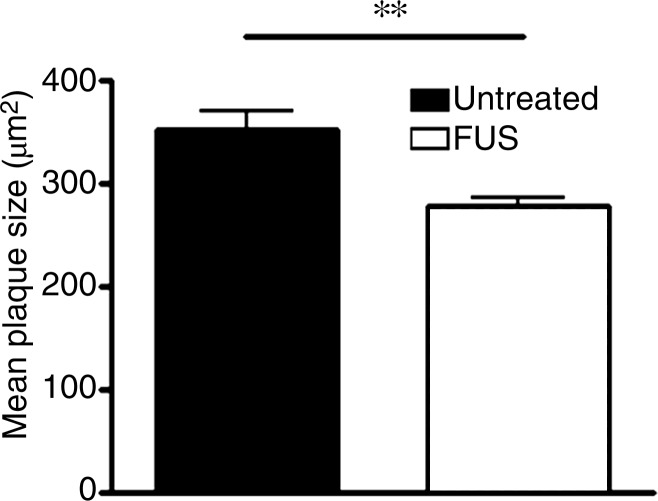
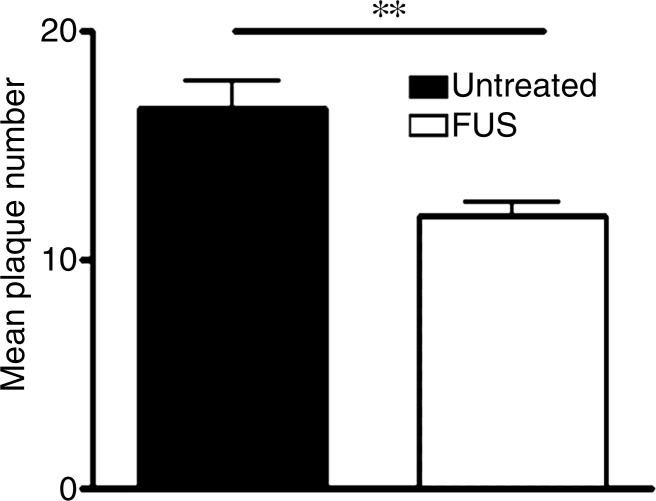
Plaques were identified in sections from untreated (Fig 3a) and MR imaging–guided focused ultrasound–treated (Fig 3b) TgCRND8 mice by using immunohistochemical analysis. The mean plaque size of the TgCRND8 mice was 352 µm2 ± 38, which was reduced by 20% to 279 µm2 ± 16 after MR imaging–guided focused ultrasound treatments (Fig 3c) (P < .01). We also quantified the total number of plaques in the hippocampus and found that the mean number of plaques in the untreated TgCRND8 mice was 17 ± 3 and was reduced to 12 ± 1 after MR imaging–guided focused ultrasound treatment. MR imaging–guided focused ultrasound treatment significantly reduced the plaque load in the hippocampus by 19% (Fig 3d) (P < .01).
Figure 3a:
MR imaging–guided focused ultrasound (FUS) reduces plaque pathologic abnormalilties in the TgCRND8 brain. Plaques were identified by using the 6F3d antibody and were quantified by using ImageJ analysis. (a, b) Representative 10× images of the plaque pathologic abnormalities in untreated TgCRND8 mice (a) and MR imaging–guided focused ultrasound –treated TgCRND8 mice (b). (c) Bar graph shows that mean plaque size in the hippocampus of untreated TgCRND8 mice was 352 µm2 ± 38 which was reduced by 20% to 279 µm2 ± 16 after MR imaging–guided focused ultrasound (P < .01). (d) Bar graph shows that the total number of plaques in the hippocampus of untreated TgCRND8 mice was a mean of 17 ± 3 and was reduced to a mean of 12 ± 1 after MR imaging–guided focused ultrasound treatment, representing a reduction of 19% (P < .01). In c and d, bars represent means, and error bars represent standard errors of the mean, with n = 6–8 per group. ** = P < .01.
Figure 3b:
MR imaging–guided focused ultrasound (FUS) reduces plaque pathologic abnormalilties in the TgCRND8 brain. Plaques were identified by using the 6F3d antibody and were quantified by using ImageJ analysis. (a, b) Representative 10× images of the plaque pathologic abnormalities in untreated TgCRND8 mice (a) and MR imaging–guided focused ultrasound –treated TgCRND8 mice (b). (c) Bar graph shows that mean plaque size in the hippocampus of untreated TgCRND8 mice was 352 µm2 ± 38 which was reduced by 20% to 279 µm2 ± 16 after MR imaging–guided focused ultrasound (P < .01). (d) Bar graph shows that the total number of plaques in the hippocampus of untreated TgCRND8 mice was a mean of 17 ± 3 and was reduced to a mean of 12 ± 1 after MR imaging–guided focused ultrasound treatment, representing a reduction of 19% (P < .01). In c and d, bars represent means, and error bars represent standard errors of the mean, with n = 6–8 per group. ** = P < .01.
Figure 3c:
MR imaging–guided focused ultrasound (FUS) reduces plaque pathologic abnormalilties in the TgCRND8 brain. Plaques were identified by using the 6F3d antibody and were quantified by using ImageJ analysis. (a, b) Representative 10× images of the plaque pathologic abnormalities in untreated TgCRND8 mice (a) and MR imaging–guided focused ultrasound –treated TgCRND8 mice (b). (c) Bar graph shows that mean plaque size in the hippocampus of untreated TgCRND8 mice was 352 µm2 ± 38 which was reduced by 20% to 279 µm2 ± 16 after MR imaging–guided focused ultrasound (P < .01). (d) Bar graph shows that the total number of plaques in the hippocampus of untreated TgCRND8 mice was a mean of 17 ± 3 and was reduced to a mean of 12 ± 1 after MR imaging–guided focused ultrasound treatment, representing a reduction of 19% (P < .01). In c and d, bars represent means, and error bars represent standard errors of the mean, with n = 6–8 per group. ** = P < .01.
Figure 3d:
MR imaging–guided focused ultrasound (FUS) reduces plaque pathologic abnormalilties in the TgCRND8 brain. Plaques were identified by using the 6F3d antibody and were quantified by using ImageJ analysis. (a, b) Representative 10× images of the plaque pathologic abnormalities in untreated TgCRND8 mice (a) and MR imaging–guided focused ultrasound –treated TgCRND8 mice (b). (c) Bar graph shows that mean plaque size in the hippocampus of untreated TgCRND8 mice was 352 µm2 ± 38 which was reduced by 20% to 279 µm2 ± 16 after MR imaging–guided focused ultrasound (P < .01). (d) Bar graph shows that the total number of plaques in the hippocampus of untreated TgCRND8 mice was a mean of 17 ± 3 and was reduced to a mean of 12 ± 1 after MR imaging–guided focused ultrasound treatment, representing a reduction of 19% (P < .01). In c and d, bars represent means, and error bars represent standard errors of the mean, with n = 6–8 per group. ** = P < .01.
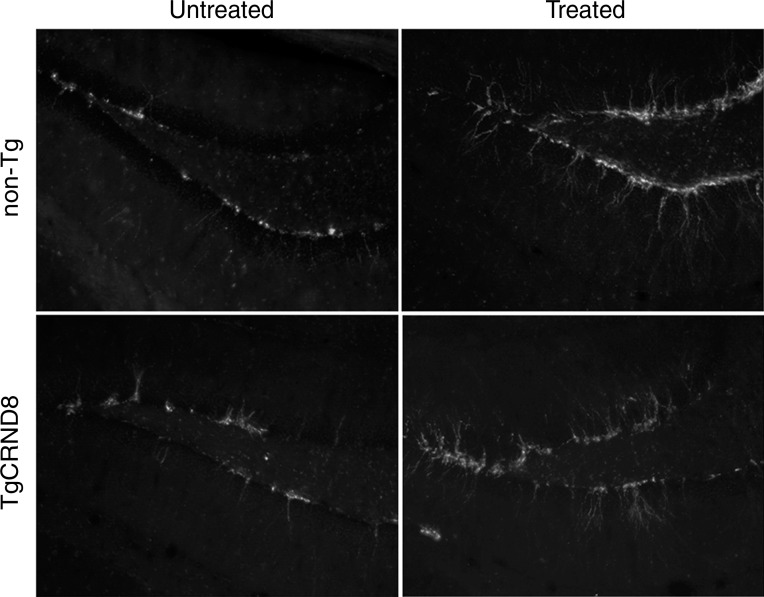
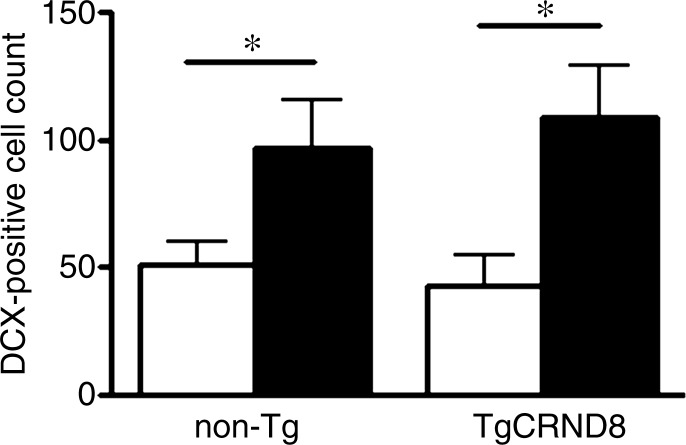
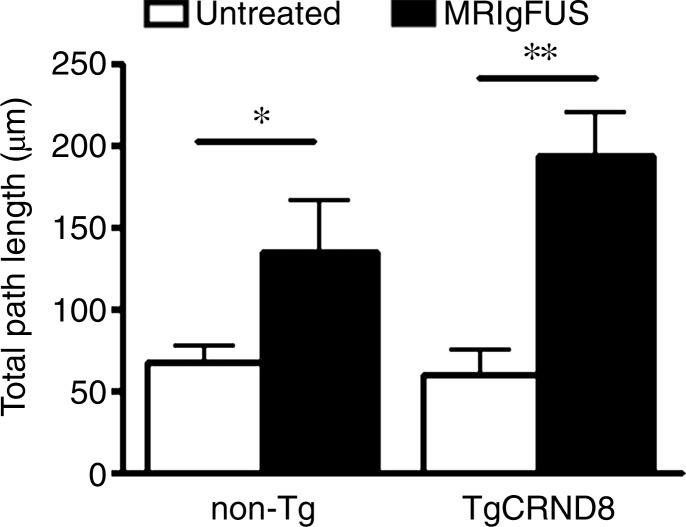
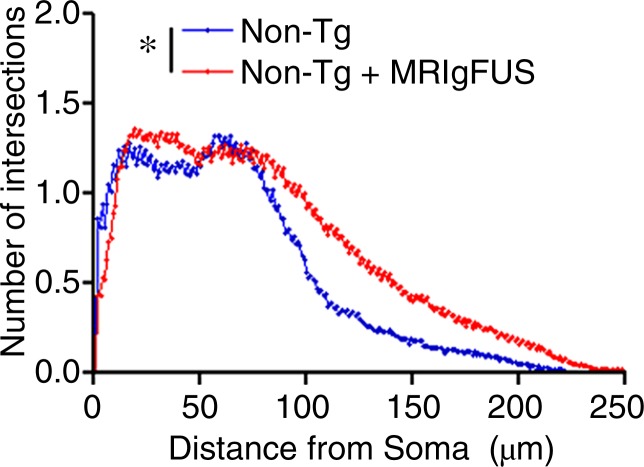
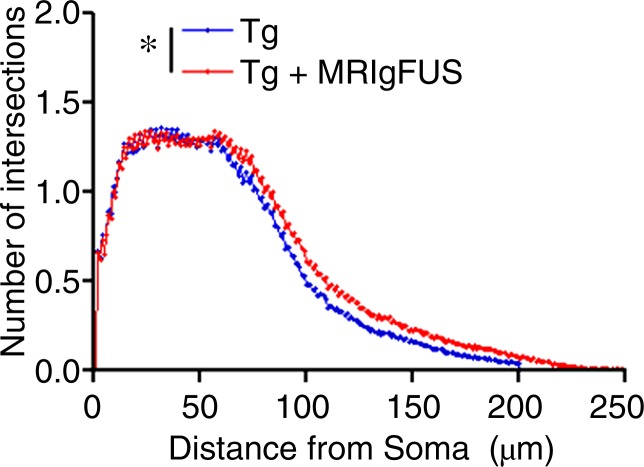
Immunohistochemical analysis revealed that there are increases in the number of DCX-expressing, immature neurons in the dentate gyrus after MR imaging–guided focused ultrasound treatment in both non-Tg and TgCRND8 mice (Fig 4a). The mean number of DCX-positive cells per section was 51 ± 9 in untreated non-Tg mice, compared with 96 ± 18 in non-Tg mice receiving MR imaging–guided focused ultrasound treatments, which is a 188% increase in the number of immature neurons in the hippocampus (Fig 4b) (P < .05). The difference was greater in the TgCRND8 mice who had a mean of 43 ± 12 DCX-positive cells per section without treatment and a mean of 108 ± 20 DCX-positive cells per section following treatment (252% increase) (Fig 4b) (P < .05). To confirm that the increases in DCX-positive cell bodies reflected an increase in the total number of neurons, total dendrite length was also measured and found to be 227% greater in treated non-Tg and TgCRND8 mice. In non-Tg mice receiving MR imaging–guided focused ultrasound treatment, the total dendrite length was a mean of 152 μm ± 30 compared with a mean of 67 μm ± 11 in untreated non-Tg mice (Fig 4c) (P < .05). In TgCRND8 mice, MR imaging–guided focused ultrasound–treated animals had a mean dendrite length of 194 μm ± 27, which was 332% greater than the mean of 60 μm ± 14 observed in the untreated TgCRND8 mice (Fig 4c) (P < .01). In animals treated with MR imaging–guided focused ultrasound, the number of intersections of the dendrite with the virtual ring was increased as the distance from the soma was greater in both the non-Tg (Fig 4d) (P < .05) and TgCRND8 mice (Fig 4e) (P < .05). These data demonstrate that branching of the dendrites is greater in MR imaging–guided focused ultrasound–treated animals compared with their untreated controls, suggesting that MR imaging–guided focused ultrasound increases the differentiation and maturation of DCX-positive cells in the dentate gyrus, potentially contributing to the improved behavior.
Figure 4a:
MR imaging–guided focused ultrasound (MRIgFUS) treatment increases DCX-positive number of cells and branching. (a) Images from DCX immunocytochemical analysis was performed in four equally spaced sections from all animals. Representative 10× images of the newborn neurons in the hippocampus are provided for each treatment group. (b) Bar graph shows that the number of DCX-positive cell bodies increased by 188% in non-Tg mice (P < .05) and by 252% in TgCRND8 mice treated with MR imaging–guided focused ultrasound (P < .05). (c) Bar graph shows that the total dendrite path length was increased by 227% in non-Tg mice (P < .05) and by 332% in TgCRND8 mice (P < .01) treated with MR imaging–guided focused ultrasound. (d) Graph depicts that the number of intersections of a dendrite with the concentric circles, which describes the relative amount of dendrite branching, showed that MR imaging–guided focused ultrasound treatment increased dendritic branching in non-Tg mice at distant radii (P < .05). (e) Graph depicts that the dendritic branching was also increased in TgCRND8 mice following repeated treatment with MR imaging–guided focused ultrasound (P < .05). In b and c, bars represent means, and error bars represent standard errors of the mean, with n = 6–8 per group. * = P < .05, ** = P < .01.
Figure 4b:
MR imaging–guided focused ultrasound (MRIgFUS) treatment increases DCX-positive number of cells and branching. (a) Images from DCX immunocytochemical analysis was performed in four equally spaced sections from all animals. Representative 10× images of the newborn neurons in the hippocampus are provided for each treatment group. (b) Bar graph shows that the number of DCX-positive cell bodies increased by 188% in non-Tg mice (P < .05) and by 252% in TgCRND8 mice treated with MR imaging–guided focused ultrasound (P < .05). (c) Bar graph shows that the total dendrite path length was increased by 227% in non-Tg mice (P < .05) and by 332% in TgCRND8 mice (P < .01) treated with MR imaging–guided focused ultrasound. (d) Graph depicts that the number of intersections of a dendrite with the concentric circles, which describes the relative amount of dendrite branching, showed that MR imaging–guided focused ultrasound treatment increased dendritic branching in non-Tg mice at distant radii (P < .05). (e) Graph depicts that the dendritic branching was also increased in TgCRND8 mice following repeated treatment with MR imaging–guided focused ultrasound (P < .05). In b and c, bars represent means, and error bars represent standard errors of the mean, with n = 6–8 per group. * = P < .05, ** = P < .01.
Figure 4c:
MR imaging–guided focused ultrasound (MRIgFUS) treatment increases DCX-positive number of cells and branching. (a) Images from DCX immunocytochemical analysis was performed in four equally spaced sections from all animals. Representative 10× images of the newborn neurons in the hippocampus are provided for each treatment group. (b) Bar graph shows that the number of DCX-positive cell bodies increased by 188% in non-Tg mice (P < .05) and by 252% in TgCRND8 mice treated with MR imaging–guided focused ultrasound (P < .05). (c) Bar graph shows that the total dendrite path length was increased by 227% in non-Tg mice (P < .05) and by 332% in TgCRND8 mice (P < .01) treated with MR imaging–guided focused ultrasound. (d) Graph depicts that the number of intersections of a dendrite with the concentric circles, which describes the relative amount of dendrite branching, showed that MR imaging–guided focused ultrasound treatment increased dendritic branching in non-Tg mice at distant radii (P < .05). (e) Graph depicts that the dendritic branching was also increased in TgCRND8 mice following repeated treatment with MR imaging–guided focused ultrasound (P < .05). In b and c, bars represent means, and error bars represent standard errors of the mean, with n = 6–8 per group. * = P < .05, ** = P < .01.
Figure 4d:
MR imaging–guided focused ultrasound (MRIgFUS) treatment increases DCX-positive number of cells and branching. (a) Images from DCX immunocytochemical analysis was performed in four equally spaced sections from all animals. Representative 10× images of the newborn neurons in the hippocampus are provided for each treatment group. (b) Bar graph shows that the number of DCX-positive cell bodies increased by 188% in non-Tg mice (P < .05) and by 252% in TgCRND8 mice treated with MR imaging–guided focused ultrasound (P < .05). (c) Bar graph shows that the total dendrite path length was increased by 227% in non-Tg mice (P < .05) and by 332% in TgCRND8 mice (P < .01) treated with MR imaging–guided focused ultrasound. (d) Graph depicts that the number of intersections of a dendrite with the concentric circles, which describes the relative amount of dendrite branching, showed that MR imaging–guided focused ultrasound treatment increased dendritic branching in non-Tg mice at distant radii (P < .05). (e) Graph depicts that the dendritic branching was also increased in TgCRND8 mice following repeated treatment with MR imaging–guided focused ultrasound (P < .05). In b and c, bars represent means, and error bars represent standard errors of the mean, with n = 6–8 per group. * = P < .05, ** = P < .01.
Figure 4e:
MR imaging–guided focused ultrasound (MRIgFUS) treatment increases DCX-positive number of cells and branching. (a) Images from DCX immunocytochemical analysis was performed in four equally spaced sections from all animals. Representative 10× images of the newborn neurons in the hippocampus are provided for each treatment group. (b) Bar graph shows that the number of DCX-positive cell bodies increased by 188% in non-Tg mice (P < .05) and by 252% in TgCRND8 mice treated with MR imaging–guided focused ultrasound (P < .05). (c) Bar graph shows that the total dendrite path length was increased by 227% in non-Tg mice (P < .05) and by 332% in TgCRND8 mice (P < .01) treated with MR imaging–guided focused ultrasound. (d) Graph depicts that the number of intersections of a dendrite with the concentric circles, which describes the relative amount of dendrite branching, showed that MR imaging–guided focused ultrasound treatment increased dendritic branching in non-Tg mice at distant radii (P < .05). (e) Graph depicts that the dendritic branching was also increased in TgCRND8 mice following repeated treatment with MR imaging–guided focused ultrasound (P < .05). In b and c, bars represent means, and error bars represent standard errors of the mean, with n = 6–8 per group. * = P < .05, ** = P < .01.
Discussion
In this study, we showed that MR imaging permits the targeting of specific brain structures, such as the hippocampus, for focused ultrasound–mediated opening of the BBB with microbubbles. MR imaging–guided focused ultrasound, applied weekly to the hippocampus of TgCRND8 mice led to improvements in cognition, potentially mediated by reduced plaque load and increased neuronal plasticity. The BBB was opened repeatedly in the bilateral hippocampus, a structure severely affected in AD and appropriate for clinical treatment targeting. In addition to having positive effects on behavior and pathology, the three weekly MR imaging–guided focused ultrasound treatments did not impair the animals’ weight, grooming, or other activities related to general health. There were no histologic signs of tissue damage induced by the treatment.
Previous studies have demonstrated that repeated MR imaging–guided focused ultrasound treatments can be performed without causing tissue damage in the healthy brain (22–24). More convincingly, repeated MR imaging–guided focused ultrasound treatments in the central visual cortex and the bilateral hippocampus of the macaque brain did not result in deficits in visual or hippocampal-driven cognitive tests (24), supporting the safety of MR imaging–guided focused ultrasound in the healthy brain. Few studies have examined the effects of MR imaging–guided focused ultrasound on a brain affected with complex pathologic abnormalities, such as in AD. By using a mouse model of AD, MR imaging–guided focused ultrasound–mediated opening of the BBB was found to improve the delivery of endogenous and intravenously administered antibodies into the brain without damage to the brain tissue (7). In addition, no differences in the timing or the characteristics of BBB opening between transgenic mice and non-Tg littermates have been described (25). In 2013, Jordão et al (12) reported that, when MR imaging–guided focused ultrasound was applied to one hemisphere, there were corresponding reductions in cortical plaque load, compared with the untreated hemisphere. The researchers in these previous studies have performed unilateral MR imaging–guided focused ultrasound treatments to directly compare the effects of targeted BBB opening with the untreated contralateral hemisphere. While these studies have been effective for demonstrating safety of the treatment, the current study uses a more clinically relevant approach to studying the effects of MR imaging–guided focused ultrasound. The bilateral treatment of the hippocampus shows that the effects of MR imaging–guided focused ultrasound on behavior and pathologic abnormalities are robust and significant between groups of animals.
Compared with the studies in which the researchers applied MR imaging–guided focused ultrasound to one entire hemisphere to reduce plaque load in the cortex (11,12), we used a higher-frequency transducer (1.68 MHz), which has a smaller focal volume, enabling us to target brain substructures and limiting the brain regions affected by the ultrasound treatment. We show that repeated MR imaging–guided focused ultrasound treatments lead to a 20% reduction in plaque load in TgCRND8 mice even at 8 months of age, representing an advanced stage of the disease and abundant plaque pathologic abnormalities. Reduced plaque potentially contributes to the improved cognitive performance of the mice in the Y maze, as the amount of amyloid in the brain is known to correlate with cognition (26–28).
The investigators in previous studies have suggested two potential mechanisms for plaque reduction (12). First, opening of the BBB permits the entry of endogenous immunoglobuline G and immunoglobulin M from the periphery into the brain, which assists with plaque clearance. Second, MR imaging–guided focused ultrasound causes mild activation of astrocytes and microglia, which were shown to internalize amyloid and contribute to plaque reduction (12). These potential mechanisms are likely to also contribute to the reduced plaque observed in this study.
The behavioral studies presented here contribute to the knowledge that focused ultrasound is safe for application in AD. The improvements in spatial learning observed in treated TgCRND8 mice indicate that MR imaging–guided focused ultrasound activates endogenous mechanisms related to learning and memory processes. To relate the changes in behavior to biologic changes in the brain, the immature neurons of the dentate gyrus were characterized by using a specific marker, DCX. Increases in the number of DCX-positive neurons in the hippocampus are known to be required specifically for the acquisition of new spatial memories (29). Increased DCX-positive neurons have been correlated with improvement in cognitive behavior in a model of AD, even in the absence of changes in plaque pathologic abnormalities or total number of neurons (30). We show that MR imaging–guided focused ultrasound increases the proliferation and maturation of newborn cells in the hippocampus and is correlated to improved spatial memory function, but the mechanisms are unknown. In a study with no microbubbles, it was suggested that focused ultrasound can stimulate intact brain circuits and increase production of brain-derived neurotrophic factor, a potent mediator of neural plasticity in the hippocampus (31). Although it would have to be shown that focused ultrasound parameters that open the BBB could also increase brain-derived neurotrophic factor, this could be one mechanism supporting the increased DCX-positive cells following MR imaging–guided focused ultrasound. Another potential mechanism might be induction of Akt signaling in neurons, which has been shown to occur in the regions of BBB opening after MR imaging–guided focused ultrasound (32). Akt is a downstream signaling molecule of tyrosine kinase receptors and is activated on ligand binding to receptors such as neurotrophin receptors, glutamate receptors, and others. It has been well established that activation of Akt signaling leads to increased survival of DCX-positive cells in the presence of amyloid (33).
There are limitations to this study in which we assessed behavioral changes by using only one experimental test. The cognitive changes exhibited by patients with AD extend far beyond the cognitive test used in this study. Further analysis of how repeated MR imaging–guided focused ultrasound treatments affect anxiety, depression, and other types of memory are required. In addition, the TgCRND8 mice do not exhibit all of the pathologic abnormalities observed in clinical cases of AD, and therefore, these experiments need to be performed in a larger cohort of a variety of animal models of AD to gain a true understanding of how BBB opening with MR imaging–guided focused ultrasound can affect behavior and pathology in AD.
Repeated MR imaging–guided focused ultrasound treatments for BBB opening can improve spatial memory, decrease plaque pathologic abnormalities in the hippocampus, and increase neuronal plasticity in the dentate gyrus. It remains to be tested whether the intravenous administration of therapeutics such as antibodies, stem cells, or therapeutic transgenes, in combination with MR imaging–guided focused ultrasound to the hippocampus, would have greater effects on memory and plaque pathology in mouse models of AD. The positive effect of MR imaging–guided focused ultrasound alone on some of the cognitive functions related to pathology in AD is most promising for future consideration of MR imaging–guided focused ultrasound treatments in patients with AD.
Advances in Knowledge
■ Repeated treatments of MR imaging–guided focused ultrasound–mediated blood-brain barrier opening in the hippocampus, without exogenous drug delivery, is well tolerated in a mouse model of Alzheimer disease (AD).
■ Transgenic mice spend 99% more time in the novel arm of the Y-maze test of spatial memory following repeated MR imaging–guided focused ultrasound treatments (P < .05) and perform as well as nontransgenic mice.
■ MR imaging–guided focused ultrasound leads to increased number (252% increase, P < .05), dendrite length (332% increase, P < .01), and dendrite arborization (P < .05) of newborn neurons in the hippocampus of transgenic mice.
Implication for Patient Care
■ MR imaging–guided focused ultrasound has the potential to positively affect symptoms and pathologic abnormalities associated with AD, in addition to its proven capability to improve drug delivery to the brain.
Acknowledgments
Acknowledgments
The authors acknowledge Shawna Rideout-Gros (Physical Sciences, Sunnybrook Research Institute, Toronto, Ontario, Canada), Alexandra Garces (Physical Sciences, Sunnybrook Research Institute, Toronto, Ontario, Canada), Kelly Markham-Coultes (Biological Sciences, Sunnybrook Research Institute, Toronto, Ontario, Canada), and Melissa Theodore, BSc (Biological Sciences, Sunnybrook Research Institute, Toronto, Ontario, Canada), for help with animal care; Milan Ganguly, BSc (Physical Sciences, Sunnybrook Research Institute, Toronto, Ontario, Canada), for assistance with DCX staining; Meaghan O’Reilly, PhD (Physical Sciences, Sunnybrook Research Institute, Toronto, Ontario, Canada), for help with Matlab; and Clare Moffatt (Physical Sciences, Sunnybrook Research Institute, Toronto, Ontario, Canada) for assistance with graphics. We thank Paul Fraser, PhD (Centre for Research in Neurodegenerative Disease, University of Toronto, Toronto, Ontario, Canada), and David Westaway, PhD (Centre for Prions and Protein Folding Diseases, University of Alberta, Edmonton, Alberta, Canada), for their contributions in creating the TgCRND8 mice and making them available to us.
Received February 12, 2014; revision requested March 27; final revision received April 24; accepted May 13; final version accepted June 18.
I.A. supported in part by Canadian Institutes of Health Research (CIHR) grant FRN 93063. K.H. supported in part by CIHR grant FRN 119312.
Funding: This research was supported by the National Institutes of Health (grant no. R01 EB003268).
See also Science to Practice in this issue.
Disclosures of Conflicts of Interest: A.B. disclosed no relevant relationships. S.D. disclosed no relevant relationships. S.Y. disclosed no relevant relationships. O.H. disclosed no relevant relationships. N.E. disclosed no relevant relationships. I.A. disclosed no relevant relationships. K.H. Activities related to the present article: received grants from the National Institutes of Health and Canadian Institutes of Health Research. Activities not related to the present article: FUS Instruments is developing preclinical ultrasound devices for research, and authors are developing this technology under a Canadian government matching grant that matches company contributions; author has patents issued and licensed, with royalties paid to Brigham and Women’s Hospital, for the following patents: no. 5,752,515, titled Methods and apparatus for image guided ultrasound delivery of compounds through the blood brain barrier; no. 6,514,221 B2, titled Blood-brain barrier opening; no. 7674229, titled Adaptive ultrasound delivery system; no. 7,344,509, titled Shear mode therapeutic ultrasound; no. 6,612,988, titled Ultrasound therapy; and no. 6,770,031B2, titled Ultrasound therapy; and has a patent application (patient pending and licensed) owned by Sunnybrook Research Institute (application 20100125192). Other relationships: disclosed no relevant relationships.
Abbreviations:
- AD
- Alzheimer disease
- BBB
- blood-brain barrier
References
- 1.Brookmeyer R, Johnson E, Ziegler-Graham K, Arrighi HM. Forecasting the global burden of Alzheimer’s disease. Alzheimers Dement 2007;3(3):186–191. [DOI] [PubMed] [Google Scholar]
- 2.Salomone S, Caraci F, Leggio GM, Fedotova J, Drago F. New pharmacological strategies for treatment of Alzheimer’s disease: focus on disease modifying drugs. Br J Clin Pharmacol 2012;73(4):504–517. [DOI] [PMC free article] [PubMed] [Google Scholar]
- 3.Hynynen K, McDannold N, Vykhodtseva N, Jolesz FA. Noninvasive MR imaging–guided focal opening of the blood-brain barrier in rabbits. Radiology 2001;220(3):640–646. [DOI] [PubMed] [Google Scholar]
- 4.Sheikov N, McDannold N, Vykhodtseva N, Jolesz F, Hynynen K. Cellular mechanisms of the blood-brain barrier opening induced by ultrasound in presence of microbubbles. Ultrasound Med Biol 2004;30(7):979–989. [DOI] [PubMed] [Google Scholar]
- 5.Sheikov N, McDannold N, Sharma S, Hynynen K. Effect of focused ultrasound applied with an ultrasound contrast agent on the tight junctional integrity of the brain microvascular endothelium. Ultrasound Med Biol 2008;34(7):1093–1104. [DOI] [PMC free article] [PubMed] [Google Scholar]
- 6.Kinoshita M, McDannold N, Jolesz FA, Hynynen K. Noninvasive localized delivery of Herceptin to the mouse brain by MRI-guided focused ultrasound-induced blood-brain barrier disruption. Proc Natl Acad Sci U S A 2006;103(31):11719–11723. [DOI] [PMC free article] [PubMed] [Google Scholar]
- 7.Raymond SB, Treat LH, Dewey JD, McDannold NJ, Hynynen K, Bacskai BJ. Ultrasound enhanced delivery of molecular imaging and therapeutic agents in Alzheimer’s disease mouse models. PLoS ONE 2008;3(5):e2175. [DOI] [PMC free article] [PubMed] [Google Scholar]
- 8.Liu HL, Hua MY, Chen PY, et al. Blood-brain barrier disruption with focused ultrasound enhances delivery of chemotherapeutic drugs for glioblastoma treatment. Radiology 2010;255(2):415–425. [DOI] [PubMed] [Google Scholar]
- 9.Liu HL, Hua MY, Yang HW, et al. Magnetic resonance monitoring of focused ultrasound/magnetic nanoparticle targeting delivery of therapeutic agents to the brain. Proc Natl Acad Sci U S A 2010;107(34):15205–15210. [DOI] [PMC free article] [PubMed] [Google Scholar]
- 10.Burgess A, Ayala-Grosso CA, Ganguly M, Jordão JF, Aubert I, Hynynen K. Targeted delivery of neural stem cells to the brain using MRI-guided focused ultrasound to disrupt the blood-brain barrier. PLoS ONE 2011;6(11):e27877. [DOI] [PMC free article] [PubMed] [Google Scholar]
- 11.Jordão JF, Ayala-Grosso CA, Markham K, et al. Antibodies targeted to the brain with image-guided focused ultrasound reduces amyloid-beta plaque load in the TgCRND8 mouse model of Alzheimer’s disease. PLoS ONE 2010;5(5):e10549. [DOI] [PMC free article] [PubMed] [Google Scholar]
- 12.Jordão JF, Thévenot E, Markham-Coultes K, et al. Amyloid-β plaque reduction, endogenous antibody delivery and glial activation by brain-targeted, transcranial focused ultrasound. Exp Neurol 2013;248:16–29. [DOI] [PMC free article] [PubMed] [Google Scholar]
- 13.Scarcelli T, Jordão JF, O’Reilly MA, Ellens N, Hynynen K, Aubert I. Stimulation of hippocampal neurogenesis by transcranial focused ultrasound and microbubbles in adult mice. Brain Stimulat 2014;7(2):304–307. [DOI] [PMC free article] [PubMed] [Google Scholar]
- 14.Chishti MA, Yang DS, Janus C, et al. Early-onset amyloid deposition and cognitive deficits in transgenic mice expressing a double mutant form of amyloid precursor protein 695. J Biol Chem 2001;276(24):21562–21570. [DOI] [PubMed] [Google Scholar]
- 15.Chopra R, Curiel L, Staruch R, Morrison L, Hynynen K. An MRI-compatible system for focused ultrasound experiments in small animal models. Med Phys 2009;36(5):1867–1874. [DOI] [PMC free article] [PubMed] [Google Scholar]
- 16.O’Reilly MA, Hynynen K. Blood-brain barrier: real-time feedback-controlled focused ultrasound disruption by using an acoustic emissions-based controller. Radiology 2012;263(1):96–106. [DOI] [PMC free article] [PubMed] [Google Scholar]
- 17.Dellu F, Mayo W, Cherkaoui J, Le Moal M, Simon H. A two-trial memory task with automated recording: study in young and aged rats. Brain Res 1992;588(1):132–139. [DOI] [PubMed] [Google Scholar]
- 18.Rasband WS. ImageJ. Bethesda, Md: National Institutes of Health, 1997–2014. http://imagej.nih.gov/ij/. Accessed August 2014.
- 19.Schindelin J, Arganda-Carreras I, Frise E, et al. Fiji: an open-source platform for biological-image analysis. Nat Methods 2012;9(7):676–682. [DOI] [PMC free article] [PubMed] [Google Scholar]
- 20.Yang FY, Horng SC, Lin YS, Kao YH. Association between contrast-enhanced MR images and blood-brain barrier disruption following transcranial focused ultrasound. J Magn Reson Imaging 2010;32(3):593–599. [DOI] [PubMed] [Google Scholar]
- 21.Maliszewska-Cyna E, McLaurin J, Aubert I. Examining the effects of exercise on amyloid pathology, adult neurogenesis, and cognition in a mouse model of Alzheimer’s disease [abstr]. Presented at the Experimental Biology Conference, Boston, Mass, April 20–24, 2013. [Google Scholar]
- 22.Hynynen K, McDannold N, Martin H, Jolesz FA, Vykhodtseva N. The threshold for brain damage in rabbits induced by bursts of ultrasound in the presence of an ultrasound contrast agent (Optison). Ultrasound Med Biol 2003;29(3):473–481. [DOI] [PubMed] [Google Scholar]
- 23.McDannold N, Vykhodtseva N, Raymond S, Jolesz FA, Hynynen K. MRI-guided targeted blood-brain barrier disruption with focused ultrasound: histological findings in rabbits. Ultrasound Med Biol 2005;31(11):1527–1537. [DOI] [PubMed] [Google Scholar]
- 24.McDannold N, Arvanitis CD, Vykhodtseva N, Livingstone MS. Temporary disruption of the blood-brain barrier by use of ultrasound and microbubbles: safety and efficacy evaluation in rhesus macaques. Cancer Res 2012;72(14):3652–3663. [DOI] [PMC free article] [PubMed] [Google Scholar]
- 25.Choi JJ, Wang S, Brown TR, Small SA, Duff KE, Konofagou EE. Noninvasive and transient blood-brain barrier opening in the hippocampus of Alzheimer’s double transgenic mice using focused ultrasound. Ultrason Imaging 2008;30(3):189–200. [DOI] [PMC free article] [PubMed] [Google Scholar]
- 26.Janus C, Pearson J, McLaurin J, et al. A beta peptide immunization reduces behavioural impairment and plaques in a model of Alzheimer’s disease. Nature 2000;408(6815):979–982. [DOI] [PubMed] [Google Scholar]
- 27.McLaurin J, Cecal R, Kierstead ME, et al. Therapeutically effective antibodies against amyloid-beta peptide target amyloid-beta residues 4-10 and inhibit cytotoxicity and fibrillogenesis. Nat Med 2002;8(11):1263–1269. [DOI] [PubMed] [Google Scholar]
- 28.Selkoe DJ. Soluble oligomers of the amyloid beta-protein impair synaptic plasticity and behavior. Behav Brain Res 2008;192(1):106–113. [DOI] [PMC free article] [PubMed] [Google Scholar]
- 29.Vukovic J, Borlikova GG, Ruitenberg MJ, et al. Immature doublecortin-positive hippocampal neurons are important for learning but not for remembering. J Neurosci 2013;33(15):6603–6613. [DOI] [PMC free article] [PubMed] [Google Scholar]
- 30.Valero J, España J, Parra-Damas A, Martín E, Rodríguez-Álvarez J, Saura CA. Short-term environmental enrichment rescues adult neurogenesis and memory deficits in APP(Sw,Ind) transgenic mice. PLoS ONE 2011;6(2):e16832. [DOI] [PMC free article] [PubMed] [Google Scholar]
- 31.Tufail Y, Matyushov A, Baldwin N, et al. Transcranial pulsed ultrasound stimulates intact brain circuits. Neuron 2010;66(5):681–694. [DOI] [PubMed] [Google Scholar]
- 32.Jalali S, Huang Y, Dumont DJ, Hynynen K. Focused ultrasound-mediated bbb disruption is associated with an increase in activation of AKT: experimental study in rats. BMC Neurol 2010;10:114. http://www.biomedcentral.com/1471-2377/10/114. Published November 15, 2010. Accessed August 2014. [DOI] [PMC free article] [PubMed] [Google Scholar]
- 33.Li L, Xu B, Zhu Y, Chen L, Sokabe M, Chen L. DHEA prevents Aβ25-35-impaired survival of newborn neurons in the dentate gyrus through a modulation of PI3K-Akt-mTOR signaling. Neuropharmacology 2010;59(4-5):323–333. [DOI] [PubMed] [Google Scholar]


