

With imaging conditions that did not include x-ray source motion or patient motion during acquisition of the projection views, narrow-angle digital breast tomography (DBT) provided higher detection sensitivity and conspicuity than wide-angle DBT for subtle microcalcification clusters.
Abstract
Purpose
To investigate the dependence of microcalcification cluster detectability on tomographic scan angle, angular increment, and number of projection views acquired at digital breast tomosynthesis (DBT).
Materials and Methods
A prototype DBT system operated in step-and-shoot mode was used to image breast phantoms. Four 5-cm-thick phantoms embedded with 81 simulated microcalcification clusters of three speck sizes (subtle, medium, and obvious) were imaged by using a rhodium target and rhodium filter with 29 kV, 50 mAs, and seven acquisition protocols. Fixed angular increments were used in four protocols (denoted as scan angle, angular increment, and number of projection views, respectively: 16°, 1°, and 17; 24°, 3°, and nine; 30°, 3°, and 11; and 60°, 3°, and 21), and variable increments were used in three (40°, variable, and 13; 40°, variable, and 15; and 60°, variable, and 21). The reconstructed DBT images were interpreted by six radiologists who located the microcalcification clusters and rated their conspicuity.
Results
The mean sensitivity for detection of subtle clusters ranged from 80% (22.5 of 28) to 96% (26.8 of 28) for the seven DBT protocols; the highest sensitivity was achieved with the 16°, 1°, and 17 protocol (96%), but the difference was significant only for the 60°, 3°, and 21 protocol (80%, P < .002) and did not reach significance for the other five protocols (P = .01–.15). The mean sensitivity for detection of medium and obvious clusters ranged from 97% (28.2 of 29) to 100% (24 of 24), but the differences fell short of significance (P = .08 to >.99). The conspicuity of subtle and medium clusters with the 16°, 1°, and 17 protocol was rated higher than those with other protocols; the differences were significant for subtle clusters with the 24°, 3°, and nine protocol and for medium clusters with 24°, 3°, and nine; 30°, 3°, and 11; 60°, 3° and 21; and 60°, variable, and 21 protocols (P < .002).
Conclusion
With imaging that did not include x-ray source motion or patient motion during acquisition of the projection views, narrow-angle DBT provided higher sensitivity and conspicuity than wide-angle DBT for subtle microcalcification clusters.
© RSNA, 2014
Introduction
The sensitivity of mammography is limited by the presence of overlapping fibroglandular tissue that may obscure the lesions in the breast. Digital breast tomosynthesis (DBT) is a limited-angle tomography technique in which high-resolution image sections can be reconstructed parallel to the detector plane but with limited resolution along the depth direction (1). It has been shown that DBT increases the detectability of subtle soft-tissue lesions and reduces recall rates by reducing the overlapping breast tissues in a number of retrospective observer studies (2–4) and prospective clinical trials in screening (5–7) or diagnostic (8) settings when DBT is used in combination with full-field digital mammography (FFDM). Other investigators have studied whether one- or two-view DBT can replace two-view FFDM rather than be used as an adjunct (9–12). However, it is still unknown whether the detectability of microcalcifications in DBT can be as high as that with FFDM, with studies yielding conflicting results (2,13–15). Various methods have been studied to improve the detection of microcalcifications in DBT, including the use of FFDM in combination with one- or two-view DBT, the synthesis of an FFDM-like image to replace the directly acquired FFDM (16), the development of computer-aided detection methods for DBT (17–24), and the enhancement of the visibility of microcalcifications by improving reconstruction and image-processing methods (25–29).
It is known that the visibility of lesions in DBT depends strongly on the image acquisition parameters, including the tomographic scan angle, the angular increment, and the number of projection views, in addition to other factors that affect the image quality of x-ray imaging systems. The visibility of breast lesions also depends on the physical properties of the lesions. Soft-tissue masses and architectural distortion occur over a relatively large area and detection is limited by image contrast, whereas microcalcifications are relatively small and detection is limited by resolution. Structured noise and random noise also play an important role in both detection tasks. The best combination of the DBT scan parameters for each type of lesion is still being investigated. Studies involving simulation and modeling (30–34) or experimental measurement and observation (35–38) were performed to evaluate the effect of these parameters on image quality.
The purpose of this study was to investigate the dependence of microcalcification cluster detectability on tomographic scan angle, angular increment, and number of projection views acquired with DBT (39).
Materials and Methods
S.Z. and A.S. are employees of GE Global Research, but their efforts in this project were supported by subcontracts from the University of Michigan National Institutes of Health grants RO1 CA151443 and RO1 CA091713. H.P.C. had control of the data and information submitted for publication.
DBT System
A prototype DBT system (GEN2; GE Global Research, Niskayuna, NY) was used to perform DBT scans (Fig 1). The system has a rhodium target and rhodium filter x-ray source and a stationary cesium iodide phosphor and amorphous silicon active matrix flat-panel digital detector with a matrix size of 1920 × 2304 pixels and a pixel pitch of 0.1 × 0.1 mm. The system uses a step-and-shoot design to minimize potential motion blurring of the focal spot during x-ray exposure.
Figure 1:
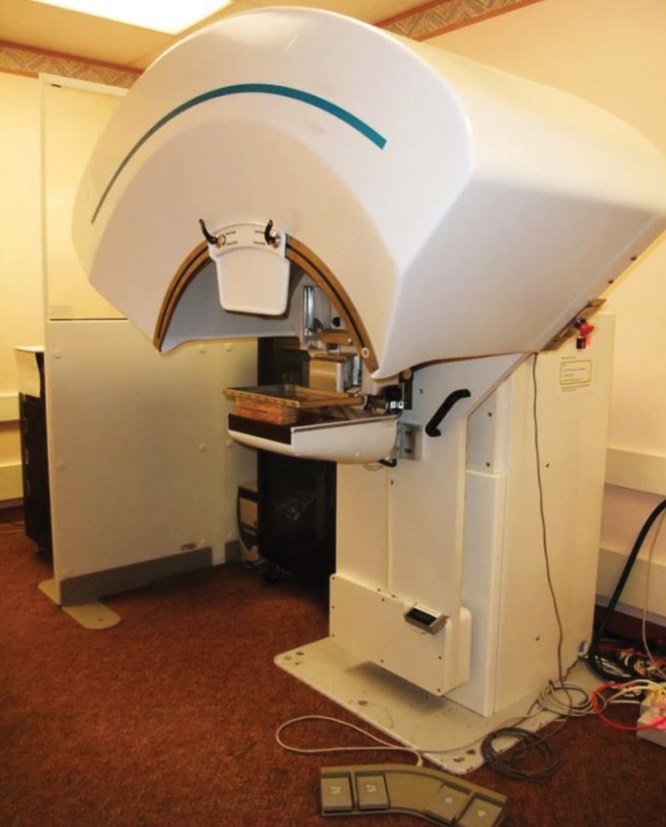
Photograph shows the prototype DBT system used in this study. The phantom is shown under the compression paddle.
An advanced mode was installed in the prototype DBT system. The advanced mode allows the user to select input parameters, including the tomographic scan angle, constant or variable angular increments between the projection views, and the number of projection views for a given scan. The kilovoltage and total tube current–time product for the scan can also be chosen over a wide range. The total tube current–time product is divided evenly among the projection views.
Breast Phantoms
Six slabs of 1-cm-thick heterogeneous breast-tissue–mimicking material (CIRS, Norfolk, Va) were used (Fig 2) to construct breast phantoms. By using five of the six slabs and arranging them in different orders and orientations, we constructed four different 5-cm-thick phantoms. Simulated calcifications (CIRS) consisting of calcium carbonate particles of three nominal speck size ranges were used to form clusters with three visibility levels (subtle, 0.15–0.18 mm; medium, 0.18–0.25 mm; and obvious, 0.25–0.30 mm). The four phantoms contained a total of 81 clusters, of which 28 were subtle, 29 were medium, and 24 were obvious, and they were randomly sandwiched between the slabs in each phantom.
Figure 2:
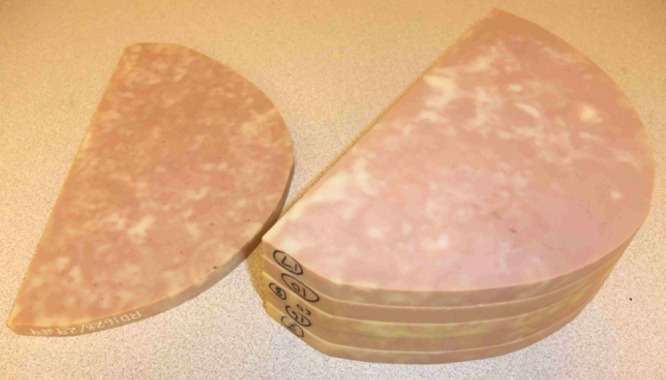
Photograph shows six slabs of 1-cm-thick breast-shape heterogeneous breast-tissue–mimicking material (CIRS) used to construct breast phantoms. Four different 5-cm-thick phantoms were formed by using five of the six slabs arranged in different orders and orientations.
DBT Acquisition Parameters
DBT scans of the breast phantoms were performed with different combinations of acquisition parameters, which included the scan angle and the number of projection views acquired with constant or variable angular increments. For simplicity, we refer to each combination as a DBT protocol.
To keep the interpretation time reasonable, the number of protocols to be compared in the observer experiment had to be limited. Two medical physicists (H.P.C. and M.M.G.), each with more than 25 years of experience in mammography, selected a few protocols from the many possible combinations by visually comparing phantom images obtained with a number of protocols. We observed that imaging with too many projection views with the chosen exposure technique would result in very noisy images, while large angular increments and too few projection views could result in streaking or ripple artifacts on the reconstructed sections. For variable angular increments, we compared two major groups: one with small increments at small projection angles and larger increments at large projection angles, the other with large increments at small projection angles and smaller increments at large projection angles. We observed that, for similar scan angle and number of projection views, the visual quality of microcalcifications, such as sharpness and contrast in the latter group, was generally inferior to that in the former group. We therefore only selected protocols from the former group for this study. After the preliminary comparison, we selected seven protocols, including four protocols with fixed angular increments and three protocols with variable angular increments (Table 1). For the protocols with fixed increments, the scan angle was varied from a range of 16° to 60°, which approximately covered the scan angles of the prototype DBT systems being developed and the commercial DBT system in clinical use.
Table 1.
Seven Protocols for Breast Tomosynthesis Acquisition Selected for This Study
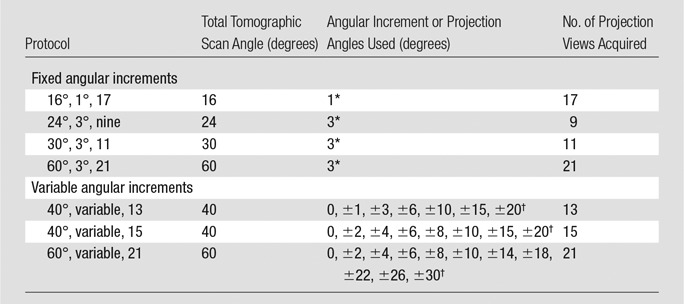
Numbers are angular increments.
Numbers are projection angles.
By using the same compression, each phantom was imaged for all seven protocols with the advanced mode. The phantom configuration, thickness, and positioning were therefore identical among the seven acquisitions. All scans were performed with the same exposure technique, rhodium target and rhodium filter, 29 kV, and 50 mAs, which was estimated to produce a mean glandular dose (approximately 1.1 mGy) similar to a single-view FFDM for a 5-cm-thick 50% glandular and 50% adipose-tissue breast by using the standard dose mode with our clinical FFDM systems (GE Essential; GE). For a given protocol, all four phantoms were imaged with the same exposure conditions. All DBT images were reconstructed by using a simultaneous algebraic reconstruction technique with two iterations and a relaxation parameter of 0.5 in the first iteration and 0.3 in the second iteration (40). The reconstructed sections were parallel to the detector plane, and the section spacing was fixed at 1 mm. The pixel dimensions on the reconstructed sections were kept the same as the pixel pitch at 0.1 × 0.1 mm.
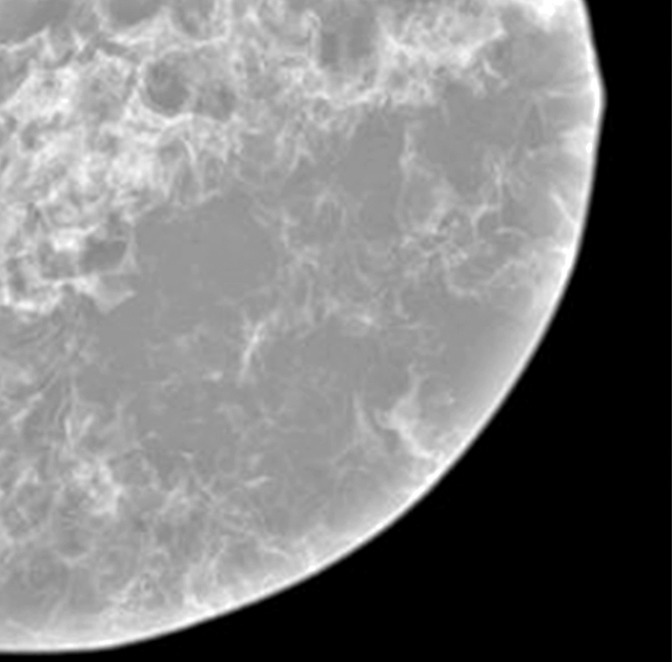
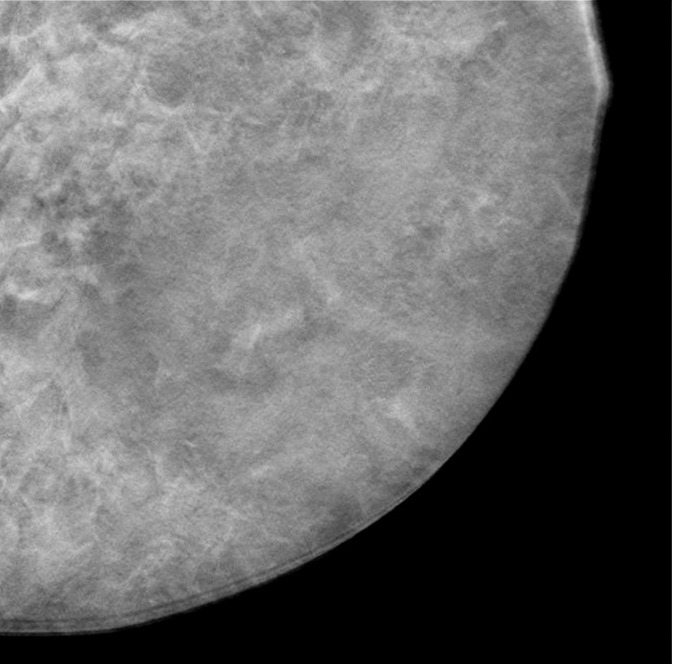
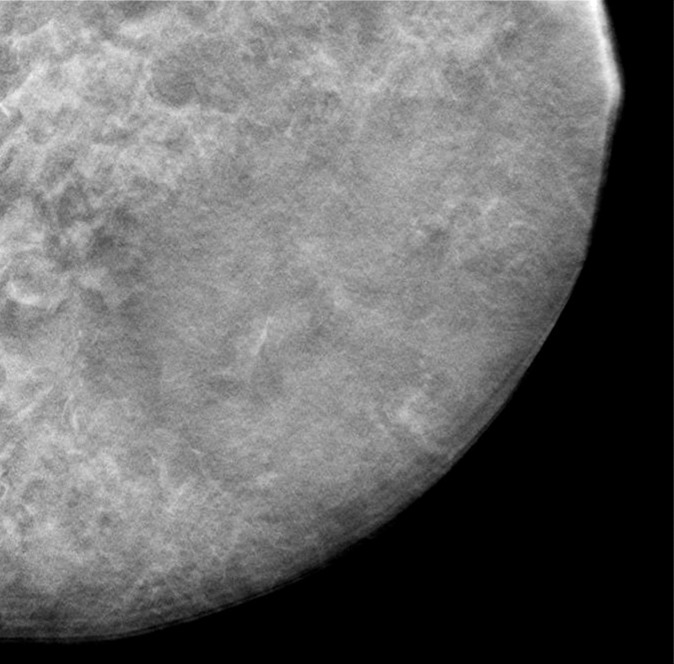
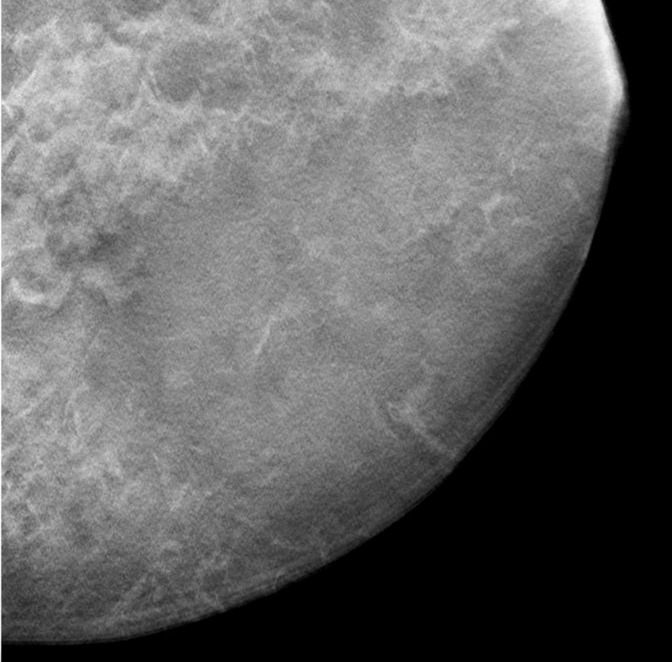
A contact x-ray image of one of the 1-cm-thick slabs was acquired as a reference to which the corresponding reconstructed DBT sections from the different DBT protocols were compared. Figure 3a–3d shows a 12 × 12-cm region of interest from the DBT section of the same 5-cm-thick phantom scanned with the four protocols (denoted as tomographic scan angle, angular increment, and number of projection views acquired): 16°, 1°, and 17; 24°, 3°, and nine; 40°, variable, and 13; and 60°, 3°, and 21, respectively. Figure 3e shows the same region of interest from the contact x-ray image of the slab containing the sections in Figure 3a–3d. The influence of the DBT acquisition parameters on the appearance of the background structures can be observed by comparing the images.
Figure 3a:
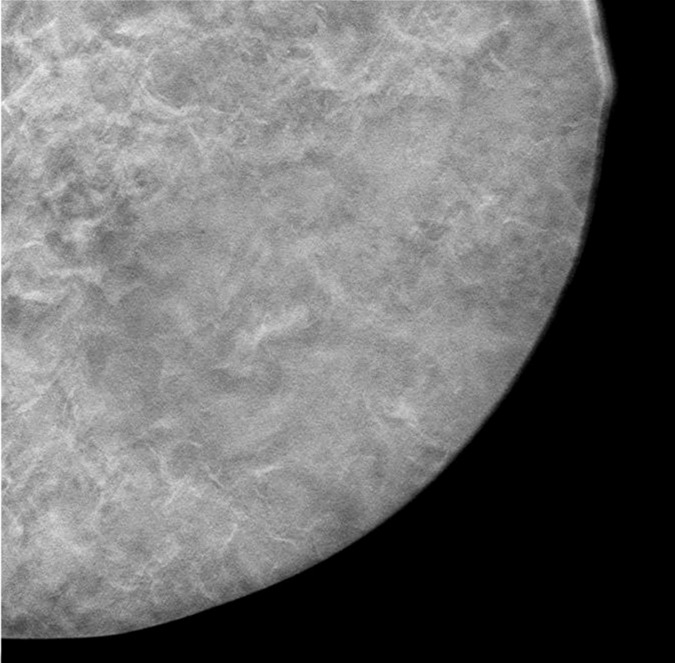
(a–d) DBT sections from a 5-cm-thick breast phantom imaged with four of the DBT scan protocols: 16°, 1°, and 17; 24°, 3°, and nine; 40°, variable, and 13; and 60°, 3°, and 21, respectively. (e) A two-dimensional projection x-ray image is shown of the 1-cm-thick slab that intersected the sections in a–d. If there is no interplane blurring, the dense tissue distribution in a–d should be similar to or even slightly cleaner than that in e, which is a superimposition of all overlapping structures inside the 10-mm-thick slab. Images a–d show that the larger the scan angle, the more similar the dense tissue distribution on the DBT sections is to that on the two-dimensional image. The additional dense tissue structures seen on the DBT sections resulted from interplane blurring from the other slabs sandwiching this slab.
Figure 3e:
(a–d) DBT sections from a 5-cm-thick breast phantom imaged with four of the DBT scan protocols: 16°, 1°, and 17; 24°, 3°, and nine; 40°, variable, and 13; and 60°, 3°, and 21, respectively. (e) A two-dimensional projection x-ray image is shown of the 1-cm-thick slab that intersected the sections in a–d. If there is no interplane blurring, the dense tissue distribution in a–d should be similar to or even slightly cleaner than that in e, which is a superimposition of all overlapping structures inside the 10-mm-thick slab. Images a–d show that the larger the scan angle, the more similar the dense tissue distribution on the DBT sections is to that on the two-dimensional image. The additional dense tissue structures seen on the DBT sections resulted from interplane blurring from the other slabs sandwiching this slab.
Figure 3b:
(a–d) DBT sections from a 5-cm-thick breast phantom imaged with four of the DBT scan protocols: 16°, 1°, and 17; 24°, 3°, and nine; 40°, variable, and 13; and 60°, 3°, and 21, respectively. (e) A two-dimensional projection x-ray image is shown of the 1-cm-thick slab that intersected the sections in a–d. If there is no interplane blurring, the dense tissue distribution in a–d should be similar to or even slightly cleaner than that in e, which is a superimposition of all overlapping structures inside the 10-mm-thick slab. Images a–d show that the larger the scan angle, the more similar the dense tissue distribution on the DBT sections is to that on the two-dimensional image. The additional dense tissue structures seen on the DBT sections resulted from interplane blurring from the other slabs sandwiching this slab.
Figure 3c:
(a–d) DBT sections from a 5-cm-thick breast phantom imaged with four of the DBT scan protocols: 16°, 1°, and 17; 24°, 3°, and nine; 40°, variable, and 13; and 60°, 3°, and 21, respectively. (e) A two-dimensional projection x-ray image is shown of the 1-cm-thick slab that intersected the sections in a–d. If there is no interplane blurring, the dense tissue distribution in a–d should be similar to or even slightly cleaner than that in e, which is a superimposition of all overlapping structures inside the 10-mm-thick slab. Images a–d show that the larger the scan angle, the more similar the dense tissue distribution on the DBT sections is to that on the two-dimensional image. The additional dense tissue structures seen on the DBT sections resulted from interplane blurring from the other slabs sandwiching this slab.
Figure 3d:
(a–d) DBT sections from a 5-cm-thick breast phantom imaged with four of the DBT scan protocols: 16°, 1°, and 17; 24°, 3°, and nine; 40°, variable, and 13; and 60°, 3°, and 21, respectively. (e) A two-dimensional projection x-ray image is shown of the 1-cm-thick slab that intersected the sections in a–d. If there is no interplane blurring, the dense tissue distribution in a–d should be similar to or even slightly cleaner than that in e, which is a superimposition of all overlapping structures inside the 10-mm-thick slab. Images a–d show that the larger the scan angle, the more similar the dense tissue distribution on the DBT sections is to that on the two-dimensional image. The additional dense tissue structures seen on the DBT sections resulted from interplane blurring from the other slabs sandwiching this slab.
Observer Study
The reconstructed DBT volumes were displayed with an in-house–developed interface on a 21-inch 5-megapixel (2048 × 2560) liquid-crystal display monitor (model EIZO SMD 21500 D; contrast ratio, 800:1; maximum luminance, 750 cd/mm2). The monitor was calibrated with the Digital Imaging and Communications in Medicine grayscale standard display function. The display monitor was similar to those used with clinical FFDM workstations. Six breast radiologists (M.A.H., M.N., C.P., M.A.R., A.V.N., C.H.N.) participated as observers. Their experience in mammography ranged from 5 to 25 years. Five of the six radiologists had previous experience in interpreting DBT images obtained in human subjects with our prototype system, acquired with a fixed protocol (60° scan angle, 3° increment, and 21 projection views acquired). Before the observer experiment, each radiologist was shown five training DBT scans of phantoms embedded with simulated microcalcification clusters that were not a part of the test set. The radiologists were given instructions for marking and rating the clusters by using the user interface of the display workstation. The radiologists were informed that there were multiple clusters with a range of visibility at multiple sections in each phantom, but they were not told the total number of clusters. They were asked to use the cursor to mark every location where they considered a cluster to be present and provide a conspicuity rating of the cluster on a scale of 1 to 10 (10 being most conspicuous).
The order of the 28 DBT volumes (four phantoms × seven acquisition protocols) interpreted by each radiologist was randomized with two constraints: (a) DBT volumes from the same phantom but different scan protocols were separated as far as possible and (b) no two DBT volumes scanned with the same protocol were adjacent to each other. The reading order of DBT volumes was different for each radiologist and was counterbalanced so that certain DBT volumes would not always be interpreted in the same order (eg, first or last) by all radiologists. The reading time was unlimited.
The significance of the difference in the sensitivity and conspicuity ratings was estimated by using Student two-tailed paired t tests (Microsoft Office Professional Plus 2010; Microsoft, Redmond, Wash) between pairs of the DBT protocols. P values less than .0024 (.05/21 with Bonferroni adjustment) were considered to indicate a significant difference.
The differences in the appearances of the microcalcifications relative to the background structures due to DBT acquisition parameters were evaluated by means of visual comparison of the clusters on the reconstructed DBT sections from the different protocols.
Results
The mean and standard deviation of the sensitivity for detecting each group of clusters estimated from the readings of the six radiologists with the seven protocols are tabulated in Table 2. The rows are arranged from the highest to the lowest mean sensitivity for the group of subtle clusters. The last column shows the overall sensitivity of detecting the clusters in all three size groups. The mean sensitivities for detecting the subtle clusters and for all clusters are plotted in Figure 4. The total number of false-positive marks indicated by the six radiologists ranged from nine to 22 for the seven conditions.
Table 2.
Sensitivity for Detection of Simulated Microcalcification Clusters with Three Levels of Subtlety, Averaged over Six Radiologists
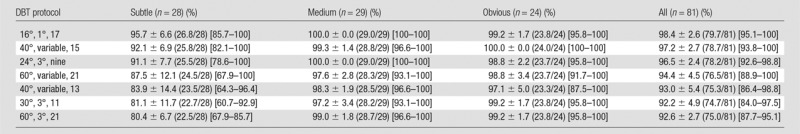
Note.—Data are means ± standard deviations. Numbers in parentheses are raw data. Numbers in brackets are ranges.
Figure 4:

Graph shows mean sensitivities for detection of the subtle clusters and for all clusters, averaged over the six radiologists, for the seven DBT protocols. The labels of the abscissa indicate the parameters of the DBT protocols denoted in the following order: tomographic angle, angular increment, and number of projections.
For the detection of subtle clusters by using the seven DBT protocols, the sensitivities varied over a relatively wide range, with the standard deviations ranging from about 7% to 14% (Table 2, Fig 4). The DBTs acquired with a narrow angle and small increment (16°, 1°, and 17) provided the highest sensitivity (96% [26.8 of 28]), while the DBTs acquired with a wide angle and larger increment (60°, 3°, and 21) had the lowest sensitivity (80% [22.5 of 28]). The sensitivities of the 16°, 1°, and 17; 40°, variable, and 15; and 24°, 3°, and nine protocols were significantly higher than that of the 60°, 3°, and 21 protocol (P < .002). The sensitivity of the 16°, 1°, and 17 protocol was higher than those of the other five protocols, but the differences did not reach significance (P = .01–.15). For the detection of medium and obvious clusters, the sensitivities were relatively stable, ranging from 97% (28.2 of 29) to 100% (24 of 24), with a standard deviation of 0%–5%; the differences in the sensitivities did not achieve significance (P = .08 to >.99).
The trend of the conspicuity ratings of the subtle clusters generally followed that of the sensitivities; higher conspicuity led to higher sensitivity, except for the protocol 30°, 3°, and 11 (Table 3). For all clusters, the conspicuity ratings for the protocol with narrow angle and small increment (16°, 1°, and 17) were higher than those for the other six protocols (Fig 5), although most of the differences did not achieve significance at the level of P < .0024 with Bonferroni correction. For subtle microcalcification clusters, the conspicuity for the 16°, 1°, and 17 protocol was significantly higher than that for the 24°, 3°, and nine protocol (P < .002). For medium microcalcification clusters, the conspicuity for the 16°, 1°, and 17 protocol was rated significantly higher than that for four of the protocols (24°, 3°, and nine; 60°, variable, and 21; 30°, 3°, and 11; and 60°, 3°, and 21 [P < .002]), but the differences fell short of significance for the 40°, variable, and 13 protocol and the 40°, variable, and 15 protocol (P < .01). The mean conspicuity of the clusters depended on their speck size as expected; the larger the specks, the higher the conspicuity. The range of mean conspicuity ratings of the same group of clusters among the seven DBT protocols was small, with the mean and the standard deviation of 3.01 ± 0.40, 5.61 ± 0.48, and 9.11 ± 0.09, respectively, for the subtle, medium, and obvious groups.
Table 3.
Conspicuity Ratings for Simulated Microcalcification Clusters with Three Levels of Subtlety, Averaged over Six Radiologists
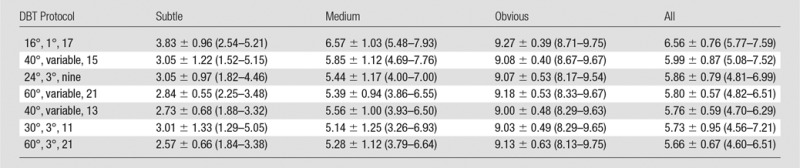
Note.—Data are means ± standard deviations. Numbers in parentheses are ranges. Conspicuity ratings ranged from 1 to 10, with 10 being most conspicuous.
Figure 5:

Graph shows mean conspicuity ratings for the subtle clusters and for all clusters, averaged over the six radiologists, for the seven DBT protocols. The labels of the abscissa indicate the parameters of the DBT protocols denoted in the following order: tomographic angle, angular increment, and number of projections.
Examples illustrating the conspicuity and the influence of the DBT acquisition parameters on the appearance of microcalcification clusters are shown in Figure 6. The images from the 16°, 1°, and 17 protocol have more obvious background structures, but the specks appear to be the sharpest and have the highest contrast, whereas the images from the 60°, 3°, and 21 protocol have the smoothest structured background, but they are noisier and the specks are less sharp and have lower contrast. The dense structures in the background of the images obtained with the 24°, 3°, and nine protocol appear to be more prominent but less noisy than those in the other images. Compared with the images obtained with the 16°, 1°, and 17 protocol, the projection views at large angles in the other three protocols reduced the interplane artifacts (see also Fig 3). However, the visibility of the microcalcification clusters, measured as the conspicuity ratings in the observer study, is dominated by the contrast and sharpness of the objects rather than the complexity of the background structures within the protocols studied.
Figure 6:

A–L, Images demonstrate examples of the clusters of the three speck size ranges, imaged with four different DBT protocols. Top row: subtle cluster (speck size range, 0.15–0.18 mm); middle row: medium cluster (speck size range, 0.18–0.25 mm); and bottom row: obvious cluster (speck size range, 0.25–0.30 mm). Protocols were as follows: left column, 16°, 1°, and 17; second column, 24°, 3°, and nine; third column, 40°, variable, and 13; and fourth column, 60°, 3°, and 21. Each cluster is shown in a region of interest with an area of 2 × 2 cm on the reconstructed DBT section where the cluster is in best focus.
Discussion
For DBT, the sharpness of small targets, such as microcalcifications, is affected by many factors, in addition to the tomographic angle, angular increment, and number of projection views. The reconstruction from multiple projection views will have blurring due to the oblique incidence angle of the x-rays onto the detector (41,42) and the oblique angle at which an x-ray intersects a DBT section of substantial thickness. For DBT systems in which the x-ray source is designed to move continuously during the exposure, there is blurring caused by focal spot motion in addition to the geometric unsharpness due to the inherent focal spot size (43). The inaccuracies in the geometric parameters of the DBT system and/or the ray-tracing algorithm will also introduce blurring on the reconstructed images (44,45). The long imaging duration required for multiple-projection image acquisition will increase the chance of patient motion. Finally, all factors that affect the image quality of the projection view mammograms and the reconstruction technique will also affect the reconstructed DBT images, of which the pixel pitch could have a major effect on small objects such as microcalcifications (38).
In our study, the DBT scans were performed with a prototype DBT system that operates in a step-and-shoot mode and records projection views with a stationary detector. The breast phantom was also stationary. Therefore, all projection views were acquired without blurring due to these factors. The same geometric parameters and ray-tracing algorithm were used for all DBT reconstructions. The major differences in blurring among different DBT protocols were those caused by oblique incidence angle onto the detector and the reconstruction of 1-mm-thick DBT sections from oblique-angle projection views. The blurring from both factors increased with increasing scan angle. Therefore, it can be expected that the DBT protocol involving the smallest scan angle (16°, 1°, and 17) provided the best visibility and detectability for subtle microcalcification clusters with our experimental conditions. To date, observations in clinical studies vary (2,13–15), probably because of the differences in the factors discussed earlier, as well as the small sample sizes used. Differences in the patient cohorts may also contribute to the differences observed in the different studies, but it will be difficult, if not impossible, to directly compare different DBT systems in the same patient cases because of concerns about radiation exposure risk. By using the same phantoms and the same x-ray imaging system in our study, were able to avoid many of these confounding factors and give a more definitive comparison of the effect of DBT acquisition parameters on the detectability of microcalcification clusters. Timberg et al (46), who used a prototype DBT system with a large scan angle (about 40°), also found that the detectability of digitally simulated calcifications in DBT was inferior to that in FFDM when imaged at the same dose in a four-alternative forced-choice observer experiment, but they did not compare large-angle acquisition with small-angle acquisition.
It is known that the scan angle affects the blurring on the DBT section and the depth direction in opposite ways (30,33,37). A larger scan angle provides better depth resolution but lowers resolution on the DBT sections. This trade-off is consistent with our results; small-angle DBT is superior for imaging small objects that require high in-plane resolution, such as microcalcifications, while large-angle DBT is superior for reducing the interplane artifact from overlapping fibroglandular tissue.
We have previously studied the effects of projection view distribution on spatial blurring and contrast-to-noise ratio of simulated microcalcifications in a phantom. In our previous study, the number of projection views was fixed, while the scan angle was varied (37). We observed the trend that the contrast-to-noise ratio of simulated microcalcifications was higher for small scan angles than for large scan angles, while the blurring along the x-ray source motion direction increased with increasing scan angle. The simulation study by Sechopoulos et al (33) showed that a protocol with a large scan angle (60°, 5°, and 13) had a much higher quality factor than the protocol with the small scan angle (16°, 1°, and 17), probably because their chosen quality measure emphasized the contrast-to-noise ratio and artifact spread function without considering the effect of blurring on the conspicuity and detectability of small objects. The simulation study by Reiser and Nishikawa (34) showed that detectability increased with increasing scan angle for objects larger than 0.5 mm in diameter, which is somewhat larger than the size range of microcalcifications of clinical interest. Their model did not include the effects of physical factors, such as detector blur and detector noise that may have a strong effect on small objects. Tucker et al (38) found that the in-plane resolution and contrast-to-noise ratio were insensitive to total scan angle and number of projection views for their stationary DBT system. Other investigators compared the detectability of masslike objects and found that large DBT scan angles were superior (31,32). Our recent observer study involving contrast-detail phantoms imaged with 12 protocols from the advanced-mode DBT system showed that observers had stronger preferences for DBT images acquired with larger scan angles for masslike objects (47).
This study had several limitations. First, to use the radiologists’ time efficiently, many clusters were included in each phantom. With this design, the readers might have been highly vigilant in searching for clusters, thereby potentially yielding higher sensitivities than if clusters occurred sparsely. However, this potential bias would affect all conditions similarly so that the effect on the relative sensitivity should be much less. Second, “normal” images were not included in the image set. The number of false-positive marks by the six radiologists was small for any of the conditions. The false-positive detections were too few to compare the relative specificity. Third, only seven protocols were included, while many other combinations of system parameters may be of interest. Fourth, this study did not include masslike objects. Fifth, although the interplane artifacts from the heterogeneous structured background of the breast phantoms in DBT acquired with narrow tomographic angle do not affect the conspicuity of the microcalcifications substantially, it is still unknown whether the same is true for real breast tissue texture. Sixth, the combined effects of the DBT acquisition parameters with other factors that affect image quality were not evaluated in this study, so that the relative importance of these factors remains a topic of future investigation.
In summary, with imaging conditions that did not include x-ray source motion or patient motion during acquisition of the projection views, narrow-angle DBT provided higher detection sensitivity and conspicuity of subtle microcalcification clusters. For optimization of DBT system design, the trade-offs between the detection of microcalcification clusters and other subtle lesions (masses, architectural distortion, and asymmetry), as well as other factors that affect image quality, need to be taken into consideration.
Advances in Knowledge
■ With imaging that did not include x-ray source motion or patient motion during acquisition of the projection views, narrow-angle digital breast tomosynthesis (DBT) provided higher detection sensitivity and conspicuity than wide-angle DBT for subtle microcalcification clusters; the sensitivity of detecting subtle microcalcification clusters with narrow-angle DBT was significantly higher than that with wide-angle DBT (96% [26.8 of 28] vs 80% [22.5 of 28], P < .002).
■ Interplane artifacts of structured background in DBT acquired with a narrow tomographic angle do not have a strong effect on the detectability of microcalcification clusters in breast phantoms.
■ A DBT system that allows imaging of the same set of simulated microcalcification clusters with variable tomographic angles, angular increments, and number of projections is useful for direct comparison of image quality and detectability without other confounding factors, such as differences in the case sets and the mechanical design and image detector of the DBT systems.
Implication for Patient Care
■ The understanding of the effect of acquisition parameters on detection of microcalcifications will help optimize the design and the performance of DBT systems.
Acknowledgments
Acknowledgments
The DBT system was developed by the GE Global Research Center, with input and some revisions from the University of Michigan investigators, through the Biomedical Research Partnership (USPHS grant CA091713; primary investigator, Paul Carson, PhD) collaboration. The content of this article does not necessarily reflect the position of the funding agencies, and no official endorsement of any equipment and product of any companies mentioned should be inferred.
Received November 29, 2013; revision requested January 16, 2014; revision received April 11; accepted April 22; final version accepted April 29.
From the 2012 RSNA Annual Meeting.
Funding: This research was supported by the National Institutes of Health (grants RO1 CA151443 and RO1 CA091713).
Disclosures of Conflicts of Interest: H.P.C. disclosed no relevant relationships. M.M.G. disclosed no relevant relationships. M.A.H. disclosed no relevant relationships. S.Z. disclosed no relevant relationships. A.S. disclosed no relevant relationships. M.N. disclosed no relevant relationships. C.P. disclosed no relevant relationships. M.A.R. Financial activities related to the present article: disclosed no relevant relationships. Financial activities not related to the present article: author received payment from Delphinus. Other relationships: disclosed no relevant relationships. A.V.N. Financial activities related to the present article: disclosed no relevant relationships. Financial activities not related to the present article: author received payment for a consultancy with GE. Other relationships: disclosed no relevant relationships. C.H.N. disclosed no relevant relationships. P.C. Financial activities related to the present article: disclosed no relevant relationships. Financial activities not related to the present article: GE Global Research was a subcontractor for a grant the author received for related work. Other relationships: disclosed no relevant relationships. Y.L. disclosed no relevant relationships. L.H. disclosed no relevant relationships. J.W. disclosed no relevant relationships.
Abbreviations:
- DBT
- digital breast tomosynthesis
- FFDM
- full-field digital mammography
References
- 1.Niklason LT, Christian BT, Niklason LE, et al. Digital tomosynthesis in breast imaging. Radiology 1997;205(2):399–406. [DOI] [PubMed] [Google Scholar]
- 2.Poplack SP, Tosteson TD, Kogel CA, Nagy HM. Digital breast tomosynthesis: initial experience in 98 women with abnormal digital screening mammography. AJR Am J Roentgenol 2007;189(3):616–623. [DOI] [PubMed] [Google Scholar]
- 3.Gur D, Abrams GS, Chough DM, et al. Digital breast tomosynthesis: observer performance study. AJR Am J Roentgenol 2009;193(2):586–591. [DOI] [PubMed] [Google Scholar]
- 4.Rafferty EA, Park JM, Philpotts LE, et al. Assessing radiologist performance using combined digital mammography and breast tomosynthesis compared with digital mammography alone: results of a multicenter, multireader trial. Radiology 2013;266(1):104–113. [DOI] [PMC free article] [PubMed] [Google Scholar]
- 5.Skaane P, Bandos AI, Gullien R, et al. Comparison of digital mammography alone and digital mammography plus tomosynthesis in a population-based screening program. Radiology 2013;267(1):47–56. [DOI] [PubMed] [Google Scholar]
- 6.Skaane P, Bandos AI, Gullien R, et al. Prospective trial comparing full-field digital mammography (FFDM) versus combined FFDM and tomosynthesis in a population-based screening programme using independent double reading with arbitration. Eur Radiol 2013;23(8):2061–2071. [DOI] [PMC free article] [PubMed] [Google Scholar]
- 7.Rose SL, Tidwell AL, Bujnoch LJ, Kushwaha AC, Nordmann AS, Sexton R, Jr. Implementation of breast tomosynthesis in a routine screening practice: an observational study. AJR Am J Roentgenol 2013;200(6):1401–1408. [DOI] [PubMed] [Google Scholar]
- 8.Michell MJ, Iqbal A, Wasan RK, et al. A comparison of the accuracy of film-screen mammography, full-field digital mammography, and digital breast tomosynthesis. Clin Radiol 2012;67(10):976–981. [DOI] [PubMed] [Google Scholar]
- 9.Gennaro G, Toledano A, di Maggio C, et al. Digital breast tomosynthesis versus digital mammography: a clinical performance study. Eur Radiol 2010;20(7):1545–1553. [DOI] [PubMed] [Google Scholar]
- 10.Wallis MG, Moa E, Zanca F, Leifland K, Danielsson M. Two-view and single-view tomosynthesis versus full-field digital mammography: high-resolution x-ray imaging observer study. Radiology 2012;262(3):788–796. [DOI] [PubMed] [Google Scholar]
- 11.Svahn TM, Chakraborty DP, Ikeda D, et al. Breast tomosynthesis and digital mammography: a comparison of diagnostic accuracy. Br J Radiol 2012;85(1019):e1074–e1082. [DOI] [PMC free article] [PubMed] [Google Scholar]
- 12.Gennaro G, Hendrick RE, Toledano A, et al. Combination of one-view digital breast tomosynthesis with one-view digital mammography versus standard two-view digital mammography: per lesion analysis. Eur Radiol 2013;23(8):2087–2094. [DOI] [PubMed] [Google Scholar]
- 13.Andersson I, Ikeda DM, Zackrisson S, et al. Breast tomosynthesis and digital mammography: a comparison of breast cancer visibility and BIRADS classification in a population of cancers with subtle mammographic findings. Eur Radiol 2008;18(12):2817–2825. [DOI] [PubMed] [Google Scholar]
- 14.Spangler ML, Zuley ML, Sumkin JH, et al. Detection and classification of calcifications on digital breast tomosynthesis and 2D digital mammography: a comparison. AJR Am J Roentgenol 2011;196(2):320–324. [DOI] [PubMed] [Google Scholar]
- 15.Kopans D, Gavenonis S, Halpern E, Moore R. Calcifications in the breast and digital breast tomosynthesis. Breast J 2011;17(6):638–644. [DOI] [PubMed] [Google Scholar]
- 16.Gur D, Zuley ML, Anello MI, et al. Dose reduction in digital breast tomosynthesis (DBT) screening using synthetically reconstructed projection images: an observer performance study. Acad Radiol 2012;19(2):166–171. [DOI] [PMC free article] [PubMed] [Google Scholar]
- 17.Sahiner B, Chan HP, Hadjiiski LM, et al. Computer-aided detection of clustered microcalcifications in digital breast tomosynthesis: a 3D approach. Med Phys 2012;39(1):28–39. [DOI] [PMC free article] [PubMed] [Google Scholar]
- 18.Chan HP, Sahiner B, Wei J, Hadjiiski LM, Zhou C, Helvie MA. Digital breast tomosynthesis: computerized detection of microcalcifications in reconstructed breast volume using a 3D approach. Proc SPIE 2010;7624:76241D. [Google Scholar]
- 19.Hadjiiski L, Chan HP, Wei J, Sahiner B, Zhou CA, Helvie MA. Digital breast tomosynthesis: feasibility of automated detection of microcalcification clusters on projections views. Proc SPIE 2010;7624:76241F. [Google Scholar]
- 20.Wei J, Chan HP, Hadjiiski L, Helvie MA, Zhou C, Lu Y. Computer-aided detection of microcalcifications in digital breast tomosynthesis (DBT): a multichannel signal detection approach on projection views. Proc SPIE 2012;8315:83152D. [Google Scholar]
- 21.Samala RK, Chan HP, Lu Y, et al. Detection of microcalcifications in breast tomosynthesis reconstructed with multiscale bilateral filtering regularization. Proc SPIE 2013;8670:86701L. [Google Scholar]
- 22.Bernard S, Muller S, Onativia J. Computer-aided microcalcification detection on digital breast tomosynthesis data: a preliminary evaluation. IWDM 2008. Lect Notes Comput Sci 2008;5116:151–157. [Google Scholar]
- 23.Reiser I, Nishikawa RM, Edwards AV, et al. Automated detection of microcalcification clusters for digital breast tomosynthesis using projection data only: a preliminary study. Med Phys 2008;35(4):1486–1493. [DOI] [PMC free article] [PubMed] [Google Scholar]
- 24.van Schie G, Karssemeijer N. Noise model for microcalcification detection in reconstructed tomosynthesis slices. Proc SPIE 2009;7260:72600M. [Google Scholar]
- 25.Lu Y, Chan HP, Wei J, Hadjiiski LM. Selective-diffusion regularization for enhancement of microcalcifications in digital breast tomosynthesis reconstruction. Med Phys 2010;37(11):6003–6014. [DOI] [PMC free article] [PubMed] [Google Scholar]
- 26.Lu Y, Chan HP, Wei J, Hadjiiski L, Zhou C. Multiscale regularized reconstruction for enhancing microcalcification in digital breast tomosynthesis. Proc SPIE 2012;8313:831322. [Google Scholar]
- 27.Sidky EY, Pan X, Reiser IS, Nishikawa RM, Moore RH, Kopans DB. Enhanced imaging of microcalcifications in digital breast tomosynthesis through improved image-reconstruction algorithms. Med Phys 2009;36(11):4920–4932. [DOI] [PMC free article] [PubMed] [Google Scholar]
- 28.Das M, Gifford HC, O’Connor JM, Glick SJ. Penalized maximum likelihood reconstruction for improved microcalcification detection in breast tomosynthesis. IEEE Trans Med Imaging 2011;30(4):904–914. [DOI] [PMC free article] [PubMed] [Google Scholar]
- 29.Acciavatti RJ, Maidment ADA. Observation of super-resolution in digital breast tomosynthesis. Med Phys 2012;39(12):7518–7539. [DOI] [PMC free article] [PubMed] [Google Scholar]
- 30.Hu YH, Zhao B, Zhao W. Image artifacts in digital breast tomosynthesis: investigation of the effects of system geometry and reconstruction parameters using a linear system approach. Med Phys 2008;35(12):5242–5252. [DOI] [PMC free article] [PubMed] [Google Scholar]
- 31.Gifford HC, Didier CS, Das M, Glick SJ. Optimizing breast-tomosynthesis acquisition parameters with scanning model observers. Proc SPIE 2008;6917:69170S. [Google Scholar]
- 32.Chawla AS, Lo JY, Baker JA, Samei E. Optimized image acquisition for breast tomosynthesis in projection and reconstruction space. Med Phys 2009;36(11):4859–4869. [DOI] [PMC free article] [PubMed] [Google Scholar]
- 33.Sechopoulos I, Ghetti C. Optimization of the acquisition geometry in digital tomosynthesis of the breast. Med Phys 2009;36(4):1199–1207. [DOI] [PubMed] [Google Scholar]
- 34.Reiser I, Nishikawa RM. Task-based assessment of breast tomosynthesis: effect of acquisition parameters and quantum noise. Med Phys 2010;37(4):1591–1600. [DOI] [PMC free article] [PubMed] [Google Scholar]
- 35.Zhang Y, Chan HP, Goodsitt MM, Schmitz A, Eberhard J, Claus B. Investigation of different PV distributions in digital tomosynthesis mammography (DTM). Proceedings of the 9th International Workshop on Digital Mammography, 2008; LNCS 5116: 593–600. [Google Scholar]
- 36.Mertelmeier T, Ludwig J, Zhao B, Zhao W. Optimization of tomosynthesis acquisition parameters: angular range and number of projections. Proceedings of the 9th International Workshop on Digital Mammography, 2008; LNCS 5116: 220–227. [Google Scholar]
- 37.Lu Y, Chan HP, Wei J, et al. Image quality of microcalcifications in digital breast tomosynthesis: effects of projection-view distributions. Med Phys 2011;38(10):5703–5712. [DOI] [PMC free article] [PubMed] [Google Scholar]
- 38.Tucker AW, Lu J, Zhou O. Dependency of image quality on system configuration parameters in a stationary digital breast tomosynthesis system. Med Phys 2013;40(3):031917. [DOI] [PMC free article] [PubMed] [Google Scholar]
- 39.Chan HP, Goodsitt MM, Helvie MA, et al. Digital breast tomosynthesis (DBT): observer performance study of microcalcification cluster detection in breast phantom DBT acquired with variable tomographic angles, angular increments, and number of projections [abstr]. In: Radiological Society of North America Scientific Assembly and Annual Meeting Program. Oak Brook, Ill: Radiological Society of North America, 2012; 61. [Google Scholar]
- 40.Zhang Y, Chan HP, Sahiner B, et al. A comparative study of limited-angle cone-beam reconstruction methods for breast tomosynthesis. Med Phys 2006;33(10):3781–3795. [DOI] [PMC free article] [PubMed] [Google Scholar]
- 41.Mainprize JG, Bloomquist AK, Kempston MP, Yaffe MJ. Resolution at oblique incidence angles of a flat panel imager for breast tomosynthesis. Med Phys 2006;33(9):3159–3164. [DOI] [PubMed] [Google Scholar]
- 42.Freed M, Park S, Badano A. A fast, angle-dependent, analytical model of CsI detector response for optimization of 3D x-ray breast imaging systems. Med Phys 2010;37(6):2593–2605. [DOI] [PMC free article] [PubMed] [Google Scholar]
- 43.Qian X, Tucker A, Gidcumb E, et al. High resolution stationary digital breast tomosynthesis using distributed carbon nanotube x-ray source array. Med Phys 2012;39(4):2090–2099. [DOI] [PMC free article] [PubMed] [Google Scholar]
- 44.Li X, Da Z, Liu B. Sensitivity analysis of a geometric calibration method using projection matrices for digital tomosynthesis systems. Med Phys 2011;38(1):202–209. [DOI] [PubMed] [Google Scholar]
- 45.Mainprize JG, Bloomquist A, Wang X, Yaffe MJ. Dependence of image quality on geometric factors in breast tomosynthesis. Med Phys 2011;38(6):3090–3103. [DOI] [PubMed] [Google Scholar]
- 46.Timberg P, Baath M, Andersson I, Mattsson S, Tingberg A, Ruschin M. Visibility of microcalcification clusters and masses in breast tomosynthesis image volumes and digital mammography: a 4AFC human observer study. Med Phys 2012;39(5):2431–2437. [DOI] [PubMed] [Google Scholar]
- 47.Goodsitt MM, Chan HP, Hadjiiski LM, et al. Digital breast tomosynthesis: reader study of the effects of acquisition geometry on the perception of contrast-detail test objects [abstr]. In: Radiological Society of North America Scientific Assembly and Annual Meeting Program. Oak Brook, Ill: Radiological Society of North America, 2013; 176. [Google Scholar]