

Abstract
Originally discovered in C. elegans, microRNAs (miRNAs) are small RNAs that regulate fundamental cellular processes in diverse organisms. MiRNAs are encoded within the genome and are initially transcribed as primary transcripts that can be several kilobases in length. Primary transcripts are successively cleaved by two RNase III enzymes, Drosha in the nucleus and Dicer in the cytoplasm, to produce ~70 nucleotide (nt) long precursor miRNAs and 22 nt long mature miRNAs, respectively. Mature miRNAs regulate gene expression post-transcriptionally by imperfectly binding target mRNAs in association with the multiprotein RNA induced silencing complex (RISC). The conserved sequence, expression pattern, and function of some miRNAs across distinct species as well as the importance of specific miRNAs in many biological pathways have led to an explosion in the study of miRNA biogenesis, miRNA target identification, and miRNA target regulation. Many advances in our understanding of miRNA biology have come from studies in the powerful model organism C. elegans. This chapter reviews the current methods used in C. elegans to study miRNA biogenesis, small RNA populations, miRNA–protein complexes, and miRNA target regulation.
I. Introduction
microRNAs (miRNAs) play a major role in regulating many important processes including cellular differentiation and proliferation, developmental timing, hematopoiesis, immune responses, apoptosis, and nervous system patterning (Fineberg et al., 2009; Gangaraju and Lin, 2009; Latronico and Condorelli, 2009; Negrini et al., 2009; O’Connell et al., 2010; Subramanian and Steer, 2010). Consequently, alterations in miRNA levels, timing of expression, or target recognition can have devastating consequences including cancer (Kai and Pasquinelli, 2010; Medina and Slack, 2008).
Most miRNAs are transcribed by RNA polymerase II as independent transcripts or as RNAs embedded within introns of protein-coding messenger RNAs (Davis and Hata, 2009). These miRNA transcripts, called primary miRNAs, are capped, polyadenylated, and can be several thousand nucleotides (nt) long (Davis and Hata, 2009). Primary miRNAs are successively cleaved into ~70 nt hairpin precursor miRNAs and then to 22 nt mature miRNAs by two RNase III enzymes respectively called Drosha and Dicer (DRSH-1 and DCR-1 in C. elegans) (Davis and Hata, 2009). Mature miRNAs guide the argonaute protein ALG-1/2 to a specific target mRNA (Grishok et al., 2001; Okamura et al., 2004). In animals, the mature miRNA is imperfectly complementary to the target site and though most miRNA-ALG-1/2 complexes bind to the 3′UTR, target binding can also occur in the 5′UTR, exons, and introns (Davis and Hata, 2009; Zisoulis et al., 2010). ALG-1/2 associates with the RISC to regulate gene expression by inhibiting translation or triggering degradation of the target mRNA (Chekulaeva and Filipowicz, 2009).
Originally discovered in C. elegans as genes that regulate developmental timing, miRNAs regulate fundamental processes in diverse organisms and are often conserved between species (Lee et al., 1993; Pasquinelli et al., 2000; Reinhart et al., 2000). This conservation, as well as the availability of miRNA mutants makes C. elegans an important system to study the mechanisms of miRNA biogenesis, target identification, and function (Kato and Slack, 2008).
This chapter details current methods used to isolate miRNA species, analyze primary, precursor, and mature miRNA expression, map the 5′ and 3′ ends of miRNA primary and cleavage products, identify small RNA populations, analyze miRNA–protein complexes, and construct reporters and transgenic strains to analyze miRNA target regulation. Though specific for the analysis of small RNAs, these methods can also be adapted to study mRNA expression or mRNA–protein interactions.
II. Rationale, Methods, and Materials
I. Total RNA Isolation
Though standard protocols can be used for RNA isolation in C. elegans, to ensure isolation of high-quality RNAs of all sizes, including small 22 nt mature miRNAs, the following double-RNA-extraction method is preferred. This method is based upon the Trizol RNA isolation protocol (Invitrogen) and can be used to isolate RNA from embryos or larval and adult stage worms. RNA generated from this procedure can be used for any application, including those described in Sections II to V.
A. Worm Collection and Preparation for RNA Isolation
For analysis of miRNA expression at specific developmental time points, plate synchronized larval stage 1 (L1) worms on the appropriate bacterial food source and wash worms off plates with M9 at the desired time point. Rock worms in M9 (22 mM KH2PO4, 42 mM Na2HPO4, 85.5 mM NaCl, 1 mM MgSO4) in 15 mL conical tubes for 20 min to allow digestion of bacterial food. Pellet worms with centrifugation and transfer to 1.5 mL tubes. Pellet again, remove excess liquid, and snap-freeze in a dry ice–ethanol bath. Worm pellets of 50–100 μL will yield at least 50 μg of total RNA.
B. RNA Isolation Method
Add ~100 μL of Trizol (Invitrogen) to the frozen worm pellet for a total volume of 200 μL. Grind worms in Trizol with a hand-held electric homogenizer that fits 1.5 mL tubes until the solution is cloudy and no clumps are visible. Add 800 μL of Trizol to lysed sample, mix, and let sit at room temperature (RT) for at least 5 min. After all samples have been homogenized as above, add 200 μL of chloroform: isoamyl alcohol (24:1) to each sample, shake for 30 s, and let sit at RT for 3 min. Spin samples at 12,000g for 15 min at 4 °C. Transfer the RNA-containing supernatant to an equal volume of chloroform: isoamyl alcohol. Shake to mix, and spin at top speed for 5 min at RT. Transfer the supernatant to an equal volume of isopropanol and 1 μL of 20 mg/mL glycogen. Mix samples briefly and incubate at −20 °C for at least 1 h, which is important for efficiently precipitating small RNAs. Spin samples at 12,000 g for 10 min at 4 °C. Carefully remove the supernatant and add 1 mL of 75% ethanol to the RNA pellet. Spin samples at 12,000 g for 5 min at 4 °C. Carefully remove all of the supernatant. Briefly dry pellets in a 50–58 °C oven for ~5 min or at RT for ~10 min. Resuspend pellets in 200 μL of DEPC water preheated to ~68 °C. It is very important to thoroughly resuspend the RNA at this step and ensure that the pellet has gone into solution entirely.
Next, a second RNA-extraction step is performed to further purify the RNA. If samples are to be analyzed by RT-PCR, a DNase treatment can be performed as described below in Section II before continuing with the second RNA extraction. Add 20 μL of 3 M NaOAc pH 5.2 and 220 μL of phenol:chloroform:isoamyl alcohol (25:24:1) to each RNA sample. Vortex briefly to mix, and spin at top speed for 5 min at RT. Transfer supernatant to 220 μL of choloroform:isoamyl alcohol (24:1). Vortex briefly and spin at top speed for 5 min at RT. Transfer supernatant to 220 μL of isopropanol and 1 μL of 20 mg/mL glycogen. Vortex samples briefly and precipitate by incubating at −20 °C for at least 1 h. Spin samples at 12,000 g for 10 min at 4 °C. Carefully remove the supernatant and add 1 mL of 75% ethanol to the pellet. Spin samples at 12,000 g for 5 min at 4 °C. Carefully remove all of the supernatant. Briefly, dry pellets in a 50–58 °C oven for ~5 min or at RT for ~10 min. Depending on the pellet size, resuspend pellets in 30–50 μL of DEPC water preheated to ~68 °C. Determine RNA concentration by diluting RNA 100-fold in 1 × Tris EDTA (TE) buffer pH 7.4 and analyzing the A260 value by spectrophotometry. Pure RNA typically has an A260/A280 reading of 1.8–2. An A260/A230 ratio less than 2 or 1.5 signifies contamination by genomic DNA or extraction chemicals, respectively.
II. Analysis of Primary, Precursor, and Mature miRNA Expression
Mature 22 nt miRNAs originate from genome-encoded primary miRNA (pri*miRNA) transcripts that are mostly transcribed by RNA polymerase II, capped, polyadenylated, and multiple kilobases in length (Davis and Hata, 2009). Cleavage of the pri-miRNA in the nucleus by the RNase III enzyme Drosha in association with Pasha produces the ~70 nt precursor miRNA (pre-miRNA) hairpin (Davis and Hata, 2009). Further cleavage by the RNase III enzyme Dicer in the cytoplasm releases the 22 nt mature miRNA (Davis and Hata, 2009). Regulation of mature miRNA levels can be accomplished by controlling any step in the miRNA biogenesis pathway (Winter et al., 2009). Though some control mechanisms ubiquitously affect miRNA expression, others are specific for particular miRNAs (Kai and Pasquinelli, 2010; Winter et al., 2009). To gain a complete understanding of miRNA expression and determine the mechanisms controlling miRNA biogenesis, analysis of pri-, pre-, and mature miRNA levels is necessary.
C. Analysis of Primary miRNAs by Agarose Northern Blotting
This method allows concurrent analysis of multiple pri-miRNA isoforms, depending on sufficient differences in their sizes. For example, the three pri-let-7 transcripts or two pri-lin-4 transcripts in C. elegans can be resolved by denaturing 1% agarose gels and detected by this northern blotting protocol (Bracht et al., 2004; Bracht et al., 2010; Van Wynsberghe et al., 2011). The northern blotting protocol is comparable to that used to detect mRNAs except that the often low abundance of pri-miRNAs necessitates that at least 10 μg of total RNA, prepared by the method described above in Section I, is used for each sample.
1. Running and Transferring
Make a 1% agarose gel in MOPS/EDTA running buffer (40 mM MOPS pH 7.0, 2 mM EDTA). Prepare samples by adding 10 μg of total RNA in a total volume of 10 μL to 15 μL of MOPS/EDTA running buffer and 5 μL of 37% formaldehyde. Heat samples at 70°C for 10min and then transfer to ice for 1min. Add 6 μL of 6× glycerol loading buffer (30% glycerol, 0.25% bromphenol blue, 0.25% xylene cyanol) to each sample before loading. Run the gel at 80 to 125 V for at least 2 h. Visualization of the rRNA bands by ethidium bromide (EtBr) staining is used to confirm even loading and nondegraded RNA samples before proceeding with northern blotting. Rinse gel gently in sterile water with shaking. Equilibrate membrane (Bio-Rad Zeta Probe GT), cut to the same size as the gel, in ddH2O followed by 10× SSC (3 M NaCl, 0.3 M sodium citrate, pH 7.0). Assemble the transferring setup at RT by layering: glass tray containing 10× SSC, upside-down gel casting tray, two sheets of Whatman 3MM paper wetted in 10× SSC with ends dipped in the 10× SSC in the glass tray to act as wicks, gel with bottom side facing up, membrane, three pieces of Whatman 3MM paper wetted in 10× SSC and cut to the size of the membrane, a stack of paper towels 5–10 cm high and cut to the size of the gel, and a light weight evenly stacked on top. Allow transfer to occur at least 6 h and up to overnight.
2. Prehybridization, Probe Preparation, and Hybridization
Briefly rinse the membrane in 6× SSC to remove any agarose particles. Place the side of the membrane that contacted the gel facing up on a piece of dry Whatman 3MM paper and cross-link at 1200 μJ × 100 by using a Spectrolinker XL-1000 UV Crosslinker. Sandwich the membrane between dry Whatman 3MM paper and bake in an oven at 80°C for 30 min. Incubate the membrane at 58–60°C with agitation for at least 2 h in a sealed bag containing 25–50 mL of prehybridization solution [5 × SSC, 7% SDS, 20 mM sodium phosphate, 0.1 mg/mL boiled, sheared salmon sperm DNA, and 1 × Denhardt’s solution (5 g of Ficoll, 5 g of polyvinylpyrrolidone, and 5 g of BSA in 500 mL of ddH2O)].
Multiple methods can be used to make a radioactive probe to target the pri-miRNA of interest. A simple, common method is based on the Prime-it II Random Primer Labeling Kit (Stratagene), which requires only a gel-purified, 500–1500 bp PCR product of the desired target and 80 μCi of alpha-32P dATP (6000 Ci/mmol). Add probe to 25–50 mL of fresh prehybridization solution. Remove the original prehybridization solution from the blot container before adding the fresh probe solution. Incubate blot in probe solution at 58–60 °C with agitation for at least 4 h or up to overnight.
3. Washing, Viewing, and Stripping
Probe solution can be stored at −20°C and reused. Remove the blot from the bag and transfer to a container with a fitted lid. Wash the blot twice at 58–60°C for 10 min in high salt wash solution (3× SSC, 10× Denhardt’s solution, 5% SDS, and 25 mM sodium phosphate), flipping the blot after 5 min for each wash. Wash the blot once at 58–60°C for 10 min in low salt wash solution (0.5 × SSC and 1.5% SDS). Repeat wash in low salt wash solution if the radioactive signal on the blot is too high or not specific. Wrap membrane in plastic wrap and expose to film or a phosophoimager screen. To strip the blot, incubate membrane in boiling 0.1% SDS with agitation. Repeat until radioactive signal is no longer detected.
D. Analysis of Precursor and Mature miRNAs by PAGE Northern Blotting
To ensure detection of pre- and mature miRNAs at least 20 μg of total RNA, prepared by the method described above in Section I, is recommended for each sample.
1. Running and Transferring
To visualize both pre- and mature miRNAs, make an 11% denaturing, urea PAGE gel (Sequagel, National Diagnostics). Pre-run PAGE gel in 0.5× Tris Borate EDTA (TBE) buffer at 150 V for 30 min. Prepare RNA samples by mixing 20 μg of total RNA in a final volume of 15 μL with an equal volume of 1× formamide loading dye (10 mM EDTA, 80% deionized formamide, and 1 mg/mL xylene cyanol and bromphenol blue dye mix). Heat RNA samples at 65°C for 10 min before loading. Run gel at 150 Vuntil the bromphenol blue dye is at the bottom of the gel, ~1.5 h for 10 cm × 10 cm gel size. Stain PAGE gel with EtBr to visualize rRNA bands and confirm even loading and nondegraded RNA samples. Equilibrate membrane (Zeta-Probe GT, Bio-Rad) cut to the same size as the gel in water followed by 0.5× TBE. Assemble transfer apparatus by layering: plastic holder, sponge pad wetted in 0.5× TBE, two sheets of Whatman 3MM paper cut to the size of the gel and wetted in 0.5× TBE, gel, membrane, two sheets of Whatman 3MM paper prepared as before, sponge pad wetted in 0.5× TBE, and the plastic holder. Transfer at 200 mA at 4°C for 2–4 h. In our experience, wet transfer methods are much more reliable than semidry dry methods for transfer of small RNAs for northern blotting analyses.
2. Prehybridization, Probe Preparation, and Hybridization
Place membrane RNA side up on a piece of dry Whatman 3MM paper and cross-link at 1200 μJ ~100 by using a Spectrolinker SL-1000 UV Crosslinker. Sandwich membrane between dry Whatman 3MM paper and bake in an oven at 80°C for 30 min. Depending on the miRNA GC content, incubate blot at 40–50°C with agitation for at least 2 h in a sealed bag containing 25 mL prehybridization solution.
Multiple methods can be used to make a radioactive probe to target the mature miRNA of interest. A simple, common method is based on the microRNA Starfire Kit (IDT DNA) that requires an oligo complimentary to the miRNA of interest and containing the proprietary starfire sequence (IDT DNA) and 80 μCi of alpha-32P dATP (6000 Ci/mmol). For more abundant miRNAs, a probe can be made by labeling a DNA oligo complementary to the miRNA of interest. To do this incubate 25 pmol of the DNA oligo with γ32PATP (6000 Ci/mmol), T4 polynucleotide kinase (PNK) buffer, and T4 PNK enzyme at 37°C for 1 h. Add the probe to 25 mL of fresh prehybridization solution. Remove the original prehybridization solution from the blot container before adding the fresh probe solution. Incubate the blot in probe solution at 40–50°C with agitation for at least 4 h or up to overnight.
3. Washing, Viewing, and Stripping
Probe solution can be stored at −20°C and reused. Blots should be washed, viewed, and stripped as described above for agarose northern blotting.
E. Analysis of Primary, Precursor, and Mature miRNAs by qRT-PCR
This analysis allows detection of miRNAs from a small amount of starting material, but does not distinguish between differently sized primary miRNA isoforms, or determine the origin of pre-miRNA since pre-miRNA is contained within pri-miRNA (Bracht et al., 2010; Van Wynsberghe et al., 2011). Inclusion of a control sample that lacks reverse transcriptase will test if any amplification is caused by genomic DNA. SYBR Green or Taqman qRT-PCR can be performed. Taqman qRT-PCR is more specific than SYBR Green qRT-PCR because of the additional probe, but it is also more costly. qRT-PCR can be performed in one step or in two steps of cDNA synthesis and qPCR. Both methods are detailed below. Reactions should be done in duplicate or triplicate to reduce erroneous results due to pipetting error. A nontemplate control reaction should also be included and a dissociation curve should be calculated to determine if nonspecific primer interactions occur.
1. Primer Selection
Primary miRNAs can be amplified by selecting primers near to but not included in the pre-miRNA hairpin, while precursor miRNAs can be amplified by selecting primers within the hairpin. Since all pre-miRNAs are contained within pri-miRNAs, the origin of amplification occurring from pre-miRNA hairpin primers cannot be specifically assigned. However, comparison of signal from pre- and pri-miRNA primer sets can determine the amount of pre-miRNA signal derived from pri- or pre-miRNA (Van Wynsberghe et al., 2011). Primers should have a Tm between 58 and 60°C, a GC content between 30% and 80%, and the 5 nt at the 3′ end of the primer should have no more than two G or C nts. Amplicons should be less than 200 nt. Analysis of mature miRNAs by qPCR presents additional problems due to their small size, but can be accomplished by adding linkers to the mature miRNA (Benes and Castoldi, 2010). Below we detail methods for analyzing pri- and pre-miRNA levels by 1 and 2 step qPCR.
2. DNase Treatment
RNA prepared as described above in Section I is generally devoid of DNA contamination, but a DNase treatment of total RNA is recommended before RT-PCR. This step can be performed between the first Trizol RNA extraction and the second phenol extraction as described above in Section I. To the RNA resuspended in 200 μL of DEPC water add 10 μL of RQ1 DNase and 23 μL of 10× RQ1 DNase buffer (Promega). Incubate at 37°C for 1 h before adding 1 μL of stop solution (Promega). Proceed with second RNA phenol extraction as described above in Section I.
3. One-Step qRT-PCR
The amount of total RNA and primers used in this reaction may need to be optimized depending on the abundance of the particular transcript being analyzed. In general 0.5 μg of total RNA and 6.25 pmol of both forward and reverse primers are added to a minimum 20 μL reaction volume containing 1 × RT Enzyme Mix, 1 × RT-PCR Mix, and the Taqman probe if performing a Taqman reaction (Applied Biosystems). Increasing the reaction volume will decrease pipetting error but increase the cost per reaction. Many companies sell kits or individual reagents for qRT-PCR including Applied Biosystems and Bio-Rad. Reactions are run in a qPCR thermocycler set to perform the following protocol: (1) 30 min at 48°C, (2) 10 min at 95°C, (3) 40 cycles of 15 s at 95°C and 1 min at 60°C, and (4) hold at 4 °C.
4. Two-Step qRT-PCR
Add 2.5 to 5μg of total, DNase-treated RNA to 30 pmol of oligo dT or random primers and 1 μL of 10 mM dNTP in a 12 μL reaction. Incubate at 65°C for 5 min followed by ice for 1 min. Add 4 μL of 5× buffer, 2 μL of 0.1 M DTT, and 40 U of RNasin (Promega). Incubate at 42°C for 2 min before adding 200 U of Superscript III Reverse Transcriptase (Invitrogen). Incubate at 42°C for 50 min and 70°C for 15 min. Add 2 U of RNaseH (Invitrogen), and incubate at 37°C for 30 min. Dilute an aliquot of the cDNA reaction 1:5 for use in qPCR. As mentioned above the amount of cDNA and primers used in this reaction may need to be optimized depending on the abundance of the particular transcript being analyzed. In general, 1 μL of cDNA diluted 1:5 and 6.25 pmol of both forward and reverse primers are added to a minimum 20 μL reaction volume containing 1× SYBR Green PCR Mastermix and the Taqman probe if performing a Taqman reaction (Applied Biosystems). Increasing the reaction volume will decrease pipetting error but increase the cost per reaction. Reactions are run in a qPCR thermocycler set to perform the following protocol: (1) 2 min at 48°C, (2) 10 min at 95°C, (3) 40 cycles of 15 s at 95°C and 1 min at 60°C, (4) hold at 4°C.
III. RACE Mapping of miRNA Primary and Cleavage Products
Mature miRNAs originate from genome-encoded primary miRNA transcripts that are often multiple kilobases in length (Davis and Hata, 2009). Primary miRNA transcripts can be encoded within an intron in the same or opposite direction as its host gene, or transcribed independently of protein-coding genes (Davis and Hata, 2009). Some miRNAs are clustered together within the same primary miRNA transcript (Davis and Hata, 2009). Identification of primary miRNA transcripts defines miRNA clusters, allows further characterization of primary miRNA expression patterns both through proper promoter–fusion reporter analysis, as described below in Section VI, and primary miRNA analysis as described above in Section II. Identification of primary miRNA transcripts also enhances identification of cis and trans transcription elements. Here we describe RACE (Random Amplification of cDNA Ends) methods for the identification of 5′ and 3′ primary miRNA transcript ends (Bracht et al., 2004; Bracht et al., 2010).
Similar RACE methods can also be used to identify and characterize cleavage products of Drosha processing (Bracht et al., 2010; Van Wynsberghe et al., 2011). In doing so, this method provides a more sensitive method than northern blotting to determine if precursor miRNA is produced. This method identifies the site of Drosha processing, which can vary throughout development. Additionally, this method determines if 3′ end modification, like uridylation, of precursor miRNA occurs. 5′ or 3′ Drosha cleavage fragments destined for degradation can also be identified.
F. 5′ and 3′ RACE to Identify Ends of Primary Transcripts
This method is adapted from the GeneRacer Kit (Invitrogen) and requires 1–5 μg RNA isolated as described above in Section I. Dephosphorylate RNA by incubating total RNAwith 40 U of RNaseOut and 1 U of calf intestinal phosphatase (CIP) in 1× CIP buffer (Invitrogen) at 50°C for 1 h. Extract RNA as described above in the second RNA-extraction step of Section I. After precipitation, resuspend the RNA pellet in 7μL of DEPC water. Decap the dephosphorylated RNA by adding 40 U of RNaseOut and 0.5 U of tobacco acid pyrophosphatase (TAP) to the RNA in 1× TAP buffer (Invitrogen). Incubate at 37°C for 1 h and extract RNA as described above. Resuspend the RNA in 7μL of DEPC water after precipitation. Incubate the GeneRacer RNA Oligo (Invitrogen) with the dephosphorylated, decapped RNA at 65°C for 5 min and 4°C for 2 min. Add 40 U of RNaseOut, 5 U of T4 RNA ligase, 1 μL of 10 mM ATP, and 1 μL of 10× T4 ligase buffer. Incubate at 37°C for 1 h before extracting RNA as described above. Resuspend the ligated RNA in 10 μL of DEPC water after precipitation.
Next, the cDNA synthesis process is initiated by adding 1 μL of 50 μM GeneRacer oligo dT primer, 1 μL of 10 μM dNTP, and 1 μL of H2O to the ligated RNA and incubating at 65°C for 5 min and 4°C for 1 min. Add 4 μL of 5× First Strand Buffer, 1 μL of 0.1 M DTT, 1 μL of RNaseOut, and 1 μL of SuperScript III (Invitrogen). Incubate at 50°C for 1 h, 70°C for 15 min, and ice for 2 min. Add 2 U of RNase H and incubate at 37°C for 2 min.
To characterize the 5′ end of the cDNA, amplify cDNA with the GeneRacer 5′ primer (Invitrogen) and a gene-specific reverse primer 3′ to the mature miRNA. Use PCR conditions appropriate for the primer melting temperatures and expected product sizes with 30 cycles of amplification in a 50 μL reaction using High Fidelity Taq (Invitrogen). Clean the PCR reaction using the Qiagen PCR column purification system and elute in 50 μL of ddH2O. Use 1 μL of the first PCR reaction to perform nested RACE, using a second set of primers corresponding to the GeneRacer 5′ nested oligo (Invitrogen) and a gene-specific primer upstream of the original primer. To enable the identification of specific RACE products, also set up nested PCR reactions that contain the nested 5′ and gene-specific primers individually. Use appropriate PCR conditions with 25–30 cycles of amplification in a 50 μL reaction using High Fidelity Taq (Invitrogen). Clean the reactions as described above and use half of the reaction (25 μL) to analyze the PCR products by separation in an agarose gel. Specific products should be present in the nested PCR using both primers but not in the control reactions using the single primers. It is not uncommon for the first PCR reaction to contain faint or multiple bands that do not correspond to the potentially specific bands in the nested RACE. Additional nested primers or diagnostic restriction digestions should be used to verify RACE products corresponding to the gene of interest before proceeding to cloning. If multiple products are present and only some appear specific, gel purification can be performed to eliminate nonspecific products before cloning. Otherwise, the PCR reaction can be used directly for cloning using the TOPO reagents (Invitrogen). Cloned DNA is transformed into bacteria, cultured, and the plasmids isolated by standard methods. Restriction digestion analyses should be used to verify inserts before subjecting clones for sequencing and identification of the primary miRNA 5′ end(s).
Characterize the 3′ end of the cDNA as described above for the 5′ end cDNA analysis but use the GeneRacer 3′ primer and 3′ nested primer together with a forward gene-specific primer and a nested primer 5′ to the mature miRNA.
G. Modified RACE to Map Cleavage Sites in miRNA Processing
Drosha cleavage of miRNA primary transcripts releases the hairpin precursor miRNA, which contains 5′ monophosphate and 3′ hydroxyl groups, as well as upstream and downstream products that contain 3′ hydroxyl and 5′ monophosphate groups, respectively. Based on these chemical features, the products of Drosha processing can be analyzed by modification of the RACE methods (Bracht et al., 2010; Van Wynsberghe et al., 2011). Below we describe methods for analyzing the 3′ end of precursor miRNA and the 5′ end of 3′ Drosha cleavage products. Similar methods can also be used to characterize the 3′ end of the 5′ Drosha cleavage product as well as the 5′ end of precursor miRNA.
1. Characterization of the pre-miRNA 3′ End After Drosha Cleavage
Run 20 μg of RNA, isolated as described above in Section I, on a 15% denaturing PAGE gel alongside 10 and 25 bp ladders. Stain the gel with EtBr and cut out a band of gel in the sample lane that corresponds to the appropriate size range. Shear gel by spinning through a 0.5 mL tube with multiple 21-gauge needle holes. Elute RNA by rocking sheared gel pieces in 500 μL of 0.3 M NaCl at RT for 4 h. Transfer sample to a Spin-X Cellulose Acetate filter and spin at top speed for 2 min. Precipitate RNA with isopropanol, glycogen, and NaOAc, pH 5.2. Wash RNA pellet with 75% ethanol and resuspend the RNA pellet in 26 μL of ddH2O. Dephosphorylate gel extracted RNA by incubating with 10 U of CIP in 1× NEBuffer #3 (NEB) at 37°C for 1 h. Extract RNA as described above in the second RNA-extraction step of Section I. After precipitation, resuspend the RNA pellet in 3 μL of DEPC water. Ligate dephosphorylated RNA to a 3′ RNA linker with a 5′ phosphate group and 3′ puromycin tag by incubating RNA at 20°C overnight in a 10 μL total reaction that contains: 1× reaction buffer (Fermentas), 1 mM ATP, 0.1 mg/mL BSA, 20 U of RNasin (Promega), 10 U of T4 RNA ligase (Fermentas), and 5 μM 3′ RNA linker. Extract RNA as described above in the second RNA-extraction step of Section I. After precipitation, resuspend RNA pellet in 20 μL of ddH2O. Purify RNA by running on a 15% denaturing PAGE gel as described above. After gel extraction, precipitate RNA with isopropanol, glycogen, and NaOAc, pH 5.2. Resuspend RNA in 4 μL of H2O. Reverse transcribe by adding 1.5 μL of 10 mM oligo complementary to the 3′ RNA linker and 0.5 μL of 10 mM dNTP. Incubate at 65 °C for 5 min and 4 °C for 1 min. Add 2 μL of 5× buffer, 1 μL of 0.1 M DTT, and 0.5 μL of RNasin. Incubate at 42°C for 2 min. Add 0.5 μL of Superscript III Reverse Transcriptase (Invitrogen) before incubating at 42°C for 50 min and 70°C for 15 min. Add 0.5 μL of RNase H and incubate at 37°C for 30 min. To characterize the 3′ end of the cleavage product, amplify cDNA with a gene-specific forward primer and a reverse primer complementary to the 3′ linker. Use PCR conditions appropriate for the primer melting temperatures and expected product sizes with 30 cycles of amplification in a 50 μL reaction using High Fidelity Taq (Invitrogen). Clean the PCR reaction using the Qiagen PCR column purification system and elute in 50 μL of ddH2O. Use 1 μL of the first PCR reaction to perform a nested PCR, using a second set of primers corresponding to a gene-specific nested forward primer and a linker specific reverse nested primer. To identify specific PCR products, also set up nested PCR reactions that contain the gene-specific and 3′ nested primers individually. Use appropriate PCR conditions with 25–30 cycles of amplification in a 50 μL reaction using High Fidelity Taq (Invitrogen). Clean the reactions as described above and use half of the reaction (25 μL) to analyze the PCR products by separation in an agarose gel. Specific products should be present in the nested PCR using both primers but not in the control reactions using the single primers. If multiple products are present, perform gel purification of the specific bands before cloning. Otherwise, the PCR reaction can be used directly for cloning using the TOPO reagents (Invitrogen). Cloned DNA is transformed into bacteria, cultured, and the plasmids isolated by standard methods. Restriction digestion analyses should be used to verify inserts before subjecting clones for sequencing and identification of the 3′ cleavage site.
2. Characterize the 5′ End of 3′ Drosha Cleavage Products
Incubate GeneRacer RNA Oligo with 1–5 μg of total RNA, isolated as described above in Section I, at 65°C for 5 min and 4°C for 2 min. Add 40 U of RNaseOut, 5 U of T4 RNA ligase (Fermentas), 1 μL of 10 mM ATP, and 1 μL of 10× T4 ligase buffer (Fermentas). Incubate at 37°C for 1 h before extracting RNA as described in the second RNA-extraction step of Section I. Resuspend ligated RNA in 10 μL of DEPC water after precipitation. Reverse transcribe as described above with 1 μL of 50 μM gene-specific reverse primer. Amplify cDNA with GeneRacer 5′ primer and a gene-specific reverse primer as described above. Clean the PCR reaction and perform a nested PCR with the GeneRacer 5′ nested primer and a gene-specific reverse nested primer as described above. Analyze the nested PCR reaction, TOPO clone, and sequence as described above to identify the 5′ cleavage site.
IV. Deep Sequencing of Small RNA Populations
High-throughput “deep sequencing” technologies, such as 454 Life Science/Roche Genome Sequencer (Margulies et al., 2005), Solexa/Illumina Genome Analyzer (Bentley et al., 2008), and Applied Biosystems SOLiD System (for review see Mardis, 2008; Shendure and Ji, 2008), capable of simultaneously sequencing millions of molecules, have provided an excellent tool for small RNA profiling and discovery. Deep sequencing outperforms other existing profiling methods, such as array hybridization or qRT-PCR, in discriminating closely related RNAs, detecting 5′- or 3′-end variations and measuring absolute abundance with a better dynamic range. Furthermore, deep sequencing, unlike microarrays, allows the identification of novel small RNAs, as it is not limited by a priori sequence information. For example, Ruby et al. (2006) applied 454 pyrosequencing to small RNAs expressed in mixed-staged C. elegans and identified the class of 21U-RNAs and additional previously unknown miRNAs (Ruby et al., 2006). Our group also has used Illumina Genome Analyzer for profiling dynamic miRNA expression in C. elegans development and identifying novel miRNAs and 21U-RNAs (Kato et al., 2009).
Protocols for creating cDNA libraries of small RNAs commonly include size fractionation of RNAs, 5′- and 3′-adaptor ligation, reverse transcription, and PCR amplification (Lagos-Quintana et al., 2001; Lau et al., 2001; Lee and Ambros, 2001). These cDNA libraries are made amenable for deep sequencing by the inclusion of appropriate primer sequences. Commercially available kit systems for preparing cDNA libraries for deep sequencing also have been released. In the approaches described below, we follow the manufacturer’s instruction in the Illumina’s Small RNA Sample Prep Kit (catalog # FC-102-1009) for preparing cDNA libraries and discuss the principles of deep sequencing of C. elegans small RNA populations based on our approach using Illumina Genome Analyzer, summarized graphically in Fig. 1. These general principles are broadly applicable to other platforms.
Fig. 1.
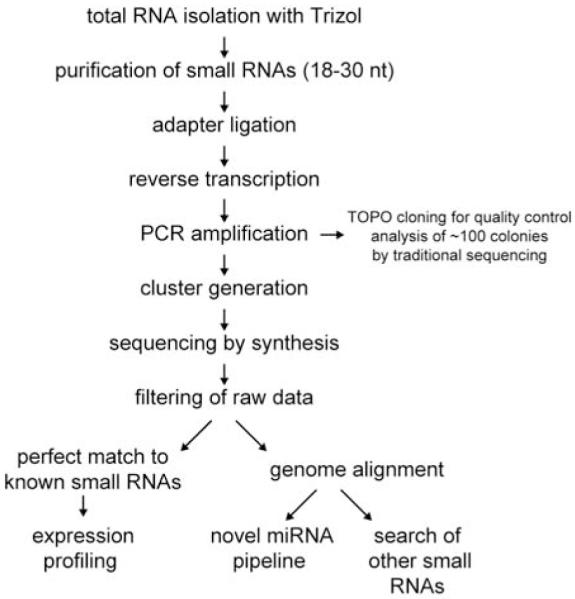
An outline of deep sequencing of small RNA populations. See text for details.
H. Small RNA Purification
Prepare 10 μg of total RNA for each experimental condition (see Section I for total RNA isolation). The integrity of RNA can be evaluated by separating RNA on a 1% agarose gel and EtBr staining. A high-quality RNA sample should show two discrete bands at 3.5 kb and 1.8 kb that represent 26S rRNA and 18S rRNA, respectively. Separate 10 μg of total RNA by electrophoresis on a 15% TBE–urea gel along with 20–100 bases ladder that should be loaded several lanes away from the total RNA sample. Stain the gel with EtBr and view the gel on a Dark Reader transilluminator (Clare Chemical Research) or a long wavelength UV transilluminator. Cut out a band of gel in the sample lane corresponding to the 18–30 nt bands in the marker lane. Elute and precipitate RNA from the gel slice (see Section III, Modified RACE to map cleavage sites). Resuspend the RNA pellet in ultrapure water.
I. cDNA Library Preparation
In order to prepare the cDNA libraries, RNA adaptors for 5′- and 3′-ends are ligated to the purified small RNAs for use in reverse transcription and PCR amplification. The 3′-adaptor also possesses a sequence that is in the reverse complementary orientation to a surface-bound amplification primer on the Illumina Genome Analyzer flowcell. The sequences of another flowcell primer and the sequencing primer will be added to the other end of the template by a PCR primer. The adaptors must be designed to take advantage of the 5′-phosphate and 3′-hydroxyl termini of small RNAs, resulting from RNase III processing. In contrast, most RNase degradation products have 5′-hydroxyl and 3′-phosphate termini. The 5′-adaptor should carry a hydroxyl group at the 3′-terminus as an acceptor for 5′-phosphate containing small RNAs, while the 3′-adaptor should carry a 5′-phosphate terminus as a donor and a non-nucleotidic moiety at the 3′-terminus to prevent circularization. Use excess amounts of adaptors over 5′-phosphate containing small RNAs to avoid circularization. Alternatively, use a 3′-adaptor with a preadenylated 5′-end and a truncated T4 RNA ligase 2, RNL2(1-249), in the absence of ATP to reduce background ligation (Hafner et al., 2008). Perform reverse transcription over the ligated RNA products and then amplify by PCR. Reagents, adaptors, primers, and detailed protocols are available from Illumina, Inc.
1. Adaptor Ligation
Dissolve purified small RNA in 5.7 μL of ultrapure water, and mix with 1.3 μL of 5′-RNA adaptor (Illumina part #1000595), 1 μL of 10× T4 RNA ligase buffer, 1 μL of RNaseOUT and 1 μL of T4 RNA ligase. Incubate the reaction mixture at 20°C for 6 h in a thermal cycler and hold at 4°C. Separate ligated RNAs by electrophoresis on a 15% TBE–urea gel along with 20–100 bases ladder and recover RNAs corresponding to 40–60 nt bands using the same elution and ethanol precipitation steps mentioned above. Dissolve purified small RNA in 6.4 μL of ultrapure water, and mix with 0.6 μL of 3′-RNA adaptor (Illumina part #1000596), 1 μL of 10× T4 RNA ligase buffer, 1 μL of RNaseOUT, and 1 μL of T4 RNA ligase. Incubate the reaction mixture at 20°C for 6 h in a thermal cycler and hold overnight at 4°C. Separate ligated RNAs by electrophoresis on a 15% TBE–urea gel along with 20–100 bases ladder and recover RNAs corresponding to 70–90 nt bands using the same elution and ethanol precipitation steps mentioned above. Dissolve the RNA pellet in ultrapure water.
2. Adaptor Ligation (Alternative)
Dissolve purified small RNA in 5 μL of ultrapure water and mix with 1 μL of 1 preadenylated 3′-sRNA adaptor (Illumina part #1000263). Incubate at 70°C for 2 min then immediately transfer onto ice. Add 1μL of 10× T4 RNL2 truncated reaction buffer (NEB), 0.8 μL of 100 mM MgCl2, 1.5 μL of T4 RNA ligase 2 truncated (NEB), and 0.5 μL of RNaseOUT. Incubate the reaction mixture in a thermal cycler at 22°C for 1 h. Then add 1 μL of 5′-RNA adaptor (Illumina part #1000595), 1 μL of 10 mM ATP, and 1 μL of T4 RNA ligase. Incubate the reaction mixture in a thermal cycler at 20°C for 1 h. Store the product at 4°C.
3. Reverse Transcription and PCR Amplification
Mix 4.5 μL of adaptor-ligated RNAs and 0.5 μL of RT primer (Illumina part #100597). Heat the mixture in a thermal cycler at 65°C for 10 min and transfer immediately onto ice. Add 2 μL of 5× first strand buffer (Invitrogen), 0.5 μL of 12.5 mM dNTP mix, 1 μL of 100 mM DTT and 0.5 μL of RNaseOUT. Heat the sample to 48°C in a thermal cycler for 3 min. Add 1 μL of SuperScript II Reverse Transcriptase (Invitrogen) and incubate the reaction mixture in a thermal cycler at 44°C for 1 h. The final volume is 10 μL. Premix 40 μL of PCR master mix with 28 μL of ultrapure water, 8 μL of 5× Phusion HF buffer (Finnzymes), 0.5 μL of Primer GX1 (Illumina part # 1000591), 0.5 μL of Primer GX2 (Illumina part #1000592), 0.5 μL of 25 mM dNTP mix, and 0.5 μL of Phusion DNA Polymerase (Finnzymes). Mix 10 μL of reverse-transcribed cDNAs and 40 μL of PCR master mix and perform the PCR reaction using the following protocol: (1) 30 s at 98°C, (2) 15 cycles of 10 s at 98°C, 30 s at 60°C, and 15 s of 72°C, (3) 10 min at 72°C, (4) hold at 4°C. Purify the PCR products (a band of approximately 92 bp in length) by separating on a 6% TBE–urea gel followed by elution and ethanol precipitation. Resuspend purified cDNA libraries in 10 μL of resuspension buffer (Illumina part # 1001388). Use 1 μL of the product for TOPO cloning and validate ~100 colonies with traditional sequencing.
J. Hybridization, Cluster Generation, and Sequencing
The following approaches require operators specifically trained in the use of Illumina Genome Analyzer. An average-size C. elegans laboratory may seek assistance or use the service of a core facility. Briefly, denature the cDNA templates by NaOH and load the sample into an Illumina Genome Analyzer flowcell. Hybridize the complementary end of each template to a flowcell primer. Perform the first extension by Taq polymerase to generate a reverse complementary copy that is tethered to the flowcell surface. Remove the not-tethered original template by flushing with NaOH. Hybridize the free end of the complementary copy strand to another flow cell primer and perform extension by Bst polymerase, generating a double-stranded product. Denature the double-stranded product by formamide and then the free ends of two single strands can anneal to another set of two flowcell primers, respectively. Repeat cycles of denaturation, annealing, and extension to generate a cluster of ~1000 double-stranded products. Cleave one of the flowcell primers and remove one strand selectively, resulting in clusters of single-stranded templates. This allows more efficient hybridization of the sequencing primer and ensures that the sequencing occurs only in one direction. Perform the sequencing by synthesis, 36 cycles of single-base extension, in the Illumina Genome Analyzer according to the manufacturer’s instruction, using a modified DNA polymerase and a mixture of four dNTPs that are labeled by four different fluorophores and also 3′ blocked. In every cycle, the fluorescence signal corresponding to the identity of incorporated nucleotide is imaged and then the fluorophore and the 3′ blocking moiety are cleaved for the next cycle. Export the raw sequence data.
K. Computational Data Analysis
Analysis of the raw sequencing data presents intense computational challenges and the methods often change based on newly proposed algorithms (Creighton et al., 2009; Shendure and Ji, 2008). The first step is to filter out unusable reads from the raw data. For example, unique sequence reads of fewer than 10 copies may be considered as potential sequencing errors and be discarded. Sequence reads that match E. coli genome database are considered as contaminations and should also be removed. In searching the small RNAs with a size around ~17–26 nt in length, given that the average length of Illumina read is ~36 nt, finding part of the 3′-adaptor in the 3′-end of the read sequence can also be used as a quality control step, while this may not apply to all noncoding RNAs.
For profiling expression of known miRNAs and 21U-RNAs, we trimmed the 3′-adaptor sequence from the reads and used an in-house alignment for perfectly matching known sequences from reference databases [miRBase (Griffiths-Jones et al., 2008) and previously annotated 21U-RNAs (Batista et al., 2008)]. The number of known small RNA reads is normalized to the total number of reads that matched the C. elegans genome (see below) and that can represent small RNA abundance. For alignment of large sets of short reads to genome databases, an increasing number of software tools have been developed, which also allow for mismatches and/or gaps (for review see Shendure and Ji, 2008). We loaded the adaptor-trimmed reads to the SOAP (short oligonucleotide alignment package) (Li et al., 2008, 2009) for matching the C. elegans genome [WormBase (Harris et al., 2010)], allowing a maximum of 2 bp mismatches in the reads. The resulting sequence reads from 17~26 nt in length that matched the C. elegans genome were considered as the total reads in the expression profiling. For examining the proportion of all noncoding RNAs in the deep sequencing database, we aligned genomematched reads to the noncoding RNA list in WormBase using Blastn, with the following parameters: –e 0.001–G 5–E 2–q-3–r 1–W 7–v 10–b 10.
1. Novel miRNA and 21U-RNA Discovery(Bracht et al., 2010)
For discovering novel miRNAs from the deep sequencing database, several software tools based on different algorithms are publicly available, including miRDeep (Friedlander et al., 2008), CID-miRNA (Tyagi et al., 2008), miRank (Xu et al., 2008), miRCat (Moxon et al., 2008), and miRanalyzer (Hackenberg et al., 2009). We have chosen miRDeep, which uses a probabilistic model scoring both the compatibility of the position and frequency of sequences with the model of miRNA biogenesis as well as the stability of the characteristic hairpin structures of predicted pre-miRNAs. We removed reads that match previously annotated noncoding RNAs and mRNAs using Blastn and also removed reads that perfectly match known miRNAs and 21U-RNAs. Then we loaded the remaining reads to miRDeep for searching for novel miRNAs and used RNAfold to predict secondary structures of putative pre-miRNA hairpins (Hofacker, 2009). For searching novel 21U-RNAs, we aligned the sequences of 21 nt in length with a 5′ uracil in the remaining reads with the C. elegans genome and judged by the previously reported characteristics of 21U-RNAs, that is, localization on chromosomes and the upstream conserved motif (Ruby et al., 2006).
V. Analysis of miRNP Complexes
miRNAs function as part of the RISC protein complex (Bartel, 2009). Multiple proteins also generally or specifically regulate miRNA biogenesis (Kai and Pasquinelli, 2010; Winter et al., 2009). Protein immunoprecipitation followed by MASS spectrometry has been done to identify proteins associated with RISC proteins (Zhang et al., 2007). RNA immunoprecipitation (RIP) experiments have been used to identify target mRNAs that associate with miRISC in vivo (Zhang et al., 2007). The use of cross-linking to stabilize endogenous RNA–protein interactions followed by immunoprecipitation of the protein complex of interest and isolation of the RNA regions protected by the complex (cross-linking and immunoprecipitation, CLIP) has enabled the identification of sequences specifically bound by miRISC (Zisoulis et al., 2010; Zisoulis et al., 2011). Additionally, RIP allows the identification of the primary, precursor, or mature miRNA that a particular protein or protein complex binds in vivo (Van Wynsberghe et al., 2011). This method requires an antibody against the protein or fusion-protein of interest. Parallel RIP analysis in a mutant worm strain automatically provides a negative control for nonspecific antibody binding. Additionally, an IgG antibody produced in the same species as the antibody of interest should be included as a negative control to determine fold-enrichment. UV-cross-linking of live worms allows endogenous RNA–protein interactions to be stabilized and avoids potential nonphysiological interactions that can happen upon extract preparation (Mili and Steitz, 2004; Van Wynsberghe et al., 2011).
In addition to CLIP and RIP experiments, which are aimed at the identification of RNA sequences that associate with proteins of interest, the characterization of the protein components of miRNA ribonucleoprotein complexes (miRNPs) contributes to the understanding of mechanistic aspects of miRNA pathways. Gel filtration and electrophoretic mobility shift assay (EMSA) allow for the estimation of the size of miRNPs both in wild-type organisms and in mutants or under designed experimental circumstances. UV-cross-linking of miRNPs assembled with radio-labeled miRNAs in EMSA experiments transfers the radioactive label to miRNA-binding proteins and can be used to visualize them on SDS-PAGE. Ultimately, affinity selection using biotinylated 2′-O-methyl oligonucleotides allows purification of miRNPs and further identification of miRNP component proteins by mass spectrometry.
L. RIP
This protocol is adapted from the Dynabeads instruction protocol (Invitrogen) and published immunoprecipitation protocols (Van Wynsberghe et al., 2011; Zhang et al., 2007; Zisoulis et al., 2010, 2011). Cross-linking of the antibody to the beads and blocking of the beads with salmon-sperm DNA is recommended to decrease background, and enhance reproducibility and specificity.
1. Worm Collection and Cross-Linking
At least 200 μL of worms collected at the appropriate stage are required for this protocol. After collection, rock worms in M9 for ~10 min to allow residual bacteria to be digested. Resuspend worms in ~200 μL of M9 ~ and plate several drops onto 2–3 100-mm worm plates. Spread worms equally around the plate. UV cross-link worms in a Spectrolinker XL-1000 UV Crosslinker with an energy output of 3 kJ/m2 at a distance of ~10 cm from the light source. Collect cross-linked worms with M9. Flash freeze worm pellet in a dry ice–ethanol bath.
2. Lysate Preparation
Crush worms in liquid nitrogen with mortar and pestle. Transfer worms to a 1.5 mL eppendorf tube containing three times the pellet volume of lysis buffer [150 mM NaCl, 25 mM HEPES pH 7.5, 0.2 mM DTT, 10% glycerol, 0.025 U/μL RNAsin, 1% Triton X-100, and protease inhibitors (Roche)]. Spin sample at top speed at 4°C for 15 min. Transfer supernatant to a new eppendorf tube and determine the protein concentration by the Bradford protein assay (Bio-Rad).
3. Preclear Lysate
At least 500 μg of lysate protein is required per sample. Equal amounts of sample should be used for each reaction (typically: antibody of interest and IgG control). Add lysate and lysis buffer in a total of 1 mL to 50 μL of Dynabeads (Invitrogen) that have been washed twice in 100 μL of WB buffer (0.1 M NaPO4, 0.1% Tween 20, pH 8.2). Rotate at 4°C for 1 h.
4. Immunoprecipitation
Wash 50 μL of Dynabeads per sample with 100 μL WB buffer. Block beads by resuspending in 180 μL of WB buffer and 20 μL of 10 μg/μL sheared, salmon-sperm DNA (ssDNA). Incubate on rotator at RT for 30 min. Add 5 μg of antibody and incubate on rotator at RT for 10 min. Wash antibody–bead complex twice with 100 μL of conjugation buffer (20 mM NaPO4, 150 mM NaCl). Incubate beads in 250 μL bis(sulfosuccinimidyl)suberate (BS3) conjugation buffer (5 mM BS3 in conjugation buffer containing 0.5 μg/μL ssDNA) at RT for 30 min with rotation. Quench cross-linking reaction by adding 12.5 μL of 1 M Tris-Cl pH 7.4 and incubating at RT for 15 min with rotation. Wash beads twice with 100 μL of lysis buffer. Add antibody-cross-linked beads to the precleared lysate from the previous step, and rotate at 4°C overnight.
Save the supernatant from the immunoprecipitation reaction for IP efficiency analysis by western blotting. Wash beads twice for 1 min in a Thermomixer R (Eppendorf) set to 4°C with: (1) wash buffer [1 × PBS pH 7.4, 0.1% SDS, 0.5% sodium deoxycholate, and 0.5% NP-40], (2) high salt wash buffer [5× PBS pH 7.4, 0.1% SDS, 0.5% sodium deoxycholate, and 0.5% NP-40], and (3) PK buffer [100 mM Tris-Cl pH 7.4, 50 mM NaCl, and 10 mM EDTA]. Resuspend beads in 100 μL of PK buffer. Remove a 15 μL aliquot of bead solution for IP efficiency analysis by western blotting. Remove excess PK buffer and resuspend beads in 100 μL of proteinase K solution (5 mg of proteinase K in 1 mL of PK buffer) at 37°C for 20 min in a Thermomixer R (Eppendorf) set to 1200 rpm. Quench reaction by adding 100 μL of PK buffer containing 7 M urea, and incubating the reaction at 37°C for 20 min at 1000rpm.
5. RNA Extraction
Extract total and immunoprecipiated RNA by adding 800 μL of Trizol (Invitrogen) directly to an aliquot of input protein lysate or the proteinase K bead solution and extracting as described above in Section I. Resuspend extracted RNA in 120 μL of DEPC H2O. Treat with DNase by adding 15 μL of 10× RQ1 DNase Buffer and 15 μL of RQ1 DNase to each sample and incubating at 37°C for 1 h. Extract RNA a second time as described above in the second RNA-extraction step of Section I. Resuspend RNA samples in 10 μL of ddH2O.
6. RT-PCR
Add 9 μL of immunoprecipitated RNA or 2.5 μg of total RNA in a 9 μL volume to 1 μL of random primers (250 ng/μL), 1 μL of 10 mM dNTPs, and 1.2 μL of ddH2O. Incubate at 65°C for 5 min and 4°C for 1 min. Add 4 μL of 5× buffer (Invitrogen), 2 μL of 0.1 M DTT, and 1 μL of RNasin (Promega). Incubate at 42°C for 2 min before adding 1 μL of Superscript III Reverse Transcriptase enzyme (Invitrogen). Incubate at 42°C for 50 min and 70°C for 15 min. Add 1 μL of RNaseH (Invitrogen), and incubate at 37°C for 30 min. Dilute an aliquot of the cDNA reaction 1:5 for use in qPCR. Analyze samples for the primary or processed miRNA or mRNA of interest by PCR or qPCR as described above in Section II.
M. Gel Filtration Analysis of miRNPs
Gel filtration has been used to fractionate cell extracts from C. elegans, Drosophila, and human cells to determine the sizes of complexes corresponding to RNAi activity, siRNAs, miRNAs, or miRNP/RISC (Caudy et al., 2002, 2003; Chan et al., 2008; Gregory et al., 2005; Pham et al., 2004). Gel filtration can also be used to detect cofractionation of proteins of interest with miRNAs or to purify fractions that possess miRNA-related activities, that is miRNA binding or pre-miRNA processing.
1. Cell Extract Preparation
Harvest mixed-staged (or staged) worms grown in S medium supplied with E. coli HB101. Clean the worms by sucrose floatation and then wash three times with 0.1 M NaCl. Store the worms at −80°C. Thaw 1 mL of packed worms on ice and wash twice with wash buffer (50 mM Tris-HCl pH 7.5 and 10 mM potassium acetate). Resuspend the worms in 4 mL of homogenization buffer [50 mM Tris-HCl pH 7.5, 10 mM potassium acetate, 5 mM DTT, 10 U/mL SuperaseIn RNase inhibitor (Ambion), 10% glycerol, and 1× Roche Complete protease inhibitor, EDTA-free] and incubate on ice for 20 min with intermittent agitation. Transfer the worms to a 7 mL glass dounce homogenizer tube (Kontes Glass Co., Vineland, N.J., article no. 885303-0007) and homogenize by 30 strokes on ice using the tight-fitting pestle B (Kontes Glass Co., Vineland, N.J., article no. 885302-0007). Transfer homogenate to a 15-mL tube and add magnesium acetate to 2 mM and adjust the concentration of potassium acetate to 100 mM. Incubate the homogenate on ice for 20 min with intermittent agitation and then aliquot the homogenate to 1.5 mL eppendorf tubes. Centrifuge the tubes at 16,100 × g at 4°C for 30 min. Store the supernatant at −80°C.
2. Gel Filtration
Equilibrate a Superdex-200 HR 10/30 column with cold homogenization buffer. Load 400 μL of cell extract into the column. Run the chromatography at 4°C at the rate of 0.35 mL per minute using AKTA FPLC (Pharmacia) and collect 60 fractions (0.5 Ll each). Use the following size markers: thyroglobulin (669 kDa), ferritin (440 kDa), catalase (232 kDa), aldolase (158 kDa), and albumin (67 kDa). For monitoring miRNAs in the fractions, mix 250 μL of fraction sample with 750 μL of Trizol LS and follow the RNA-extraction method described in Section I. Refer to Section II for a description of miRNAs detection by northern blotting. Use 10–20 μL of fraction sample for western analysis of known RISC components with appropriate antibodies.
N. EMSA of miRNPs
EMSA can be used to qualitatively identify large ribonucleoprotein complexes, for example, holo-RISC (Pham et al., 2004), or to detect miRNA-binding proteins that may only form small complexes with their substrates (Chan et al., 2008). Below, we show a basic EMSA setup using radiolabeled miRNAs and crude cell extracts. However, the design of EMSA should depend on the purpose of the experiment and the parameters, such as the gel, buffer, running temperature, and/or the presence of competitor or heparin, have to be optimized.
1. Cell Extract Preparation
See above.
2. Radiolabeled Synthetic miRNA Preparation
Obtain synthetic miRNAs from Dharmacon Research, Inc. or Integrated DNA Technologies, Inc. Mix 1 μL of 50 μM synthetic miRNA (50 pmol), 5 μL of gamma-32P ATP (6000 Ci/mmol, NEN), 2.5 μL of 10× T4 PNK buffer, 2.5 μL of T4 polynucleotide kinase, and 14 μL of RNase-free water. Incubate the reaction mixture at 37°C for 30 min. Remove free gamma-32P ATP by passing the mixture through a Sephadex G-25 column (Roche) according to the manufacturer’s instruction.
3. Native Gel Preparation
Prepare a 16 cm × 16 cm gel of 0.8 mm thickness with 1× TBE and 5% acrylamide. The ratio of acrylamide/bis-acrylamide depends on the experiment. Use 40:1 for large complexes and 19:1 for small complexes.
4. miRNA Binding Reaction and Gel Running
Prepare miRNA binding reaction mixtures (10 μL) that contain 20 mM Tris pH 7.5, 1 mM magnesium acetate, 1 mM calcium chloride, 0.01% Nonidet P-40, 2 mM ATP, 250 ng/μL E. coli tRNA, 5×10⁵ c.p.m radiolabeled miRNA and cell extract that can be used in different amounts. Incubate the reaction at RT for 45 min. Mix with 2 μL of 6 × native gel loading dye (30% glycerol, 0.25% BPB, and 0.25% xylene cyanol). Run the gel at 100 Vat 4°C until the BPB dye migrates to 3 cm from the bottom of the gel. Lay the gel onto Whatman 3MM paper and dry it using a gel dryer. Detect the signals by autoradiography or phosphoimaging.
5. UV-Cross-Linking of miRNPs
Prepare 150 μL of miRNA binding reaction mixture and separate the sample on a nondenaturing gel (see above). Do not dry the gel. Instead, expose the gel wrapped in a transparent plastic film to a BioMax MS film (Kodak) for 1 h. After autoradiography, excise gel bands that contain radioactive signals corresponding to miRNPs of interest. Place the gel slices on a clean glass plate that is sitting on ice and expose them to 254 nm UV light in Stratalinker UV Crosslinker (Stratagene) with an energy output of 2 J/cm2 at a distance of approximately 10 cm from the light source. Mince the gel slice to small pieces and incubate with 150 μL of RNase A (250 U/mL in 50 mM Tris-HCl pH 7.5 buffer) at RT for 30 min. Add 50 μL of XT sample buffer 4X (Bio-Rad) and agitate vigorously on a vortex mixer for 3 h. Analyze the eluted proteins by denaturing gel electrophoresis using a Criterion XT Bis-Tris 4–12% gradient gel (Bio-Rad) and autoradiography. To detect all UV-cross-linking signals not specific to any individual complex, irradiate 20 μL of miRNA binding reaction mixture placed in a 96-well plate on ice following RNase treatment and denaturing gel electrophoresis as mentioned above.
O. Affinity Purification of miRNPs by Biotinylated 2′-O-methyl Oligonucleotides
Antisense 2′-O-methyl oligonucleotides block siRNA and miRNA function in vitro and in vivo (Hutvagner et al., 2004). In addition, immobilized 2′-O-methyl oligonucleotides complementary to siRNAs or miRNAs capture Argonaute proteins in C. elegans extract (Hutvagner et al., 2004; Steiner et al., 2007; Yigit et al., 2006). Below, we describe an adapted procedure to purify miRNPs from C. elegans crude extract using biotinylated 2′-O-methyl oligonucleotides. The RNA or protein contents in purified miRNPs are subjected to further investigation.
1. Cell Extract Preparation
Depending on the particular miRNA of interest, harvest synchronized worms of the appropriate developmental stage. For example, to capture let-7 binding ribonucleoprotein complexes, prepare cell extract from L4 stage worms. For one volume of packed worms, use five volumes of homogenization buffer [10 mM Tris-HCl pH 7.5, 100 mM KCl, 2 mM MgCl2, 0.5% (v/v) Nonidet P-40, 15% (v/v) glycerol, 5 mM DTT, 50 U/mL SuperaseIn RNase inhibitor (Ambion) and 1× Roche Complete protease inhibitor, EDTA-free].
2. Biotinylated 2′-O-Methyl Oligonucleotides
Obtain 5′-biotinylated 2′-O-methyl oligonucleotides from Integrated DNA Technologies, Inc. In previous studies, five nucleotides complementary to the sequences flanking each side of the siRNA/miRNA target site were added to enhance the efficiency of blocking siRNA/miRNA activity (Hutvagner et al., 2004). For affinity purification of miRNPs, we found that the flanking sequences are not necessary (our unpublished observation). For example, we used a 5′-biotinylated 22-nt 2′-O-methyl oligonucleotide complementary to let-7 and a 22-nt oligonucleotide complementary to luciferase mRNA sequence as negative control.
3. Affinity Purification
Incubate 300 μL of cell extract with 15 pmol of 5′-biotinylated 2′-O-methy oligonucleotide at RT for 1 h. Subsequently, add 20 μL of Streptavidin Sepharose (GE Healthcare), pre-equilibrated with the homogenization buffer, and incubate at RT for 1 h with gentle agitation on a nutator. Centrifuge at 8000 rpm for 30 s and remove the unbound fraction. Wash five times by resuspending with 1 mL of homogenization buffer and centrifuging at 8000 rpm for 30 s each time. For analysis of purified proteins, resuspend the beads in a final volume of about 28 μL of water and add 10 μL XT sample buffer (4×) and 2 μL XT reducing agent (20×) (Bio-Rad) or 2-mercaptoethanol. Heat at 95°C for 5 min. Remove the beads by passing the sample through a Spin X cellulose acetate filter (Corning Costar). Analyze the eluted proteins by denaturing gel electrophoresis using a Criterion XT Bis-Tris 4–12% gradient gel (Bio-Rad) and western blotting with antibodies against proteins of interest. RNAs in the beads or unbound fraction can be extracted by Trizol and analyzed by northern blotting.
VI. Construction of Transgenic Strains to Analyze miRNA Expression and Target Regulation
Northern blotting, real-time quantitative PCR, and deep sequencing are powerful tools for analysis of miRNAs in C. elegans, but they lack the ability to detect spatiotemporal patterns of expression. Reporter genes, such as gfp (encoding green fluorescent protein) (Chalfie et al., 1994) or lacZ (encoding beta-galatosidase) (Fire et al., 1990), driven by a miRNA promoter (Pmir) are more amenable to analyze spatiotemporal miRNA expression in vivo. Moreover, a series of deletions in the promoter region of the construct can be used to determine the transcriptional regulatory cis-elements of miRNAs. For example, our group has examined the expression pattern of lin-4 and let-7 family members using Pmir::gfp constructs (Esquela-Kerscher et al., 2005; Johnson et al., 2005). In addition, by serially deleting the let-7 promoter region upstream of the gfp reporter, we have succeeded in pinpointing a short temporal regulatory cis-element (TRE) of let-7 (Johnson et al., 2003). We also have demonstrated that hbl-1, one target of let-7, inhibits the transcription of let-7 using a Plet-7::gfp construct in which the putative HBL-1 binding sites were deleted (Roush and Slack, 2009). Recently, Martinez et al. (2008) have used Pmir::gfp reporter constructs to analyze spatiotemporal promoter activity of miRNA on a genomic scale (Martinez et al., 2008). With all its promises, one obvious limit of the miRNA promoter–reporter fusion approach is that it can only reflect the transcriptional control of primary miRNAs production, and it cannot provide information on post-transcriptional regulation or turnover.
Similarly, reporter gene fusion can also be used to analyze miRNA-mediated gene regulation at the level of 3′UTRs (see below), which contain regulatory elements such as miRNA-binding sites.
P. miRNA Promoter–Reporter Fusion
The first step in designing a miRNA promoter–reporter fusion construct is to decide on the putative promoter sequence. Several factors should be taken into consideration, including the intergenic, intragenic, or operonic location of miRNA loci and the distance to the next upstream transcript, as well as the phylogenic conservation of promoter sequences and the presence of known transcription factor-binding sites. Determination of the 5′ end of the primary miRNA by 5′ RACE (see Section III) would help design the promoter–reporter fusion construct and it is debatable whether the primary miRNA sequence upstream of the mature miRNA should be kept in the construct. Previous studies have shown that fragments between a few hundred basepairs to 2 kb in length upstream of the mature miRNA or known pre-miRNA hairpin [miRBase (Griffiths-Jones et al., 2008)] contain sufficient information to faithfully recapitulate the pattern of expression of endogenous miRNAs. For example, we have used a 0.5 kb fragment upstream of lin-4 and a 2.2 kb fragment upstream of mir-84 as the promoters (Esquela-Kerscher et al., 2005; Johnson et al., 2005). Martinez et al. (2008) have used the intergenic genomic sequences upstream of miRNA genes from ~300 bp to 2 kb as the promoters in their genome-scale analysis (Martinez et al., 2008). Putative promoter regions located in vast intergenic regions that lack homology across species or known transcription factor binding sites may thus be safely limited to approximately 2 kb in most cases.
The second step is to choose the reporter gene and the vector backbone. Andrew Fire’s laboratory has developed a large array of vectors and reporter gene derivatives, using gfp or lacZ as the reporter, on the backbone of a pUC19 plasmid for fusion gene expression in C. elegans (see Links). The cloning strategies described below are adapted from several common cloning techniques for reporter gene fusions in C. elegans (Boulin et al., 2006). Due to the relatively short length of miRNA promoters we have chosen, we only discuss three strategies more suitable for short DNA fragment cloning, including conventional cloning, PCR fusion (Horton et al., 1989), and Multisite Gateway cloning (Hope et al., 2004).
1. Conventional Cloning
The most common strategy to construct a miRNA promoter–reporter fusion is conventional restriction enzyme-based cloning, graphically summarized in Fig. 2A. Perform PCR to amplify the promoter region (~300 bp to 2 kb upstream in length from the start of the mature miRNA) from genomic DNA and introduce appropriate restriction enzyme sites at both ends (restriction enzyme sites are introduced via the primers generated for amplification). Generate compatible ends on the purified PCR product and a reporter gene vector by restriction enzyme digestion. Ligate the promoter fragment and the linearized vector and amplify the ligated product in E. coli. For promoter–gfp fusion, two vectors, pPD95.70 and pPD95.75 from the Fire Vector Kit, have been broadly used in the C. elegans community. Both of them carry a S65C variant of the gfp gene and pPD95.70 has a SV40 nuclear localization sequence (NLS) for nuclear localization of GFP. The NLS may help with observations of weak GFP signals but should not be used to represent the subcellular localization of the miRNA. The gfp gene is linked to a 3′UTR derived from the muscle myosin heavy chain gene unc-54, permissive for expression in all cell types. Although conventional cloning is relatively time-consuming and depends on restriction enzyme sites, it has the irreplaceable advantage of generation of a reusable reporter gene construct. This construct can be verified by sequencing, repeatedly amplified, stored for a long time, and easily subjected to further subcloning.
Fig. 2.

Generating a Pmir::gfp::unc-54 3′ UTR reporter construct. (A) By conventional cloning. Use primer A and B to amplify a 2 kb fragment upstream of mature miRNA or pre-miRNA hairpin and insert the fragment into MCS of pPD95.75. (B) By PCR fusion. Use Primer A and B to amplify the promoter region and primer C and D to amplify gfp::unc-54 3′UTR from pPD95.75. Primer B adds a 24-bp region from MCS upstream of gfp gene. Anneal these two amplicons and use primer A* and D* to amplify the fusion product. (C) By Multisite Gateway cloning. Amplify the promoter region and the reporter gene with primers that introduce appropriate attB recombination sites and recombine PCR products with donor plasmids pDONR-P4-P1R and pDONR201, respectively. Recombine the products pENTRY-Pmir and pENTRY-gfp with pDEST-DD03. See text for details.
2. PCR Fusion
To prepare the promoter–reporter fusion construct more quickly than conventional cloning and escape the limitation of restriction enzyme sites, a two-step approach of PCR can be used to fuse a miRNA promoter and a reporter gene, generating a linear-formed DNA ready for transformation. Below, we describe the procedures for fusing a miRNA promoter to the gfp reporter with an unc-54 3′UTR, derived from pPD95.75, by PCR fusion (Fig. 2B).
Prepare the following primers:
Primer A: promoter-specific outside forward primer
Primer A*: promoter-specific nested forward primer
Primer B: promoter-specific reverse primer with a 24-bp sequence complementary to the MCS of the expression vector. (5′-AGTCGACCTGCAGGCATGCAAGCT-promoter specific sequence-3′)
Primer C: gfp forward primer (5′-AGCTTGCATGCCTGCAGGTCG-3′)
Primer D: gfp reverse primer (5′-AAGGGCCCGTACGGCCGACTA-3′)
Primer D*: gfp nested reverse primer (5′-GGAAACAGTTATGTTTGGTATA-3′)
Perform PCR using primers A and B to amplify a DNA fragment from genomic DNA that contains the promoter region and a 24-bp fragment overlapping with the MCS of pPD95.75. Perform PCR using primer C and D to amplify the gfp::unc-54 fragment from pPD95.75, which includes the MCS and an artificial intron between MCS and the gfp gene. Inclusion of the artificial intron will enhance reporter gene expression. Purify the two PCR products by electrophoresis on an agarose gel and recover the DNA from the corresponding bands. Mix 1–50 ng of each purified DNA fragment and use nested primers A* and D* for PCR fusion. Purify the fused fragment by agarose gel electrophoresis and the recovered DNA, if sufficient, can be used directly for microinjection (Mello and Fire, 1995; Mello et al., 1991).
The primary advantages of PCR fusion are speed, ability to carry out multiple constructions in parallel, and the lack of a requirement for restriction enzyme sites. However, the construct cannot be amplified in bacteria and additive PCR rounds may increase point mutations. These shortcomings can be circumvented by cloning the PCR fusion product, verifying its sequence, and propagating it in bacteria.
3. Multisite Gateway Cloning
Invitrogen’s Gateway cloning system has provided a versatile way to shuttle cloned DNA fragments among a variety of vector backbones for different applications (Walhout et al., 2000). This technology utilizes the site-specific recombination properties of bacteriophage lambda. Compatible recombination sites (attB and attP sites; B for bacteria and P for phage) on the DNA fragment of interest and the cloning vector are recognized by bacteriophage lambda integrase proteins, and recombination between attB and attP sites is carried out. The result is an entry clone carrying the DNA fragment of interest flanked with attL (L for left) and attR (R for right) sites, which consist of DNA sequences from attB and attP. The reverse reaction between compatible attL and attR of the entry clone and the destination vector moves the cloned DNA from the entry clone to the destination vector. The result is an expression clone carrying the DNA fragment of interest flanked with original attB and attP sites. Different core sequences in the att sites provide specificity when recombination occurs, that is, attB1 will only react with attP1 and attB2 will only react with attP2. This specificity ensures the correct orientation of inserted DNA fragment. Moreover, by using multiple designed att sites, one can perform recombination between up to four DNA fragments. Below, we describe a two-fragment recombination application of multisite Gateway cloning (Hope et al., 2004) (Fig. 2C) that has been used to build a C. elegans Promoterome library (Dupuy et al., 2004) and also has been used to systematically generate miRNA promoter–gfp reporter constructs (Martinez et al., 2008).
Prepare the following primers: [adapted from (Hope et al., 2004)]
For miRNA promoter:
5′ primer (attB4): 5′-GGGGACAACTTTGTATAGAAAAGTTGTG-promoter specific sequence (18–25 bp)
3′-primer (attB1.1R): 5′-GGGGACAACTTTTTTGTACAAAGTTGC-promoter specific sequence (18–25 bp)
For gfp gene:
5′ primer (attB1.1): 5′-GGGGACAACTTTGTACAAAAAAGTTGTG-gfp gene-specific sequence (18–25 bp)
3′ primer (attB2.1): 5′-GGGGACAACTTTGTACAAGAAAGTTGC-gfp gene-specific sequence (18–25 bp)
As shown in Fig. 2C, amplify attB4-miRNA promoter (Pmir)-attB1.1R and attB1.1-gfp::unc-54 3′UTR-attB2.1 fragments by PCR from source DNA (genomic DNA and pPD95.75). Purify the PCR products by agarose gel electrophoresis. Recombine attB4-Pmir-attB1.1R with pDONR-P4-P1R (Invitrogen) and attB1.1-gfp::unc-54 3′UTR-attB2.1 with pDONR201 or pDONR221 (Invitrogen). This will generate two entry vectors, pENTRY-Pmir and pENTRY-gfp. Recombine pENTRY-Pmir and pENTRY-gfp with pDEST R4-R2 or pDEST-DD03 (Dupuy et al., 2004) (available from Marc Vidal, Harvard University). pDEST-DD03 contains attR4 and attR2 sites along with an unc-119 gene which is used in ballistic transformation protocols (Praitis et al., 2001). All recombination reactions are according to manufacturer’s instruction.
Q. Reporter-miRNA Target 3′UTR Fusion
In addition to determining the expression pattern of miRNAs during development, reporter fusion constructs can be used to study the miRNA-mediated regulation of target genes. Usually, target genes of miRNAs are identified by genetic screening or predicted by computational analysis, which is mostly based on the assumption that miRNAs associate with regulatory elements in the 3′UTR of target genes. An experimental approach to verify a newly found or predicted miRNA/target pair is to examine the expression of a reporter that is fused with the 3′UTR of a target gene. For example, our group has used a lacZ reporter construct, Pcol-10::lacZ::lin-41 3′UTR, to observe the regulation of heterochronic gene lin-41 by let-7 (Reinhart et al., 2000). The actual let-7 binding sites on lin-41 3′UTR were also verified by a series of mutagenesis experiments on such a reporter (Vella et al., 2004). Moreover, this Pcol-10::lacZ::lin-41 3′UTR reporter construct can be used as a tool to evaluate the efficacy of let-7 in wild-type or let-7 mutant animals (Chan and Slack, 2009; Reinhart et al., 2000). In these studies, we use the promoter of collagen gene col-10 to specifically express lacZ in hypodermal seam cells where let-7 is expressed.
A reporter-3′UTR fusion can be constructed by cloning strategies similar to that for building a promoter–reporter fusion (see above and Fig. 2). A fixed and cell-specific promoter can be chosen to drive the reporter expression for the purpose of observation. Usually, a promoter of a housekeeping gene or a gene that is not linked to miRNA regulation will be chosen, like the col-10 promoter. In other cases, researchers will choose the promoter from the gene of interest along with its 3′UTR and examine the reporter expression in the specific spatiotemporal pattern of the endogenous gene. The 3′UTR region of most genes is annotated in WormBase (Harris et al., 2010) or can be inferred by putative polyadenylation signal (PAS) sites (Hajarnavis et al., 2004) or by RNA-seq data available as part of the track for ALG-1 binding at the UCSC Genome Browser (Hillier et al., 2009; Zisoulis et al., 2010). Putative miRNA binding sites can be predicted by algorithms derived from PicTar (Lall et al., 2006), TargetScan (Lewis et al., 2005), or miRanda (Enright et al., 2003). The presence of ALG-1 binding sites can also be used to prioritize 3′UTR sequences to test for miRNA regulation by reporter analyses (Zisoulis et al., 2010).
R. Transformation
Transgenic C. elegans strains can be obtained by either microinjection (Mello and Fire, 1995; Mello et al., 1991) or ballistic transformation (Wilm et al., 1999). For microinjection, a coinjection marker, like rol-6(su-1006) (Kramer et al., 1990), can be used to select the transformed animals. For ballistic transformation, a copy of the wild-type unc-119 gene is included in the DNA construct as a selection marker when the unc-119(ed3) mutant strain is used for transformation (Praitis et al., 2001). The recent development of the Mos1 mediated insertion technique for integrating single copy transgenes into a specific chromosomal location can also be used for generating 3′UTR reporter strains (Frokjaer-Jensen et al., 2008).
Links
For EST, mRNA and miRNA registries
WormBase: http://www.wormbase.org
miRBase: http://microrna.sanger.ac.uk
For vectors
Fire Lab C. elegans Vector Kit: http://www.addgene.org/Andrew_Fire or ftp://ftp.wormbase.org/pub/wormbase/datasets/fire_vectors
For miRNA target prediction algorithms and databases
PicTar: http://pictar.mdc-berlin.de/
TargetScan: http://www.targetscan.org/worm_12/
miRanda: http://cbio.mskcc.org/research/sander/data/miRNA2003/miranda_new.html and http://www.ebi.ac.uk/enright-srv/microcosm/htdocs/targets/v5/
For mRNA 5′ and 3′ end annotations based on RNA-seq and ALG-1 binding sites based on CLIP-seq
III. Summary
mRNAs are essential regulators of many basic cellular processes. As such, slight deviations in the amount, timing, or location of miRNA expression can have large effects on cell and organismal growth. The analysis of primary, precursor, and mature miRNA levels as well as the identification and characterization of miRNA targets is thus crucial for determining the step in miRNA biogenesis or function affected in a particular mutant or disease. The methods described in this chapter provide a foundation for analyzing these steps in the powerful model organism C. elegans.
Acknowledgments
The authors thank members of the Pasquinelli and Slack labs for their comments, critical reading of this manuscript, and sharing of protocols. This work was supported by funding to A. E. Pasquinelli from NIH (GM071654), and the Keck, Searle, V, Emerald, and Peter Gruber Foundations, and funding to F. J. Slack from NIH (GM064701, AG033921) and the Ellison Medical Foundation. P. M. Van Wynsberghe was supported by a Ruth L. Kirschstein National Research Service Award Number F32GM087004 from the National Institute of General Medical Sciences.
References
- Bartel DP. MicroRNAs: Target recognition and regulatory functions. Cell. 2009;136:215–233. doi: 10.1016/j.cell.2009.01.002. [DOI] [PMC free article] [PubMed] [Google Scholar]
- Batista PJ, Ruby JG, Claycomb JM, Chiang R, Fahlgren N, Kasschau KD, Chaves DA, Gu W, Vasale JJ, Duan S, Conte D, Jr., Luo S, Schroth GP, Carrington JC, Bartel DP, Mello CC. PRG-1 and 21U-RNAs interact to form the piRNA complex required for fertility in C. elegans. Mol. Cell. 2008;31:67–78. doi: 10.1016/j.molcel.2008.06.002. [DOI] [PMC free article] [PubMed] [Google Scholar]
- Benes V, Castoldi M. Expression profiling of microRNA using real-time quantitative PCR, how to use it and what is available. Methods. 2010;50:244–249. doi: 10.1016/j.ymeth.2010.01.026. [DOI] [PubMed] [Google Scholar]
- Bentley DR, Balasubramanian S, Swerdlow HP, Smith GP, Milton J, Brown CG, Hall KP, Evers DJ, Barnes CL, Bignell HR, Boutell JM, Bryant J, Carter RJ, Keira Cheetham R, Cox AJ, Ellis DJ, Flatbush MR, Gormley NA, Humphray SJ, Irving LJ, Karbelashvili MS, Kirk SM, Li H, Liu X, Maisinger KS, Murray LJ, Obradovic B, Ost T, Parkinson ML, Pratt MR, Rasolonjatovo IM, Reed MT, Rigatti R, Rodighiero C, Ross MT, Sabot A, Sankar SV, Scally A, Schroth GP, Smith ME, Smith VP, Spiridou A, Torrance PE, Tzonev SS, Vermaas EH, Walter K, Wu X, Zhang L, Alam MD, Anastasi C, Aniebo IC, Bailey DM, Bancarz IR, Banerjee S, Barbour SG, Baybayan PA, Benoit VA, Benson KF, Bevis C, Black PJ, Boodhun A, Brennan JS, Bridgham JA, Brown RC, Brown AA, Buermann DH, Bundu AA, Burrows JC, Carter NP, Castillo N, Chiara ECM, Chang S, Neil Cooley R, Crake NR, Dada OO, Diakoumakos KD, Dominguez-Fernandez B, Earnshaw DJ, Egbujor UC, Elmore DW, Etchin SS, Ewan MR, Fedurco M, Fraser LJ, Fuentes Fajardo KV, Scott Furey W, George D, Gietzen KJ, Goddard CP, Golda GS, Granieri PA, Green DE, Gustafson DL, Hansen NF, Harnish K, Haudenschild CD, Heyer NI, Hims MM, Ho JT, Horgan AM. Accurate whole human genome sequencing using reversible terminator chemistry. Nature. 2008;456:53–59. doi: 10.1038/nature07517. [DOI] [PMC free article] [PubMed] [Google Scholar]
- Boulin T, Etchberger JF, Hobert O. Reporter gene fusions. WormBook: The Online Review of C. elegans Biology, The Online C. elegans Research Community. 2006:1–23. doi: 10.1895/wormbook.1.106.1. [DOI] [PMC free article] [PubMed] [Google Scholar]
- Bracht J, Hunter S, Eachus R, Weeks P, Pasquinelli AE. Trans-splicing and polyadenylation of let-7 microRNA primary transcripts. RNA. 2004;10:1586–1594. doi: 10.1261/rna.7122604. [DOI] [PMC free article] [PubMed] [Google Scholar]
- Bracht JR, Van Wynsberghe PM, Mondol V, Pasquinelli AE. Regulation of lin-4 miRNA expression, organismal growth and development by a conserved RNA binding protein in C. elegans. Dev. Biol. 2010;348:210–221. doi: 10.1016/j.ydbio.2010.10.003. [DOI] [PMC free article] [PubMed] [Google Scholar]
- Caudy AA, Ketting RF, Hammond SM, Denli AM, Bathoorn AM, Tops BB, Silva JM, Myers MM, Hannon GJ, Plasterk RH. A micrococcal nuclease homologue in RNAi effector complexes. Nature. 2003;425:411–414. doi: 10.1038/nature01956. [DOI] [PubMed] [Google Scholar]
- Caudy AA, Myers M, Hannon GJ, Hammond SM. Fragile X-related protein and VIG associate with the RNA interference machinery. Genes Dev. 2002;16:2491–2496. doi: 10.1101/gad.1025202. [DOI] [PMC free article] [PubMed] [Google Scholar]
- Chalfie M, Tu Y, Euskirchen G, Ward WW, Prasher DC. Green fluorescent protein as a marker for gene expression. Science. 1994;263:802–805. doi: 10.1126/science.8303295. [DOI] [PubMed] [Google Scholar]
- Chan SP, Ramaswamy G, Choi EY, Slack FJ. Identification of specific let-7 microRNA binding complexes in Caenorhabditis elegans. RNA. 2008;14:2104–2114. doi: 10.1261/rna.551208. [DOI] [PMC free article] [PubMed] [Google Scholar]
- Chan SP, Slack FJ. Ribosomal protein RPS-14 modulates let-7 microRNA function in Caenorhabditis elegans. Dev. Biol. 2009;334:152–160. doi: 10.1016/j.ydbio.2009.07.011. [DOI] [PMC free article] [PubMed] [Google Scholar]
- Chekulaeva M, Filipowicz W. Mechanisms of miRNA-mediated post-transcriptional regulation in animal cells. Curr. Opin. Cell Biol. 2009;21:452–460. doi: 10.1016/j.ceb.2009.04.009. [DOI] [PubMed] [Google Scholar]
- Creighton CJ, Reid JG, Gunaratne PH. Expression profiling of microRNAs by deep sequencing. Brief Bioinform. 2009;10:490–497. doi: 10.1093/bib/bbp019. [DOI] [PMC free article] [PubMed] [Google Scholar]
- Davis BN, Hata A. Regulation of MicroRNA biogenesis: A miRiad of mechanisms. Cell Commun. Signal. 2009;7:18. doi: 10.1186/1478-811X-7-18. [DOI] [PMC free article] [PubMed] [Google Scholar]
- Dupuy D, Li QR, Deplancke B, Boxem M, Hao T, Lamesch P, Sequerra R, Bosak S, Doucette-Stamm L, Hope IA, Hill DE, Walhout AJ, Vidal M. A first version of the Caenorhabditis elegans promoterome. Genome Res. 2004;14:2169–2175. doi: 10.1101/gr.2497604. [DOI] [PMC free article] [PubMed] [Google Scholar]
- Enright AJ, John B, Gaul U, Tuschl T, Sander C, Marks DS. MicroRNA targets in Drosophila. Genome Biol. 2003;5:R1. doi: 10.1186/gb-2003-5-1-r1. [DOI] [PMC free article] [PubMed] [Google Scholar]
- Esquela-Kerscher A, Johnson SM, Bai L, Saito K, Partridge J, Reinert KL, Slack FJ. Post-embryonic expression of C. elegans microRNAs belonging to the lin-4 and let-7 families in the hypodermis and the reproductive system. Dev. Dyn. 2005;234:868–877. doi: 10.1002/dvdy.20572. [DOI] [PMC free article] [PubMed] [Google Scholar]
- Fineberg SK, Kosik KS, Davidson BL. MicroRNAs potentiate neural development. Neuron. 2009;64:303–309. doi: 10.1016/j.neuron.2009.10.020. [DOI] [PubMed] [Google Scholar]
- Fire A, Harrison SW, Dixon D. A modular set of lacZ fusion vectors for studying gene expression in Caenorhabditis elegans. Gene. 1990;93:189–198. doi: 10.1016/0378-1119(90)90224-f. [DOI] [PubMed] [Google Scholar]
- Friedlander MR, Chen W, Adamidi C, Maaskola J, Einspanier R, Knespel S, Rajewsky N. Discovering microRNAs from deep sequencing data using miRDeep. Nat. Biotechnol. 2008;26:407–415. doi: 10.1038/nbt1394. [DOI] [PubMed] [Google Scholar]
- Frokjaer-Jensen C, Davis MW, Hopkins CE, Newman BJ, Thummel JM, Olesen SP, Grunnet M, Jorgensen EM. Single-copy insertion of transgenes in Caenorhabditis elegans. Nat. Gen. 2008;40:1375–1383. doi: 10.1038/ng.248. [DOI] [PMC free article] [PubMed] [Google Scholar]
- Gangaraju VK, Lin H. MicroRNAs: key regulators of stem cells. Nat. Rev. Mol. Cell Biol. 2009;10:116–125. doi: 10.1038/nrm2621. [DOI] [PMC free article] [PubMed] [Google Scholar]
- Gregory RI, Chendrimada TP, Cooch N, Shiekhattar R. Human RISC couples microRNA biogenesis and posttranscriptional gene silencing. Cell. 2005;123:631–640. doi: 10.1016/j.cell.2005.10.022. [DOI] [PubMed] [Google Scholar]
- Griffiths-Jones S, Saini HK, van Dongen S, Enright AJ. miRBase: Tools for microRNA genomics. Nucleic Acids Res. 2008;36:D154–D158. doi: 10.1093/nar/gkm952. [DOI] [PMC free article] [PubMed] [Google Scholar]
- Grishok A, Pasquinelli AE, Conte D, Li N, Parrish S, Ha I, Baillie DL, Fire A, Ruvkun G, Mello CC. Genes and mechanisms related to RNA interference regulate expression of the small temporal RNAs that control C. elegans developmental timing. Cell. 2001;106:23–34. doi: 10.1016/s0092-8674(01)00431-7. [DOI] [PubMed] [Google Scholar]
- Hackenberg M, Sturm M, Langenberger D, Falcon-Perez JM, Aransay AM. miRanalyzer: A microRNA detection and analysis tool for next-generation sequencing experiments. Nucleic Acids Res. 2009;37:W68–W76. doi: 10.1093/nar/gkp347. [DOI] [PMC free article] [PubMed] [Google Scholar]
- Hafner M, Landgraf P, Ludwig J, Rice A, Ojo T, Lin C, Holoch D, Lim C, Tuschl T. Identification of microRNAs and other small regulatory RNAs using cDNA library sequencing. Methods. 2008;44:3–12. doi: 10.1016/j.ymeth.2007.09.009. [DOI] [PMC free article] [PubMed] [Google Scholar]
- Hajarnavis A, Korf I, Durbin R. A probabilistic model of 3′ end formation in Caenorhabditis elegans. Nucleic Acids Res. 2004;32:3392–3399. doi: 10.1093/nar/gkh656. [DOI] [PMC free article] [PubMed] [Google Scholar]
- Harris TW, Antoshechkin I, Bieri T, Blasiar D, Chan J, Chen WJ, De La Cruz N, Davis P, Duesbury M, Fang R, Fernandes J, Han M, Kishore R, Lee R, Muller HM, Nakamura C, Ozersky P, Petcherski A, Rangarajan A, Rogers A, Schindelman G, Schwarz EM, Tuli MA, Van Auken K, Wang D, Wang X, Williams G, Yook K, Durbin R, Stein LD, Spieth J, Sternberg PW. WormBase: A comprehensive resource for nematode research. Nucleic Acids Res. 2010;38:D463–D467. doi: 10.1093/nar/gkp952. [DOI] [PMC free article] [PubMed] [Google Scholar]
- Hillier LW, Reinke V, Green P, Hirst M, Marra MA, Waterston RH. Massively parallel sequencing of the polyadenylated transcriptome of C. elegans. Genome Res. 2009;19:657–666. doi: 10.1101/gr.088112.108. [DOI] [PMC free article] [PubMed] [Google Scholar]
- Hofacker IL. RNA secondary structure analysis using the Vienna RNA package. Curr Protoc Bioinformatics (Chapter 12, Unit 12. 2) 2009;26:12.2.1–12.2.16. doi: 10.1002/0471250953.bi1202s04. [DOI] [PubMed] [Google Scholar]
- Hope IA, Stevens J, Garner A, Hayes J, Cheo DL, Brasch MA, Vidal M. Feasibility of genome-scale construction of promoter::reporter gene fusions for expression in Caenorhabditis elegans using a multisite gateway recombination system. Genome Res. 2004;14:2070–2075. doi: 10.1101/gr.2463804. [DOI] [PMC free article] [PubMed] [Google Scholar]
- Horton RM, Hunt HD, Ho SN, Pullen JK, Pease LR. Engineering hybrid genes without the use of restriction enzymes: Gene splicing by overlap extension. Gene. 1989;77:61–68. doi: 10.1016/0378-1119(89)90359-4. [DOI] [PubMed] [Google Scholar]
- Hutvagner G, Simard MJ, Mello CC, Zamore PD. Sequence-specific inhibition of small RNA function. PLoS Biol. 2004;2:E98. doi: 10.1371/journal.pbio.0020098. [DOI] [PMC free article] [PubMed] [Google Scholar]
- Johnson SM, Grosshans H, Shingara J, Byrom M, Jarvis R, Cheng A, Labourier E, Reinert KL, Brown D, Slack FJ. RAS is regulated by the let-7 microRNA family. Cell. 2005;120:635–647. doi: 10.1016/j.cell.2005.01.014. [DOI] [PubMed] [Google Scholar]
- Johnson SM, Lin SY, Slack FJ. The time of appearance of the C. elegans let-7 microRNA is transcriptionally controlled utilizing a temporal regulatory element in its promoter. Dev. Biol. 2003;259:364–379. doi: 10.1016/s0012-1606(03)00202-1. [DOI] [PubMed] [Google Scholar]
- Kai ZS, Pasquinelli AE. MicroRNA assassins: Factors that regulate the disappearance of miRNAs. Nat. Struct. Mol. Biol. 2010;17:5–10. doi: 10.1038/nsmb.1762. [DOI] [PMC free article] [PubMed] [Google Scholar]
- Kato M, de Lencastre A, Pincus Z, Slack FJ. Dynamic expression of small non-coding RNAs, including novel microRNAs and piRNAs/21U-RNAs, during Caenorhabditis elegans development. Genome Biol. 2009;10:R54. doi: 10.1186/gb-2009-10-5-r54. [DOI] [PMC free article] [PubMed] [Google Scholar]
- Kato M, Slack FJ. microRNAs: Small molecules with big roles – C. elegans to human cancer. Biol. Cell. 2008;100:71–81. doi: 10.1042/BC20070078. [DOI] [PubMed] [Google Scholar]
- Kramer JM, French RP, Park EC, Johnson JJ. The Caenorhabditis elegans rol-6 gene, which interacts with the sqt-1 collagen gene to determine organismal morphology, encodes a collagen. Mol. Cell Biol. 1990;10:2081–2089. doi: 10.1128/mcb.10.5.2081. [DOI] [PMC free article] [PubMed] [Google Scholar]
- Lagos-Quintana M, Rauhut R, Lendeckel W, Tuschl T. Identification of novel genes coding for small expressed RNAs. Science. 2001;294:853–858. doi: 10.1126/science.1064921. [DOI] [PubMed] [Google Scholar]
- Lall S, Grun D, Krek A, Chen K, Wang YL, Dewey CN, Sood P, Colombo T, Bray N, Macmenamin P, Kao HL, Gunsalus KC, Pachter L, Piano F, Rajewsky N. A genome-wide map of conserved microRNA targets in C. elegans. Curr. Biol. 2006;16:460–471. doi: 10.1016/j.cub.2006.01.050. [DOI] [PubMed] [Google Scholar]
- Latronico MV, Condorelli G. MicroRNAs and cardiac pathology. Nat. Rev. Cardiol. 2009;6:419–429. doi: 10.1038/nrcardio.2009.56. [DOI] [PubMed] [Google Scholar]
- Lau NC, Lim LP, Weinstein EG, Bartel DP. An abundant class of tiny RNAs with probable regulatory roles in Caenorhabditis elegans. Science. 2001;294:858–862. doi: 10.1126/science.1065062. [DOI] [PubMed] [Google Scholar]
- Lee RC, Ambros V. An extensive class of small RNAs in Caenorhabditis elegans. Science. 2001;294:862–864. doi: 10.1126/science.1065329. [DOI] [PubMed] [Google Scholar]
- Lee RC, Feinbaum RL, Ambros V. The C. elegans heterochronic gene lin-4 encodes small RNAs with antisense complementarity to lin-14. Cell. 1993;75:843–854. doi: 10.1016/0092-8674(93)90529-y. [DOI] [PubMed] [Google Scholar]
- Lewis BP, Burge CB, Bartel DP. Conserved seed pairing, often flanked by adenosines, indicates that thousands of human genes are microRNA targets. Cell. 2005;120:15–20. doi: 10.1016/j.cell.2004.12.035. [DOI] [PubMed] [Google Scholar]
- Li R, Li Y, Kristiansen K, Wang J. SOAP: Short oligonucleotide alignment program. Bioinformatics. 2008;24:713–714. doi: 10.1093/bioinformatics/btn025. [DOI] [PubMed] [Google Scholar]
- Li R, Yu C, Li Y, Lam TW, Yiu SM, Kristiansen K, Wang J. SOAP2: An improved ultrafast tool for short read alignment. Bioinformatics. 2009;25:1966–1967. doi: 10.1093/bioinformatics/btp336. [DOI] [PubMed] [Google Scholar]
- Mardis ER. The impact of next-generation sequencing technology on genetics. Trends Genet. 2008;24:133–141. doi: 10.1016/j.tig.2007.12.007. [DOI] [PubMed] [Google Scholar]
- Margulies M, Egholm M, Altman WE, Attiya S, Bader JS, Bemben LA, Berka J, Braverman MS, Chen YJ, Chen Z, Dewell SB, Du L, Fierro JM, Gomes XV, Godwin BC, He W, Helgesen S, Ho CH, Irzyk GP, Jando SC, Alenquer ML, Jarvie TP, Jirage KB, Kim JB, Knight JR, Lanza JR, Leamon JH, Lefkowitz SM, Lei M, Li J, Lohman KL, Lu H, Makhijani VB, McDade KE, McKenna MP, Myers EW, Nickerson E, Nobile JR, Plant R, Puc BP, Ronan MT, Roth GT, Sarkis GJ, Simons JF, Simpson JW, Srinivasan M, Tartaro KR, Tomasz A, Vogt KA, Volkmer GA, Wang SH, Wang Y, Weiner MP, Yu P, Begley RF, Rothberg JM. Genome sequencing in microfabricated high-density picolitre reactors. Nature. 2005;437:376–380. doi: 10.1038/nature03959. [DOI] [PMC free article] [PubMed] [Google Scholar]
- Martinez NJ, Ow MC, Reece-Hoyes JS, Barrasa MI, Ambros VR, Walhout AJ. Genome-scale spatiotemporal analysis of Caenorhabditis elegans microRNA promoter activity. Genome Res. 2008;18:2005–2015. doi: 10.1101/gr.083055.108. [DOI] [PMC free article] [PubMed] [Google Scholar]
- Medina PP, Slack FJ. microRNAs and cancer: An overview. Cell Cycle. 2008;7:2485–2492. doi: 10.4161/cc.7.16.6453. [DOI] [PubMed] [Google Scholar]
- Mello C, Fire A. DNA transformation. Methods Cell Biol. 1995;48:451–482. [PubMed] [Google Scholar]
- Mello CC, Kramer JM, Stinchcomb D, Ambros V. Efficient gene transfer in C. elegans: Extrachromosomal maintenance and integration of transforming sequences. EMBO J. 1991;10:3959–3970. doi: 10.1002/j.1460-2075.1991.tb04966.x. [DOI] [PMC free article] [PubMed] [Google Scholar]
- Mili S, Steitz JA. Evidence for reassociation of RNA-binding proteins after cell lysis: Implications for the interpretation of immunoprecipitation analyses. RNA. 2004;10:1692–1694. doi: 10.1261/rna.7151404. [DOI] [PMC free article] [PubMed] [Google Scholar]
- Moxon S, Schwach F, Dalmay T, Maclean D, Studholme DJ, Moulton V. A toolkit for analysing large-scale plant small RNA datasets. Bioinformatics. 2008;24:2252–2253. doi: 10.1093/bioinformatics/btn428. [DOI] [PubMed] [Google Scholar]
- Negrini M, Nicoloso MS, Calin GA. MicroRNAs and cancer – new paradigms in molecular oncology. Curr. Opin. Cell Biol. 2009;21:470–479. doi: 10.1016/j.ceb.2009.03.002. [DOI] [PubMed] [Google Scholar]
- O’Connell RM, Rao DS, Chaudhuri AA, Baltimore D. Physiological and pathological roles for microRNAs in the immune system. Nat. Rev. Immunol. 2010;10:111–122. doi: 10.1038/nri2708. [DOI] [PubMed] [Google Scholar]
- Okamura K, Ishizuka A, Siomi H, Siomi MC. Distinct roles for Argonaute proteins in small RNA-directed RNA cleavage pathways. Genes Dev. 2004;18:1655–1666. doi: 10.1101/gad.1210204. [DOI] [PMC free article] [PubMed] [Google Scholar]
- Pasquinelli AE, Reinhart BJ, Slack F, Martindale MQ, Kuroda MI, Maller B, Hayward DC, Ball EE, Degnan B, Muller P, Spring J, Srinivasan A, Fishman M, Finnerty J, Corbo J, Levine M, Leahy P, Davidson E, Ruvkun G. Conservation of the sequence and temporal expression of let-7 heterochronic regulatory RNA. Nature. 2000;408:86–89. doi: 10.1038/35040556. [DOI] [PubMed] [Google Scholar]
- Pham JW, Pellino JL, Lee YS, Carthew RW, Sontheimer EJ. A Dicer-2-dependent 80 s complex cleaves targeted mRNAs during RNAi in Drosophila. Cell. 2004;117:83–94. doi: 10.1016/s0092-8674(04)00258-2. [DOI] [PubMed] [Google Scholar]
- Praitis V, Casey E, Collar D, Austin J. Creation of low-copy integrated transgenic lines in Caenorhabditis elegans. Genetics. 2001;157:1217–1226. doi: 10.1093/genetics/157.3.1217. [DOI] [PMC free article] [PubMed] [Google Scholar]
- Reinhart BJ, Slack FJ, Basson M, Pasquinelli AE, Bettinger JC, Rougvie AE, Horvitz HR, Ruvkun G. The 21-nucleotide let-7 RNA regulates developmental timing in Caenorhabditis elegans. Nature. 2000;403:901–906. doi: 10.1038/35002607. [DOI] [PubMed] [Google Scholar]
- Roush SF, Slack FJ. Transcription of the C. elegans let-7 microRNA is temporally regulated by one of its targets, hbl-1. Dev. Biol. 2009;334:523–534. doi: 10.1016/j.ydbio.2009.07.012. [DOI] [PMC free article] [PubMed] [Google Scholar]
- Ruby JG, Jan C, Player C, Axtell MJ, Lee W, Nusbaum C, Ge H, Bartel DP. Large-scale sequencing reveals 21U-RNAs and additional microRNAs and endogenous siRNAs in C. elegans. Cell. 2006;127:1193–1207. doi: 10.1016/j.cell.2006.10.040. [DOI] [PubMed] [Google Scholar]
- Shendure J, Ji H. Next-generation DNA sequencing. Nat. Biotechnol. 2008;26:1135–1145. doi: 10.1038/nbt1486. [DOI] [PubMed] [Google Scholar]
- Steiner FA, Hoogstrate SW, Okihara KL, Thijssen KL, Ketting RF, Plasterk RH, Sijen T. Structural features of small RNA precursors determine Argonaute loading in Caenorhabditis elegans. Nat. Struct. Mol. Biol. 2007;14:927–933. doi: 10.1038/nsmb1308. [DOI] [PubMed] [Google Scholar]
- Subramanian S, Steer CJ. MicroRNAs as gatekeepers of apoptosis. J. Cell Physiol. 2010;223:289–298. doi: 10.1002/jcp.22066. [DOI] [PubMed] [Google Scholar]
- Tyagi S, Vaz C, Gupta V, Bhatia R, Maheshwari S, Srinivasan A, Bhattacharya A. CID-miRNA: A web server for prediction of novel miRNA precursors in human genome. Biochem. Biophys. Res. Commun. 2008;372:831–834. doi: 10.1016/j.bbrc.2008.05.134. [DOI] [PubMed] [Google Scholar]
- Van Wynsberghe PM, Kai ZS, Massirer KB, Burton VH, Yeo GW, Pasquinelli AE. LIN-28 co-transcriptionally binds primary let-7 to regulate miRNA maturation in Caenorhabditis elegans. Nat. Struct. Mol. Biol. 2011;18:302–308. doi: 10.1038/nsmb.1986. [DOI] [PMC free article] [PubMed] [Google Scholar]
- Vella MC, Choi EY, Lin SY, Reinert K, Slack FJ. The C. elegans microRNA let-7 binds to imperfect let-7 complementary sites from the lin-41 3′UTR. Genes Dev. 2004;18:132–137. doi: 10.1101/gad.1165404. [DOI] [PMC free article] [PubMed] [Google Scholar]
- Walhout AJ, Temple GF, Brasch MA, Hartley JL, Lorson MA, van den Heuvel S, Vidal M. GATEWAY recombinational cloning: Application to the cloning of large numbers of open reading frames or ORFeomes. Methods Enzymol. 2000;328:575–592. doi: 10.1016/s0076-6879(00)28419-x. [DOI] [PubMed] [Google Scholar]
- Wilm T, Demel P, Koop HU, Schnabel H, Schnabel R. Ballistic transformation of Caenorhabditis elegans. Gene. 1999;229:31–35. doi: 10.1016/s0378-1119(99)00043-8. [DOI] [PubMed] [Google Scholar]
- Winter J, Jung S, Keller S, Gregory RI, Diederichs S. Many roads to maturity: microRNA biogenesis pathways and their regulation. Nat. Cell Biol. 2009;11:228–234. doi: 10.1038/ncb0309-228. [DOI] [PubMed] [Google Scholar]
- Xu Y, Zhou X, Zhang W. MicroRNA prediction with a novel ranking algorithm based on random walks. Bioinformatics. 2008;24:i50–i58. doi: 10.1093/bioinformatics/btn175. [DOI] [PMC free article] [PubMed] [Google Scholar]
- Yigit E, Batista PJ, Bei Y, Pang KM, Chen CC, Tolia NH, Joshua-Tor L, Mitani S, Simard MJ, Mello CC. Analysis of the C. elegans Argonaute family reveals that distinct Argonautes act sequentially during RNAi. Cell. 2006;127:747–757. doi: 10.1016/j.cell.2006.09.033. [DOI] [PubMed] [Google Scholar]
- Zhang L, Ding L, Cheung TH, Dong MQ, Chen J, Sewell AK, Liu X, Yates JR, 3rd, Han M. Systematic identification of C. elegans miRISC proteins, miRNAs, and mRNA targets by their interactions with GW182 proteins AIN-1 and AIN-2. Mol. Cell. 2007;28:598–613. doi: 10.1016/j.molcel.2007.09.014. [DOI] [PMC free article] [PubMed] [Google Scholar]
- Zisoulis DG, Lovci MT, Wilbert ML, Hutt KR, Liang TY, Pasquinelli AE, Yeo GW. Comprehensive discovery of endogenous Argonaute binding sites in Caenorhabditis elegans. Nat. Struct. Mol. Biol. 2010;17:173–179. doi: 10.1038/nsmb.1745. [DOI] [PMC free article] [PubMed] [Google Scholar]
- Zisoulis DG, Yeo GW, Pasquinelli AE. Comprehensive identification of miRNA target sites in live animals. Methods Mol. Biol. 2011;732:169–185. doi: 10.1007/978-1-61779-083-6_13. [DOI] [PubMed] [Google Scholar]