

This prospective, cross-sectional study in an independent cohort of subjects known to have or suspected of having nonalcoholic fatty liver disease helps to validate the high-specificity Nonalcoholic Steatohepatitis Clinical Research Network–derived MR imaging proton density fat fraction thresholds by using histologic steatosis grade as a reference.
Abstract
Purpose
To evaluate the diagnostic performance of previously proposed high-specificity magnetic resonance (MR) imaging–estimated proton density fat fraction (PDFF) thresholds for diagnosis of steatosis grade 1 or higher (PDFF threshold of 6.4%), grade 2 or higher (PDFF threshold of 17.4%), and grade 3 (PDFF threshold of 22.1%) by using histologic findings as a reference in an independent cohort of adults known to have or suspected of having nonalcoholic fatty liver disease (NAFLD).
Materials and Methods
This prospective, cross-sectional, institutional review board–approved, HIPAA-compliant single-center study was conducted in an independent cohort of 89 adults known to have or suspected of having NAFLD who underwent contemporaneous liver biopsy. MR imaging PDFF was estimated at 3 T by using magnitude-based low–flip-angle multiecho gradient-recalled-echo imaging with T2* correction and multipeak modeling. Steatosis was graded histologically (grades 0, 1, 2, and 3, according to the Nonalcoholic Steatohepatitis Clinical Research Network scoring system). Sensitivity, specificity, and binomial confidence intervals were calculated for the proposed MR imaging PDFF thresholds.
Results
The proposed MR imaging PDFF threshold of 6.4% to diagnose grade 1 or higher steatosis had 86% sensitivity (71 of 83 patients; 95% confidence interval [CI]: 76, 92) and 83% specificity (five of six patients; 95% CI: 36, 100). The threshold of 17.4% to diagnose grade 2 or higher steatosis had 64% sensitivity (28 of 44 patients; 95% CI: 48, 78) and 96% specificity (43 of 45 patients; 95% CI: 85, 100). The threshold of 22.1% to diagnose grade 3 steatosis had 71% sensitivity (10 of 14 patients; 95% CI: 42, 92) and 92% specificity (69 of 75 patients; 95% CI: 83, 97).
Conclusion
In an independent cohort of adults known to have or suspected of having NAFLD, the previously proposed MR imaging PDFF thresholds provided moderate to high sensitivity and high specificity for diagnosis of grade 1 or higher, grade 2 or higher, and grade 3 steatosis. Prospective multicenter studies are now needed to further validate these high-specificity thresholds.
© RSNA, 2014
Introduction
Nonalcoholic fatty liver disease (NAFLD) is an emerging epidemic in the Western world (1), affecting nearly 20%–30% of adults and 10% of children (2,3). As many as 100 million Americans have NAFLD, including an estimated 18 million with nonalcoholic steatohepatitis (NASH) (4–8), a progressive form that may lead to cirrhosis (6,9,10) and hepatocellular carcinoma (6,11–15). NAFLD is associated with features of the metabolic syndrome, including insulin resistance, hypertension, diabetes, and dyslipidemia (16–22), and it may contribute to the development of cardiovascular disease (23). The histologic hallmark of NAFLD is hepatic steatosis, the excess accumulation of triglycerides (fat) in hepatocytes. Liver biopsy is the current clinical reference standard for diagnosis of hepatic steatosis and grading its severity (24). However, biopsy is invasive, semiquantitative, observer dependent, and prone to sampling variability (25–31). These limitations make biopsy a suboptimal first-line test for assessment of hepatic steatosis (32). Noninvasive imaging-based alternatives to biopsy are desirable for diagnosis and grading of hepatic steatosis (32).
To address this need, advanced magnetic resonance (MR) imaging–based techniques have been developed to measure the hepatic proton density fat fraction (PDFF) (33–40); this is a standardized, objective measure of the proportion of the mobile proton density of the liver that is attributable to fat and is emerging as the leading MR-based biomarker of liver fat content (41–45). In a recent ancillary study from the NASH Clinical Research Network (CRN), Tang and colleagues evaluated the diagnostic performance of an MR imaging–PDFF estimation technique for grading hepatic steatosis in NAFLD by using histopathologic findings as the reference standard (46). These investigators found that MR imaging–estimated PDFF correlated with histologic steatosis grade and that the correlation was unconfounded by demographic and concomitant histologic features. They also found that MR imaging PDFF provided reasonable accuracy for noninvasive classification of dichotomized steatosis grades, with areas under the receiver operating characteristic (ROC) curves (AUCs) ranging from 0.825 to 0.989, depending on the dichotomization. For each set of dichotomized steatosis grades, the following MR imaging PDFF thresholds were identified to provide 90% and higher raw specificity: 6.4% for distinguishing steatosis grade 0 versus grade 1 or higher; 17.4% for distinguishing steatosis grade 1 or less versus grade 2 or higher; and 22.1% for distinguishing steatosis grade 2 or less versus grade 3. The authors emphasized that these high-specificity thresholds were derived from the cohort in which they were tested and recommended that the thresholds be validated in independent cohorts prior to their application in clinical care or as end points in clinical trials.
Therefore, the primary purpose of our study was to evaluate, in an independent cohort of adults known to have or suspected of having NAFLD, the diagnostic performance of the NASH CRN ancillary study–derived high-specificity MR imaging PDFF thresholds (6.4%, 17.4%, and 22.1%) for classification of dichotomized steatosis grades. Secondary purposes were, in this independent cohort, to perform an ROC analysis of MR imaging PDFF for classification of dichotomized steatosis grades, identify and evaluate the diagnostic performance of cohort-derived MR imaging PDFF thresholds, and assess the correlation between MR imaging PDFF and histologic steatosis grade in the cohort.
Materials and Methods
Design and Subjects
The study was approved by an institutional review board and was compliant with the Health Insurance Portability and Accountability Act. Subjects gave written informed consent.
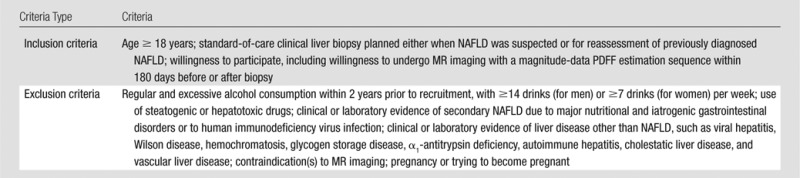
This was a single-center, cross-sectional, prospective, observational clinical study of adults known to have or suspected of having NAFLD who underwent research MR examinations and standard-of-care clinical liver biopsy within a 180-day window between December 2009 and July 2013. Subjects were recruited and enrolled prospectively from the NAFLD clinic at our institution by a hepatologist (R.L., with 5 years of experience). No change in therapeutic management was initiated between MR examination and biopsy. Eligibility criteria are summarized in Table 1.
Table 1.
Eligibility Criteria
Clinical Data
All subjects underwent a clinical research visit in the NAFLD Translational Research Unit, as directed by the study hepatologist. Demographics, alcohol use, medication use, anthropometrics, and laboratory data were collected by research coordinators working under the hepatologist’s supervision. Alcohol use, medication use, and laboratory data were used to verify eligibility but were not used in the analyses of these research data.
MR Imaging Examination
Subjects were asked to fast for a minimum of 4 hours and were examined in the supine position with a standard torso phased-array coil centered over the liver at 3.0 T (Signa Excite HDxt; GE Medical Systems, Milwaukee, Wis) with an eight-channel receive coil. A dielectric pad was placed between the coil and the body wall. To estimate MR imaging PDFF, unenhanced axial images were obtained by using a low–flip-angle, six-echo two-dimensional spoiled gradient-recalled-echo sequence with all array coil elements as described previously (38,46,47) (Appendix E1 [online]). The multiecho source images were sent offline for postprocessing.
MR Imaging Postprocessing
By using a customized plug-in algorithm that runs on Osirix software (Osirix v5.8; Pixmeo, Geneva, Switzerland), MR imaging PDFF maps were generated pixel by pixel from the source images. This algorithm simultaneously estimates T2* and PDFF by taking into account multifrequency interference of protons in fat, as described previously (38,46–48).
MR Imaging Analysis
Trained image analysts who were blinded to clinical and histologic data (J.L. and J.H., undergraduate students with at least 6 months of experience) reviewed study MR images by using the Osirix software and manually placed circular regions of interest (ROIs) in each of the nine Couinaud liver segments on the MR imaging PDFF maps in each subject. Each ROI had a radius of 1 cm and was placed near the center of each segment, while avoiding major vessels, liver edges, and artifacts. The PDFF in each of the nine ROIs was recorded, and the PDFF value across the entire liver was reported as the mean of the PDFF values of all nine ROIs, as performed by Tang et al (46). Additionally, the R2* value (calculated as 1/T2*) in each of the nine ROIs was recorded, and the mean R2* value across the nine ROIs was calculated.
Liver Biopsy
Hepatologists at our institution performed nontargeted percutaneous biopsies of the right liver lobe by using an intercostal approach in a peripheral location with a 16- or 18-gauge needle.
Histologic Analysis
A faculty hepatopathologist who was blinded to clinical and radiologic data (M.P., with 12 years of experience) scored steatosis at low to medium power by using a near-continuous scale (0%, 5%, 10%, 20%, 30%, …, 100%) according to the proportion of hepatocytes with macrovesicular steatosis. Each slide was scored twice, in separate sessions spaced at least 1 month apart. The mean of the two near-continuous steatosis scores was recorded and converted to a four-point ordinal score, as defined with the NASH CRN scoring system (38): 0 (<5% hepatocytes), 1 (5%–33% hepatocytes), 2 (33%–66% hepatocytes), and 3 (>66% hepatocytes).
In the first session, the pathologist also scored other features of NAFLD by using the NASH CRN system (38): lobular inflammation (four-point ordinal score), ballooning injury (three-point ordinal score), and fibrosis (five-point ordinal score). Iron was not graded, as iron stains are not routinely obtained for clinical standard-of-care liver biopsies in subjects known to have or suspected of having NAFLD at our institution.
Statistical Analysis
Statistical analysis was performed by a biostatistical analyst (T.W., with 20 years of experience) working under the supervision of a faculty biostatistician (A.G., with more than 15 years of experience) with statistical computing software (R version 2.15.1; R Foundation for Statistical Computing, Vienna, Austria).
Subjects’ demographic, anthropometric, histologic, and imaging information was summarized descriptively. Categorical variables were expressed as numbers and percentages. Continuous variables were expressed as means ± standard deviations.
Assessment of NASH CRN ancillary study–derived thresholds.—The four-point ordinal histologic score was dichotomized as follows: grade 0 versus grade 1 or higher, grade 1 or less versus grade 2 or higher, and grade 2 or less versus grade 3. The sensitivity, specificity, positive predictive value (PPV), and negative predictive value (NPV) of the NASH CRN ancillary study–derived MR imaging PDFF thresholds (46) (6.4% for grade 0 vs ≥1, 17.4% for grade ≤1 vs 2, and 22.1% for grade ≤2 vs 3) were calculated for each dichotomization. Exact binomial 95% confidence intervals (CIs) were computed around each parameter estimate.
ROC analysis.—ROC analysis was performed for the study cohort. For each set of dichotomized steatosis grades, the AUC was calculated. DeLong 95% CIs were computed for each AUC. The lowest MR imaging PDFF threshold values that provided at least 90% specificity for distinguishing between dichotomized steatosis grades were identified, and diagnostic performance estimates were calculated for each threshold. Additionally, sixfold cross-validation was applied to all raw performance parameters to generate cross-validated parameters. Exact binomial CIs were constructed around raw and cross-validated performance parameters.
Classification according to NASH CRN ancillary study–derived and cohort-derived thresholds.—Agreement in classification according to NASH CRN ancillary study–derived and cohort-derived thresholds was summarized descriptively and by using intraclass correlation coefficients.
Correlation analyses.—The intraclass correlation coefficients between the first and second near-continuous steatosis scores were calculated. The Pearson correlation coefficient between MR imaging PDFF and the mean near-continuous steatosis score (mean of the two readings) was computed. To explore whether the time interval between MR imaging and biopsy affected the MR imaging PDFF and steatosis score correlation, both correlation coefficients were recomputed in subsets of the cohort with progressively narrower MR imaging–biopsy time intervals (≤126 days [18 weeks], ≤84 days [12 weeks], ≤42 days [6 weeks], ≤28 days [4 weeks], ≤14 days [2 weeks], and ≤7 days [1 week]).
Multivariate modeling.—Potential confounders of the steatosis and MR imaging PDFF relationship (age, sex, body mass index, lobular inflammation, hepatocellular ballooning, fibrosis stage, and R2* as a surrogate for iron) were examined as additional covariates in a multivariable linear regression model, with steatosis as the outcome and MR imaging PDFF as the main predictor of interest. Bayesian information criterion–based stepwise regression was used to develop the optimal model for steatosis prediction.
Results
Subjects
Subjects known to have or suspected of having NAFLD in whom other causes of liver disease were excluded clinically and by means of laboratory testing underwent MR imaging and standard-of-care clinical right liver lobe biopsy within 180 days. The study included 89 subjects, 51 female (57%) and 38 male (43%), with a mean age of 51.0 years (range, 22–80 years). The mean age for women was 54.0 years (range, 24–80 years), and that for men was 46.7 years (range, 22–65 years). The time interval between MR imaging and biopsy ranged from 0 to 173 days (median, 35 days). Cohort characteristics are summarized in Table 2.
Table 2.
Characteristics in 89 Subjects

Note.—Data are numbers of patients with percentages in parentheses, unless indicated otherwise.
Data are means ± standard deviations, with ranges in parentheses.
Assessment of NASH CRN Ancillary Study–derived Thresholds
Figure 1 plots the MR imaging PDFF and the near-continuous histologic score for each subject in our cohort, stratified by the four-point ordinal steatosis grade; overlaid on the figure are the corresponding NASH CRN ancillary study–derived MR imaging PDFF thresholds (46). Example MR imaging PDFF maps are shown in Figure 2.
Figure 1:

Scatterplot shows MR imaging–estimated PDFF (mean of nine segments) versus near-continuous steatosis score (mean of two readings) according to proportion of hepatocytes with macrovesicular steatosis. Points are colored according to steatosis grade. NASH CRN–derived thresholds are shown on the y-axis.
Figure 2:
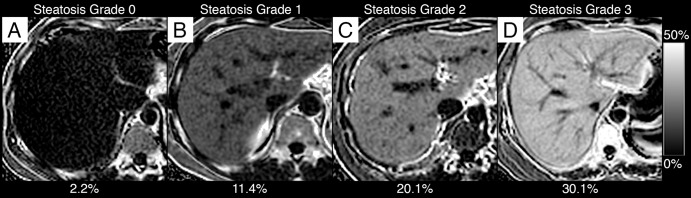
MR imaging PDFF maps in, A, a 30-year-old man with grade 0 steatosis, B, a 48-year-old woman with grade 1 steatosis, C, a 42-year-old woman with grade 2 steatosis, and, D, a 54-year old woman with grade 3 steatosis. One representative section acquired in the liver is shown for each subject. All maps were generated by using the same PDFF dynamic range (see scale bar at right). Overlaid on each Figure part is the mean PDFF calculated from ROIs placed in each liver segment.
As summarized in Table 3, the NASH CRN ancillary study–derived MR imaging PDFF threshold of 6.4% for differentiating grade 0 versus grade 1 or higher steatosis had 86% sensitivity, 83% specificity, 99% PPV, and 29% NPV. Twelve subjects had false-negative MR imaging PDFF values: MR imaging PDFF values ranged from 4.1% to 6.3%, and all had a histologic steatosis grade of 1 and mean near-continuous steatosis scores ranging from 5% to 15%. One subject had a false-positive MR imaging PDFF value: This subject had an MR imaging PDFF value of 6.5%, a histologic steatosis grade of 0, and a mean near-continuous steatosis score of 0%.
Table 3.
Diagnostic Accuracy of NASH CRN–derived MR Imaging PDFF Thresholds
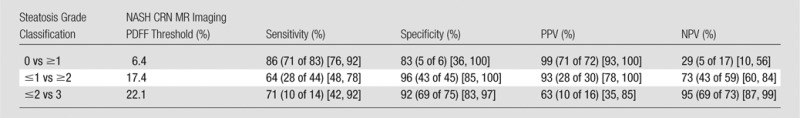
Note.—Numbers of patients in parentheses were used to calculate percentages. Numbers in brackets are 95% CIs.
The NASH CRN ancillary study–derived MR imaging PDFF threshold of 17.4% for differentiating steatosis of grade 1 or less versus grade 2 or higher steatosis had 64% sensitivity, 96% specificity, 93% PPV, and 73% NPV. Sixteen subjects had false-negative MR imaging PDFF values: They had MR imaging PDFF values ranging from 11.6% to 17.4%, histologic steatosis grades of 2 (14 subjects) and 3 (two subjects), and mean near-continuous steatosis scores ranging from 35% to 75%. Two subjects had false-positive MR imaging PDFF values: They had MR imaging PDFF values of 18.0% and 19.3%, a histologic steatosis grade of 1, and a mean near-continuous steatosis score of 30%.
The NASH CRN ancillary study–derived MR imaging PDFF threshold of 22.1% for differentiating grade 2 or less versus grade 3 steatosis had 71% sensitivity, 92% specificity, 63% PPV, and 95% NPV. Four subjects had false-negative MR imaging PDFF values: They had MR imaging PDFF values of 16.2%, 17.3%, 19.7%, and 20.0%; histologic steatosis grade of 3; and mean near-continuous steatosis scores of 75%, 70%, 80%, and 80%, respectively. Six subjects had false-positive MR imaging PDFF values: They had MR imaging PDFF values ranging from 22.6% to 29.2%, a histologic steatosis grade of 2, and mean near-continuous steatosis scores ranging from 40% to 65%.
ROC Analysis
ROC analysis results are summarized in Tables 4 and 5.
Table 4.
Diagnostic Accuracy of Cohort-derived MR Imaging PDFF Thresholds: Raw Performance Parameters
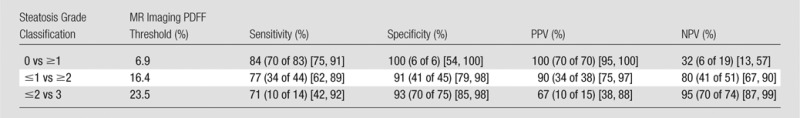
Note.—Numbers of patients in parentheses were used to calculate percentages. Numbers in brackets are 95% CIs.
Table 5.
Diagnostic Accuracy of Cohort-derived MR Imaging PDFF Thresholds: Cross-validated Performance Parameters

Note.—Numbers of patients in parentheses were used to calculate percentages. Numbers in brackets are 95% CIs.
For differentiating grade 0 from grade 1 or higher steatosis, MR imaging PDFF had an AUC of 0.961 (95% CI: 0.905, 1.0). A diagnostic threshold of 6.9% provided 84% raw sensitivity (84% cross-validated), 100% raw specificity (83% cross-validated), 100% raw PPV (99% cross-validated), and 32% raw NPV (28% cross-validated).
For differentiating grade 1 or less from grade 2 or higher steatosis, MR imaging PDFF had an AUC of 0.947 (95% CI: 0.908, 0.987). A diagnostic threshold of 16.4% provided 77% raw sensitivity (73% cross-validated), 91% raw specificity (91% cross-validated), 90% raw PPV (89% cross-validated), and 80% raw NPV (77% cross-validated).
For differentiating grade 2 or less from grade 3 steatosis, MR imaging PDFF had an AUC of 0.921 (95% CI: 0.854, 0.988). A diagnostic threshold of 23.5% provided 71% raw sensitivity (64% cross-validated), 93% raw specificity (93% cross-validated), 67% raw PPV (64% cross-validated), and 95% raw NPV (93% cross-validated).
Classification according to NASH CRN Ancillary Study–derived and Cohort-derived Thresholds
As shown in Table 6, 88% of subjects (78 of 89) were classified the same by using NASH CRN ancillary study–derived and cohort-derived thresholds. The intraclass correlation coefficient for the classification according to the NASH CRN ancillary study–derived and cohort-derived thresholds was 0.937 (95% CI: 0.888, 0.971).
Table 6.
Classification according to NASH CRN Ancillary Study and Cohort-derived Thresholds

Note.—Data are numbers of patients.
Correlation Analyses
The intraclass correlation coefficient for the pathologist’s two readings for the near-continuous score was 0.934 (95% CI: 0.889, 0.959). The Pearson correlation coefficient between the mean near-continuous steatosis score and MR imaging PDFF was 0.87 (Fig 3). The correlation ranged between 0.88 and 0.91 in subsets of the cohort, with progressively smaller time intervals between biopsy and MR imaging (Fig 3). In the 17 subjects with a time interval between MR imaging and biopsy of 7 days or less, the correlation coefficient was 0.91.
Figure 3:

Scatterplot of MR imaging–estimated PDFF versus near-continuous steatosis score (mean of two readings) is shown, according to the time interval between MR imaging and liver biopsy. No significant effect of the time interval between MR imaging and biopsy was observed on the relationship between MR imaging–estimated PDFF and steatosis.
In multivariate analysis, additional covariates (sex, age, body mass index, lobular inflammation, hepatocellular ballooning, fibrosis stage, and R2*) did not significantly affect the relationship between MR imaging PDFF and near-continuous steatosis score. The optimal model for predicting steatosis selected by using a Bayesian information criterion–based stepwise selection procedure contained MR imaging PDFF as the sole predictor.
Discussion
In an independent cohort of adults known to have or suspected of having NAFLD, we evaluated the diagnostic performance of NASH CRN ancillary study–derived high-specificity MR imaging PDFF thresholds to classify dichomomized hepatic steatosis grades. We also identified and evaluated cohort-determined high-specificity thresholds and performed correlation analyses. Subjects were recruited prospectively, and therapeutic intervention was withheld in the interim between MR imaging and biopsy.
We found that NASH CRN ancillary study–derived MR imaging PDFF thresholds had high sensitivity and specificity for the diagnosis of grade 1 or higher steatosis (46). While the thresholds had high specificity for diagnosis of grade 2 or higher and grade 3 steatosis, sensitivity was moderate. The cohort-determined thresholds provided moderate to high sensitivity while maintaining high specificity for distinguishing steatosis grade 0 versus grade 1 or higher, grade 1 or less versus grade 2 or higher, and grade 2 or less versus grade 3. Additionally, we found high correlation between MR imaging PDFF and a near-continuous histologic steatosis score, and the correlation was not affected by numerous potential confounders.
These results help to further validate MR imaging PDFF as a noninvasive biomarker of hepatic steatosis (43–45). Taking together the results of the ancillary NASH CRN study (35) and the current study, MR imaging PDFF can be used to classify subjects on the basis of dichotomized steatosis grades with moderate to high sensitivity and, depending on the dichotomization, at high specificity. Moreover, in the current study, false-negative and false-positive classifications tended to be in subjects that, on the basis of near-continuous scores, were histologically at the border zone between grades, suggesting that some of the misclassifications may have been due to the inherent limitations of histologic scoring, such as sampling variability and interpretation variability, rather than inaccuracy of the MR imaging PDFF biomarker. A study on sampling variability between two liver biopsies performed in the right lobe in patients with NAFLD demonstrated slight agreement on steatosis grade, with a κ coefficient of 0.18 (31). Furthermore, a histologic validation study performed by the NASH CRN Pathology Subcommittee on the same liver biopsy specimens demonstrated κ coefficients of 0.83 and 0.79 for intra- and interreader agreement on steatosis grade, respectively (49). Although substantial, this level of agreement is not perfect, which may explain the misclassifications. Future validation studies between MR imaging and biopsy may involve the use of histomorphometry for software-based quantitative assessment of liver fat vacuoles (50), as these automated image analysis methods have been shown to correlate with macrovesicular fat assessment by a pathologist (51), while being less affected by the interreader variability in the assessment of microvesicular and macrovesicular steatosis by pathologists (28).
Importantly, the high-specificity MR imaging PDFF thresholds identified in the two studies were close to one another (for grade 0 vs ≥1, 6.4% vs 6.9%, respectively; for grade ≤1 vs ≥2, 17.4% vs 16.4%; and for grade ≤2 vs 3, 22.5% vs 23.5%), suggesting that optimal high-specificity threshold values are in the same ranges.
In three other studies, MR imaging PDFF thresholds for diagnosis of dichotomized steatosis grades were identified. Kühn et al (52) reported an MR imaging PDFF threshold of 4.5% for diagnosis of grade 1 or higher steatosis. This threshold provided 84% sensitivity and 100% specificity. The dichotomization of other steatosis grades was defined differently (1 vs 2, 2 vs 3) from our study (≤1 vs ≥2, ≤2 vs 3) and hence cannot be compared directly with our results. Idilman et al (39) reported an MR imaging PDFF threshold of 15.0% for diagnosis of grade 2 steatosis or higher. This threshold provided 93% sensitivity and 85% specificity; the minimum threshold that provided at least 90% specificity was not reported but likely would have been slightly higher than 15.0% and may have been in a range (16.4%–17.4%) similar to the thresholds identified in our cohort and the NASH CRN cohort. Kang et al (53) reported an MR imaging PDFF threshold of 2.9% for diagnosis of grade 1 or higher steatosis. This threshold provided 94% sensitivity and 82% specificity; the minimum threshold that provided at least 90% specificity was not reported but likely would have been slightly higher than 2.9% and may have been closer to the range (6.4%–6.9%) identified in our cohort and in the NASH CRN cohort.
In four other studies, a correlation between MR imaging PDFF and a near-continuous histologic steatosis score was reported (34,39,52,53). In these other studies, correlations were reported to range from 0.82 to 0.93, in the same range as the 0.87 overall correlation observed in our cohort. In the study by Kang et al (53), iron deposition, inflammation, and fibrosis had no significant confounding effects on estimation of PDFF. Unlike our study, Idilman et al (39) found that fibrosis confounded the relationship: The correlation was lower when fibrosis was present (r = 0.60) than when fibrosis was absent (r = 0.86). It is not clear why fibrosis confounded the relationship in their study but not in the present study or the study by Kang et al.
In our study, the correlation between MR imaging PDFF and near-continuous steatosis score was not meaningfully affected by the time interval between MR imaging and biopsy, possibly because the overall correlation was high, and it would be difficult to achieve further improvement by narrowing the time interval.
One limitation of our study is that only six subjects had grade 0 steatosis. Therefore, the CIs around specificity are wide. For this reason, the threshold to diagnose grade 1 or higher steatosis should be evaluated in a cohort with a higher number of subjects without steatosis. Another limitation was that exact co-localization between biopsy site and MR imaging PDFF ROIs was not possible; hence, we averaged nine segmental ROIs. Unlike the NASH CRN ancillary study, in which biopsy samples were scored via consensus by a panel of hepatopathologists, the pathology specimens were scored by one pathologist in the present study. To improve the reliability of this assessment, near-continuous steatosis was scored twice, and the mean value was used in the analyses. Finally, iron grade was not available as part of our histologic analysis. Instead, we used R2* as a surrogate for iron to address its potential confounding effect on the relationship between steatosis and MR imaging PDFF (52).
It should be emphasized that while MR imaging PDFF is emerging as a valid biomarker for hepatic steatosis, MR imaging PDFF estimation is in itself insufficient to evaluate many critical histologic features of NAFLD, including presence of NASH, degree of necroinflammatory activity, and stage of fibrosis. The noninvasive assessment of these histologic end points will require development and validation of other noninvasive quantitative imaging biomarkers.
In conclusion, this prospective, cross-sectional study in an independent cohort of subjects known to have or suspected of having NAFLD helps to validate the high-specificity NASH CRN–derived MR imaging PDFF thresholds by using histologic steatosis grade as reference. In our cohort, these a priori thresholds provided moderate to high sensitivity while maintaining high specificity. Moreover, cohort-derived thresholds were similar, suggesting that the high-specificity threshold values are in an appropriate range. We recognize that for some clinical or research indications, high sensitivity may be preferred over high specificity, and further research will be needed to identify and validate high-sensitivity thresholds. Prospective multicenter studies in populations with geographic, racial, and ethnic diversity by using imaging units from different manufacturers and with different field strengths are now needed to further validate MR imaging PDFF as a biomarker for steatosis and establish optimal MR imaging PDFF thresholds for use in clinical care or clinical trials.
Advances in Knowledge
■ This study helps to validate, in an independent cohort of adults known to have or suspected of having nonalcoholic fatty liver disease, MR imaging–estimated proton density fat fraction (PDFF) thresholds previously derived from a Nonalcoholic Steatohepatitis Clinical Research Network (CRN) ancillary study for dichotomized steatosis grade classification.
■ A 6.4% MR imaging PDFF threshold had 86% sensitivity and 83% specificity to diagnose grade 1 or higher steatosis, a 17.4% MR imaging PDFF threshold had 64% sensitivity and 96% specificity to diagnose grade 2 or higher steatosis, and a 22.1% MR imaging PDFF threshold had 71% sensitivity and 92% specificity to diagnose grade 3 steatosis.
Implication for Patient Care
■ The Nonalcoholic Steatohepatitis CRN–derived MR imaging PDFF thresholds have moderate to high sensitivity and high specificity for diagnosis of grades 1 or higher, grade 2 or higher, and grade 3 steatosis.
APPENDIX
Received March 30, 2014; revision requested May 5; revision received June 21; accepted July 8; final version accepted July 29.
A.T. supported by the Fulbright Program, Canadian Institutes of Health Research (Fellowship Award 242199), Fonds de Recherche du Québec en Santé, and Fondation de l’Association des Radiologistes du Québec (FRQS-ARQ #26993). The study was partially conducted at the Clnical and Translational Research Institute, University of California at San Diego. R.L. was supported in part by the American Gastroenterological Association Foundation—Sucampo—ASP Designated Research Award in Geriatric Gastroenterology and by a T. Franklin Williams Scholarship Award. Funding was provided by Atlantic Philanthropies, the John A. Hartford Foundation, the Association of Specialty Professors, the American Gastroenterological Association, and grant no. K23-DK090303.
Funding: This research was supported by the National Institutes of Health (grants R01 DK075128, R01 DK061734, and R01 DK088925).
Current address: Department of Radiology, Centre Hospitalier de l’Université de Montréal (CHUM), University of Montréal, Montréal, Québec, Canada.
Current address: Department of Surgery, New York Hospital Queens, Queens, NY.
Disclosures of Conflicts of Interest: A.T. disclosed no relevant relationships. A.D. disclosed no relevant relationships. G.H. disclosed no relevant relationships. T.W. disclosed no relevant relationships. A.G. disclosed no relevant relationships. J.M. disclosed no relevant relationships. L.C. disclosed no relevant relationships. J.H. disclosed no relevant relationships. T.C. disclosed no relevant relationships. B.D.A. disclosed no relevant relationships. M.S.M. Activities related to the present article: author reports contracted work for Bayer, Genzyme, Isis, Janssen, Pfizer, Sanofi, Synageva, and Takeda. Activities not related to the present article: author is a stockholder in General Electric and Pfizer and is a consultant for Allergan. Other relationships: author has patents pending for a PDFF estimation technique and a double-bond estimation technique. M.P. disclosed no relevant relationships. R.L. disclosed no relevant relationships. C.B.S. Activities related to the present article: author received grants from NIDDK and General Electric Healthcare. Activities not related to the present article: author received grants from General Electric and Siemens Healthcare; author received personal fees from Bayer Healthcare for consulting and serving on a speaker’s bureau; author had research service agreements with ISIS, Takeda, Genzyme, Pfizer, Synageva, and BMS; author received personal fees from VirtualScopics for serving on an advisory board. Other relationships: disclosed no relevant relationships.
Abbreviations:
- AUC
- area under the ROC curve
- CI
- confidence interval
- CRN
- Clinical Research Network
- NAFLD
- nonalcoholic fatty liver disease
- NASH
- nonalcoholic steatohepatitis
- NPV
- negative predictive value
- PDFF
- proton density fat fraction
- PPV
- positive predictive value
- ROC
- receiver operating characteristic
References
- 1.Loomba R, Sanyal AJ. The global NAFLD epidemic. Nat Rev Gastroenterol Hepatol 2013;10(11):686–690. [DOI] [PubMed] [Google Scholar]
- 2.Bellentani S, Scaglioni F, Marino M, Bedogni G. Epidemiology of non-alcoholic fatty liver disease. Dig Dis 2010;28(1):155–161. [DOI] [PubMed] [Google Scholar]
- 3.Schwimmer JB, Deutsch R, Kahen T, Lavine JE, Stanley C, Behling C. Prevalence of fatty liver in children and adolescents. Pediatrics 2006;118(4):1388–1393. [DOI] [PubMed] [Google Scholar]
- 4.Argo CK, Caldwell SH. Epidemiology and natural history of non-alcoholic steatohepatitis. Clin Liver Dis 2009;13(4):511–531. [DOI] [PubMed] [Google Scholar]
- 5.Gramlich T, Kleiner DE, McCullough AJ, Matteoni CA, Boparai N, Younossi ZM. Pathologic features associated with fibrosis in nonalcoholic fatty liver disease. Hum Pathol 2004;35(2):196–199. [DOI] [PubMed] [Google Scholar]
- 6.Matteoni CA, Younossi ZM, Gramlich T, Boparai N, Liu YC, McCullough AJ. Nonalcoholic fatty liver disease: a spectrum of clinical and pathological severity. Gastroenterology 1999;116(6):1413–1419. [DOI] [PubMed] [Google Scholar]
- 7.Angulo P, Keach JC, Batts KP, Lindor KD. Independent predictors of liver fibrosis in patients with nonalcoholic steatohepatitis. Hepatology 1999;30(6):1356–1362. [DOI] [PubMed] [Google Scholar]
- 8.McCullough AJ. The epidemiology and risk factors of NASH. In: Farrell GC, George J, PdlM Hall, McCullough AJ, eds. Fatty liver disease: NASH and related disorders. Malden, Mass: Blackwell Science, 2005; 23–37. [Google Scholar]
- 9.Ekstedt M, Franzén LE, Mathiesen UL, et al. Long-term follow-up of patients with NAFLD and elevated liver enzymes. Hepatology 2006;44(4):865–873. [DOI] [PubMed] [Google Scholar]
- 10.Noureddin M, Yates KP, Vaughn IA, et al. Clinical and histological determinants of nonalcoholic steatohepatitis and advanced fibrosis in elderly patients. Hepatology 2013;58(5):1644–1654. [DOI] [PMC free article] [PubMed] [Google Scholar]
- 11.Rubinstein E, Lavine JE, Schwimmer JB. Hepatic, cardiovascular, and endocrine outcomes of the histological subphenotypes of nonalcoholic fatty liver disease. Semin Liver Dis 2008;28(4):380–385. [DOI] [PubMed] [Google Scholar]
- 12.Guzman G, Brunt EM, Petrovic LM, Chejfec G, Layden TJ, Cotler SJ. Does nonalcoholic fatty liver disease predispose patients to hepatocellular carcinoma in the absence of cirrhosis? Arch Pathol Lab Med 2008;132(11):1761–1766. [DOI] [PubMed] [Google Scholar]
- 13.Sanyal AJ, Banas C, Sargeant C, et al. Similarities and differences in outcomes of cirrhosis due to nonalcoholic steatohepatitis and hepatitis C. Hepatology 2006;43(4):682–689. [DOI] [PubMed] [Google Scholar]
- 14.Adams LA, Lymp JF, St Sauver J, et al. The natural history of nonalcoholic fatty liver disease: a population-based cohort study. Gastroenterology 2005;129(1):113–121. [DOI] [PubMed] [Google Scholar]
- 15.Adams LA, Sanderson S, Lindor KD, Angulo P. The histological course of nonalcoholic fatty liver disease: a longitudinal study of 103 patients with sequential liver biopsies. J Hepatol 2005;42(1):132–138. [DOI] [PubMed] [Google Scholar]
- 16.Targher G, Bertolini L, Padovani R, et al. Prevalence of nonalcoholic fatty liver disease and its association with cardiovascular disease among type 2 diabetic patients. Diabetes Care 2007;30(5):1212–1218. [DOI] [PubMed] [Google Scholar]
- 17.Hamaguchi M, Kojima T, Takeda N, et al. The metabolic syndrome as a predictor of nonalcoholic fatty liver disease. Ann Intern Med 2005;143(10):722–728. [DOI] [PubMed] [Google Scholar]
- 18.Chalasani N, Younossi Z, Lavine JE, et al. The diagnosis and management of non-alcoholic fatty liver disease: practice guideline by the American Association for the Study of Liver Diseases, American College of Gastroenterology, and the American Gastroenterological Association. Hepatology 2012;55(6):2005–2023. [DOI] [PubMed] [Google Scholar]
- 19.Targher G, Day CP, Bonora E. Risk of cardiovascular disease in patients with nonalcoholic fatty liver disease. N Engl J Med 2010;363(14):1341–1350. [DOI] [PubMed] [Google Scholar]
- 20.Loomba R, Abraham M, Unalp A, et al. Association between diabetes, family history of diabetes, and risk of nonalcoholic steatohepatitis and fibrosis. Hepatology 2012;56(3):943–951. [DOI] [PMC free article] [PubMed] [Google Scholar]
- 21.Loomba R, Rao F, Zhang L, et al. Genetic covariance between gamma-glutamyl transpeptidase and fatty liver risk factors: role of beta2-adrenergic receptor genetic variation in twins. Gastroenterology 2010;139(3):836–845, e1. [DOI] [PMC free article] [PubMed] [Google Scholar]
- 22.Zarrinpar A, Loomba R. Review article: the emerging interplay among the gastrointestinal tract, bile acids and incretins in the pathogenesis of diabetes and non-alcoholic fatty liver disease. Aliment Pharmacol Ther 2012;36(10):909–921. [DOI] [PMC free article] [PubMed] [Google Scholar]
- 23.Musso G, Gambino R, Cassader M, Pagano G. Meta-analysis: natural history of non-alcoholic fatty liver disease (NAFLD) and diagnostic accuracy of non-invasive tests for liver disease severity. Ann Med 2011;43(8):617–649. [DOI] [PubMed] [Google Scholar]
- 24.Stinton LM, Loomba R. Recommendations for liver biopsy evaluation in non-alcoholic fatty liver disease. Minerva Gastroenterol Dietol 2014;60(1):5–13. [PubMed] [Google Scholar]
- 25.Bravo AA, Sheth SG, Chopra S. Liver biopsy. N Engl J Med 2001;344(7):495–500. [DOI] [PubMed] [Google Scholar]
- 26.Gaidos JK, Hillner BE, Sanyal AJ. A decision analysis study of the value of a liver biopsy in nonalcoholic steatohepatitis. Liver Int 2008;28(5):650–658. [DOI] [PubMed] [Google Scholar]
- 27.Fernández-Salazar L, Velayos B, Aller R, Lozano F, Garrote JA, González JM. Percutaneous liver biopsy: patients’ point of view. Scand J Gastroenterol 2011;46(6):727–731. [DOI] [PubMed] [Google Scholar]
- 28.El-Badry AM, Breitenstein S, Jochum W, et al. Assessment of hepatic steatosis by expert pathologists: the end of a gold standard. Ann Surg 2009;250(5):691–697. [DOI] [PubMed] [Google Scholar]
- 29.Regev A, Berho M, Jeffers LJ, et al. Sampling error and intraobserver variation in liver biopsy in patients with chronic HCV infection. Am J Gastroenterol 2002;97(10):2614–2618. [DOI] [PubMed] [Google Scholar]
- 30.Bedossa P, Dargère D, Paradis V. Sampling variability of liver fibrosis in chronic hepatitis C. Hepatology 2003;38(6):1449–1457. [DOI] [PubMed] [Google Scholar]
- 31.Ratziu V, Charlotte F, Heurtier A, et al. Sampling variability of liver biopsy in nonalcoholic fatty liver disease. Gastroenterology 2005;128(7):1898–1906. [DOI] [PubMed] [Google Scholar]
- 32.Noureddin M, Loomba R. Nonalcoholic fatty liver disease: indications for liver biopsy and noninvasive biomarkers. Clin Liver Dis 2012;1(4):104–107. [DOI] [PMC free article] [PubMed] [Google Scholar]
- 33.Bydder M, Yokoo T, Hamilton G, et al. Relaxation effects in the quantification of fat using gradient echo imaging. Magn Reson Imaging 2008;26(3):347–359. [DOI] [PMC free article] [PubMed] [Google Scholar]
- 34.Hines CD, Yu H, Shimakawa A, et al. Quantification of hepatic steatosis with 3-T MR imaging: validation in ob/ob mice. Radiology 2010;254(1):119–128. [DOI] [PMC free article] [PubMed] [Google Scholar]
- 35.Hines CD, Frydrychowicz A, Hamilton G, et al. T(1) independent, T(2) (*) corrected chemical shift based fat-water separation with multi-peak fat spectral modeling is an accurate and precise measure of hepatic steatosis. J Magn Reson Imaging 2011;33(4):873–881. [DOI] [PMC free article] [PubMed] [Google Scholar]
- 36.Meisamy S, Hines CD, Hamilton G, et al. Quantification of hepatic steatosis with T1-independent, T2-corrected MR imaging with spectral modeling of fat: blinded comparison with MR spectroscopy. Radiology 2011;258(3):767–775. [DOI] [PMC free article] [PubMed] [Google Scholar]
- 37.Reeder SB, Cruite I, Hamilton G, Sirlin CB. Quantitative assessment of liver fat with magnetic resonance imaging and spectroscopy. J Magn Reson Imaging 2011;34(4):729–749. [DOI] [PMC free article] [PubMed] [Google Scholar]
- 38.Yokoo T, Shiehmorteza M, Hamilton G, et al. Estimation of hepatic proton-density fat fraction by using MR imaging at 3.0 T. Radiology 2011;258(3):749–759. [DOI] [PMC free article] [PubMed] [Google Scholar]
- 39.Idilman IS, Aniktar H, Idilman R, et al. Hepatic steatosis: quantification by proton density fat fraction with MR imaging versus liver biopsy. Radiology 2013;267(3):767–775. [DOI] [PubMed] [Google Scholar]
- 40.Zhong X, Nickel MD, Kannengiesser SA, Dale BM, Kiefer B, Bashir MR. Liver fat quantification using a multi-step adaptive fitting approach with multi-echo GRE imaging. Magn Reson Med 2013 Dec 9. [Epub ahead of print] [DOI] [PubMed] [Google Scholar]
- 41.Reeder SB, Hu HH, Sirlin CB. Proton density fat-fraction: a standardized MR-based biomarker of tissue fat concentration. J Magn Reson Imaging 2012;36(5):1011–1014. [DOI] [PMC free article] [PubMed] [Google Scholar]
- 42.Reeder SB. Emerging quantitative magnetic resonance imaging biomarkers of hepatic steatosis. Hepatology 2013;58(6):1877–1880. [DOI] [PMC free article] [PubMed] [Google Scholar]
- 43.Permutt Z, Le TA, Peterson MR, et al. Correlation between liver histology and novel magnetic resonance imaging in adult patients with non-alcoholic fatty liver disease—MRI accurately quantifies hepatic steatosis in NAFLD. Aliment Pharmacol Ther 2012;36(1):22–29. [DOI] [PMC free article] [PubMed] [Google Scholar]
- 44.Le TA, Chen J, Changchien C, et al. Effect of colesevelam on liver fat quantified by magnetic resonance in nonalcoholic steatohepatitis: a randomized controlled trial. Hepatology 2012;56(3):922–932. [DOI] [PMC free article] [PubMed] [Google Scholar]
- 45.Noureddin M, Lam J, Peterson MR, et al. Utility of magnetic resonance imaging versus histology for quantifying changes in liver fat in nonalcoholic fatty liver disease trials. Hepatology 2013;58(6):1930–1940. [DOI] [PMC free article] [PubMed] [Google Scholar]
- 46.Tang A, Tan J, Sun M, et al. Nonalcoholic fatty liver disease: MR imaging of liver proton density fat fraction to assess hepatic steatosis. Radiology 2013;267(2):422–431. [DOI] [PMC free article] [PubMed] [Google Scholar]
- 47.Yokoo T, Bydder M, Hamilton G, et al. Nonalcoholic fatty liver disease: diagnostic and fat-grading accuracy of low-flip-angle multiecho gradient-recalled-echo MR imaging at 1.5 T. Radiology 2009;251(1):67–76. [DOI] [PMC free article] [PubMed] [Google Scholar]
- 48.Hamilton G, Yokoo T, Bydder M, et al. In vivo characterization of the liver fat ¹H MR spectrum. NMR Biomed 2011;24(7):784–790. [DOI] [PMC free article] [PubMed] [Google Scholar]
- 49.Kleiner DE, Brunt EM, Van Natta M, et al. Design and validation of a histological scoring system for nonalcoholic fatty liver disease. Hepatology 2005;41(6):1313–1321. [DOI] [PubMed] [Google Scholar]
- 50.Longo R, Pollesello P, Ricci C, et al. Proton MR spectroscopy in quantitative in vivo determination of fat content in human liver steatosis. J Magn Reson Imaging 1995;5(3):281–285. [DOI] [PubMed] [Google Scholar]
- 51.Marsman H, Matsushita T, Dierkhising R, et al. Assessment of donor liver steatosis: pathologist or automated software? Hum Pathol 2004;35(4):430–435. [DOI] [PubMed] [Google Scholar]
- 52.Kühn JP, Hernando D, Muñoz del Rio A, et al. Effect of multipeak spectral modeling of fat for liver iron and fat quantification: correlation of biopsy with MR imaging results. Radiology 2012;265(1):133–142. [DOI] [PMC free article] [PubMed] [Google Scholar]
- 53.Kang BK, Yu ES, Lee SS, et al. Hepatic fat quantification: a prospective comparison of magnetic resonance spectroscopy and analysis methods for chemical-shift gradient echo magnetic resonance imaging with histologic assessment as the reference standard. Invest Radiol 2012;47(6):368–375. [DOI] [PubMed] [Google Scholar]
Associated Data
This section collects any data citations, data availability statements, or supplementary materials included in this article.