

T2* evaluation of the cartilaginous end plate by using MR imaging with very short echo times can allow quantitative estimation of biochemical composition; however, the accuracy of the estimates depends on the orientation of the end plate in relation to the magnetic field.
Abstract
Purpose
To measure the T2* of the human cartilaginous end plate by using magnetic resonance (MR) imaging with very short echo times and to determine the effect of the orientation of the end plate on T2* and on relationships between T2* and biochemical composition.
Materials and Methods
This study was exempt from institutional review board approval, and informed consent was not required. Thirty-four samples of three cadaveric lumbar spines (from subjects who died at ages 51, 57, and 66 years) containing cartilaginous end plates and subchondral bone were prepared. Samples were imaged with a 3-T imager for T2* quantification by using a three-dimensional very short echo time sequence (repetition time msec/echo times msec, 30/0.075, 2, 5, 12, 18). Samples were imaged with the end plate at three orientations with respect to the constant magnetic induction field: 0°, 54.7°, and 90°. After imaging, the cartilage was assayed for its water, glycosaminoglycan, and collagen content. Pearson correlations were used to investigate the effect of orientation on the relationships between T2* and biochemical composition.
Results
T2* was significantly longer when measured at an orientation of 54.7° (21.8 msec ± 2.8 [± standard error of the mean]) than at 0° (10.0 msec ± 0.7, P < .001) or 90° (9.9 msec ± 0.4, P < .001). At 54.7°, T2* was highly correlated with glycosaminoglycan content (r = 0.85, P < .001), the collagen-to-glycosaminoglycan ratio (r = −0.79, P < .001), and water content (r = 0.62, P = .02); at 0° and 90°, there were no significant differences in these relationships, with a minimum P value of .19.
Conclusion
T2* evaluation can allow noninvasive estimation of the degeneration of the cartilaginous end plate; however, the accuracy of T2*-based estimates of biochemical composition depends on the orientation of the end plate.
© RSNA, 2014
Introduction
The cartilaginous end plate is critical to maintenance of proper intervertebral disc health. This 0.1–1.6-mm layer of hyaline cartilage separates the vertebra from the disc and functions both as a barrier to resist disc pressure and as a gateway to regulate disc nutrient and metabolite transport. Although failure of these functions is suspected to compromise disc health (1,2), the relationship between end plate dysfunction and disc degeneration remains poorly understood. The most widely used clinical tool for evaluating disc health is magnetic resonance (MR) imaging. However, conventional MR sequences used in the spine are unable to show the cartilaginous end plate, because the cartilage has short T2 values, and thus, its signal is not captured in sequences with long echo times. As a result of this limitation and because damage to the cartilaginous end plate itself is highly associated with innervation (3) and pain (4,5), there remains a need to develop imaging approaches that permit quantitative evaluation of end plate degeneration (6).
One possible approach for evaluating end plate degeneration with MR imaging is a combination of specialized radiofrequency excitation with radial trajectories from the center of the k-space to produce pulse sequences with echo times 100–1000 times shorter than those of conventional sequences (7). For the spine, these very short echo time (UTE, often referred to as “ultrashort” echo time) sequences can capture the signal of the cartilaginous end plate (8) and have been used to assess cartilaginous end plate defects in vivo (9). However, it is unknown whether UTE imaging can allow quantitative estimation of the biochemical composition of the cartilaginous end plate, which influences the biomechanical (10) and transport properties (11) of the end plate and deteriorates dramatically with age (12). Furthermore, the dependence of signal intensity and relaxation time on orientation of the end plate in relation to the magnetic field, which is well documented for articular cartilage (13,14), also is unknown. Thus, the purpose of our study was to measure the T2* of the cartilaginous end plate with UTE MR imaging and to determine the effect of end plate orientation on T2* and on relationships between T2* and biochemical composition in human cartilaginous end plates.
Materials and Methods
Specimen Preparation
Our cadaveric study was exempt from institutional approval; informed consent was not required. Three freshly frozen cadaveric lumbar spines (L2-S1) were obtained from male donors (ages 51, 57, and 66 years) who had no history of musculoskeletal disorders. After the musculature and posterior elements were removed, bone-disc-bone motion segments were transected from the spines and cut into parasagittal slabs with a thickness of 7 mm. One medial slab was randomly chosen from each spine and further processed to create 37 rectangular end plate samples (8 × 10 × 10 mm) comprising the cartilaginous end plate and subchondral bone. Samples were prepared from tissue adjacent to the nucleus pulposus, where the end plate is flattest, the cartilage is thinnest (approximately 0.6 mm [15,16]), and the collagen fibers are parallel the vertebral surface (17,18).
MR Imaging
The end plate samples were imaged with a 3.0-T MR imager (Discovery MR750 W; GE Healthcare, Waukesha, Wis) with an eight-channel phased-array wrist coil (Invivo, Gainesville, Fla). Before they were imaged, samples were secured in a plastic sample holder with a 5 × 5 grid of wells. Samples were immersed in phosphate-buffered saline and equilibrated for 30 minutes before imaging.
At the time of imaging, the sample holder was positioned in the coil and then placed into the MR unit. The holder was positioned such that the end plates were imaged at three orientations with respect to the constant magnetic induction field. In the first experiment, 14 samples were imaged twice, at 0° and at 54.7°. These orientations were selected on the basis of the geometric factor (3cos2θ − 1) that governs the dipolar Hamiltonian coupling. This factor is maximized at 0° and is 0 at 54.7°, the so-called magic angle (19). Hence, those angles maximized any orientation-related differences in signal intensity and relaxation time. In a second experiment, the remaining 23 samples were imaged at 90°, which approximated the in vivo orientation of the end plates in the middle-to-upper lumbar spine.
The imaging protocol included a three-dimensional UTE sequence that combined a nonselective hard pulse (duration, 200 μsec) and three-dimensional radial acquisition. The flip angle was optimized to 19°, assuming a T1 of 540 msec (16), and radiofrequency spoiling was incorporated. To measure T2*, imaging was performed with echo times of 75 μsec and 2, 5, 12, and 18 msec by using a 30-msec repetition time. The first experiment was performed with a resolution of 0.22 × 0.22 × 0.80 mm3 and a field of view of 7.5 × 7.5 × 2 cm3, and the second experiment was performed with a resolution of 0.22 × 0.22 × 0.90 mm3 and a field of view of 10 × 10 × 2 cm3. Fat suppression was applied every fourth radial-spoke acquisition to reduce bone marrow signal intensity. After acquisition, images were reconstructed to produce an isotropic voxel size of 0.22 mm by applying three-dimensional gridding by using a Kaiser-Bessel kernel followed by an inverse Fourier transform.
MR Image Evaluation
By using the images acquired at the five echo times, T2* maps were calculated on a voxel-by-voxel basis by fitting the measured signal intensity to the exponential decay function: S (TE) ∝ S0 · exp (−TE/T2*), where S is the signal intensity of a given voxel, TE is echo time, and S0 is the equilibrium signal intensity. The nonlinear fitting algorithm included an interior trust region approach (20) implemented by using software (Matlab; MathWorks, Natick, Mass). For the samples imaged twice, at 0° and 54.7° orientation, the mean T2* was calculated in three regions of interest (each with an area of 2 mm2) placed at site-matched locations in the images collected at each angle. The three regions of interest coincided with three layers, each 1 voxel thick, which spanned the thickness of the cartilaginous end plate: the surface layer, middle layer, and deep layer. The mean T2* was calculated in similarly placed regions of interest for the samples that were imaged at 90°.
Biochemical Analysis
After imaging, the cartilaginous end plate was removed from the subchondral bone and assayed for its water, glycosaminoglycan (GAG), and collagen content. First, the tissue was weighed before and after lyophilization. Next, the tissue was digested in 1 mg of papain per milliliter of water (Sigma-Aldrich, St. Louis, Mo) for 20 hours at 60°C. GAG content was determined by using a dimethylmethylene blue binding assay (21) that referenced the absorbance of the papain digests (optical density read at a wavelength of 525 nm) to a standard curve produced with chondroitin sulfate C (chondroitin 6-sulfate; Sigma-Aldrich). Aliquots of the remaining papain digests were also hydrolyzed in 6 molar hydrochloric acid solution for 24 hours at 110°C. Collagen content was calculated from the amount of hydroxyproline, which we determined by using a chloramine-T colorimetric assay (chloramine-T hydrate; Sigma-Aldrich [22]) that referenced the absorbance of the lysate (optical density read at a wavelength of 570 nm) to a commercial hydroxyproline standard solution (trans-4-Hydroxy-l-proline; Sigma-Aldrich).
In Situ MR Imaging
We also investigated the feasibility of quantitative evaluation of the end plate in situ. One human cadaver (a 37-year-old man) was imaged 96 hours after death. The cadaver was imaged by using the MR unit with a table designed to reduce patient motion (Geometry Embracing Method Express, GE Healthcare) containing an integrated coil array. The lumbar spine was imaged in the sagittal plane by using a three-dimensional UTE sequence that incorporated a minimum-phase radiofrequency pulse (duration, 432 μsec) instead of a nonselective hard pulse to limit the slab-direction field of view. Sequence parameters included repetition time msec/echo time μsec, 12/260; flip angle, 15°; field of view, 36 × 18 × 10.8 cm3 (sagittal plane); resolution, 0.5 × 0.5 × 3 mm3; and imaging time,18 min.
To perform T2* mapping of the lower lumbar spine (L4-S1), we also performed UTE imaging with a repetition time of 24 msec and four echo times of 292 μsec and 2, 10, and 18 msec; flip angle, 15°; field of view, 24 × 14 × 6 cm3; resolution, 0.65 × 0.65 × 3 mm3; and imaging time, 48 min. Only data from two coil elements near the lower lumbar spine were used for reconstruction. T2* mapping was performed as described previously.
Statistical Analysis
Analysis of variance with Tukey-Kramer post hoc tests was used to determine the effect of the angle on T2*. Paired t tests with Holm-Bonferroni adjustments for multiple comparisons (23) were used to compare T2* in the end plate regions. Independent associations between T2* and the biochemical outcomes were quantified by using the Pearson correlation coefficient. All analyses were performed by using software (JMP 11; SAS Institute, Cary, NC). A P value of .05 was considered to indicate a significant difference. For the paired t tests, Holm-Bonferroni corrections reduced the smallest α level required to demonstrate a significant difference to P values of .008 for samples imaged at 0° and 54.7° and .017 for samples imaged at 90°. Data were given as means ± standard error of the mean.
Results
Comparison of the UTE images acquired with the end plate in different orientations showed that the signal intensity and mean T2* values were significantly dependent on the orientation. The cartilaginous end plate generated high signal intensity at both 0° and 54.7°, but the signal intensity was higher at 54.7° (Fig 1). The mean T2* of the cartilage at 0° was 10.0 msec ± 0.7. The mean T2* at 54.7° was 21.8 msec ± 2.8, more than two times higher (P < .001; Table, Fig 1).
Figure 1:
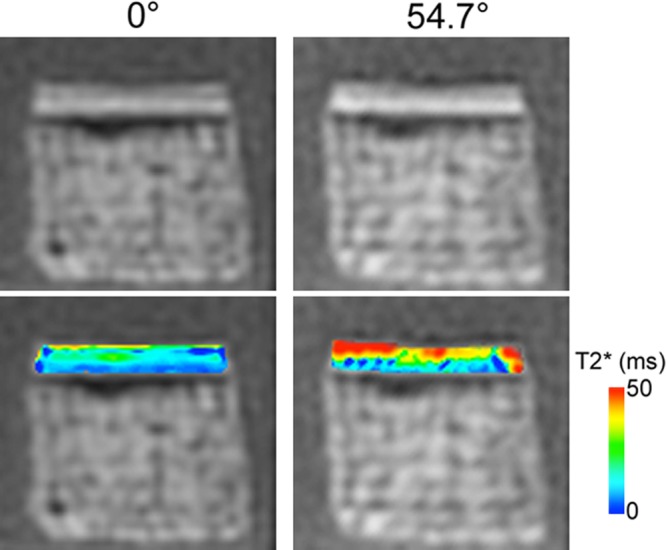
UTE images (top) with echo time of 75 μs and T2* maps (bottom) of a typical cartilaginous end plate sample imaged at 0° and 54.7° orientation show greater signal intensity and T2* at 54.7°. ms = Milliseconds.
Mean T2* and Biochemical Compositions for Two Groups of Cartilaginous End Plates Imaged in Three Different Orientations
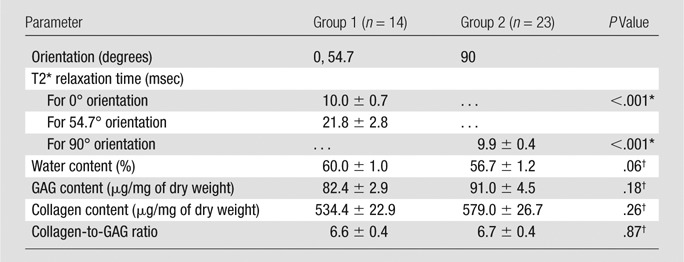
Note.—All data means ± standard error of the mean.
For comparison with 54.7° orientation
Group 1 versus group 2.
Relationships between T2* and biochemical composition also demonstrated appreciable orientation dependence (Fig 2). Variation in T2* between end plates at 54.7° was highly correlated with GAG content (r = 0.85, P < .001), the collagen-to-GAG ratio (r = −0.78, P < .001), and water content (r = 0.62, P = .02); however, at 0° these relationships were not significant, with a minimum P value of .19. As expected, the biochemical constituents also were correlated with one another. Water content was correlated positively with GAG content (r = 0.78, P < .001) and negatively correlated with the collagen-to-GAG ratio (r = −0.61, P = .02).
Figure 2:

Scatterplots show relationships between mean T2* and biochemical composition for cartilaginous end plate samples imaged at 0° (left), 54.7° (middle), and 90° (right). T2* variation at 54.7° was significantly associated with GAG content, the collagen-to-GAG ratio, and water content. T2* variation at 0° and 90° (approximate in vivo orientation in the middle-to-upper lumbar spine) was not associated with biochemical composition. All end plate samples were harvested from the same spines; however, samples imaged at 0° and 54.7° (n = 14) were different from those imaged at 90° (n = 23). ms = Milliseconds.
Although the relationships between T2* and biochemical composition depended on sample orientation, depth-wise trends in cartilaginous end plate T2* were similar in both orientations. T2* decreased significantly with depth at 0° and 54.7° (Fig 3). At 0°, T2* decreased by 37% from 12.7 msec at the surface layer to 7.9 msec in the deep layer; at 54.7°, it decreased by 52%, from 28.5 msec to 13.7 msec.
Figure 3:

Bar graphs show comparison of T2* for surface, middle, and deep regions of cartilaginous end plate for samples imaged at different orientations. At 0° and 90°, all comparisons showed significant differences (at 0°: surface vs middle, P < .001; surface vs deep, P < .001; middle vs deep P = .05; at 90°: surface vs middle, P = .04; surface vs deep, P = .002; middle vs deep, P = .002). At 54.7°, T2* in the deep region was significantly shorter than in the other regions. (deep vs surface, P = .02; deep vs middle, P = .008). Data are mean ± standard error of the mean for 14 samples per group (0° and 54.7°) or 23 samples per group (90°). ms = Milliseconds.
At 90°, which is the approximate in vivo orientation in the middle-to-upper lumbar spine, end plates demonstrated imaging characteristics that were more similar to those observed at 0° than at 54.7°. The mean T2* was more than 50% shorter than that at 54.7° (Table), it was not correlated with biochemical composition (Fig 2), and it decreased significantly with depth (Fig 3). The biochemical composition of the cartilaginous end plates imaged at 90° was not significantly different from that of the samples imaged at 0° and 54.7° (Table).
A preliminary evaluation of the end plate’s imaging appearance and T2* in situ confirmed the ex situ observations (Fig 4). The signal intensity of the cartilaginous end plate was notably higher at L4-L5 and L5-S1 (approximately 55° orientation) than at L1-L4 (approximately 90° orientation). In addition, T2* mapping of midsagittal sections from L4-L5 and L5-S1 revealed that T2* was 10–45 msec, which is similar to the range observed for the midsagittal end plate samples imaged at 54.7° ex situ.
Figure 4:
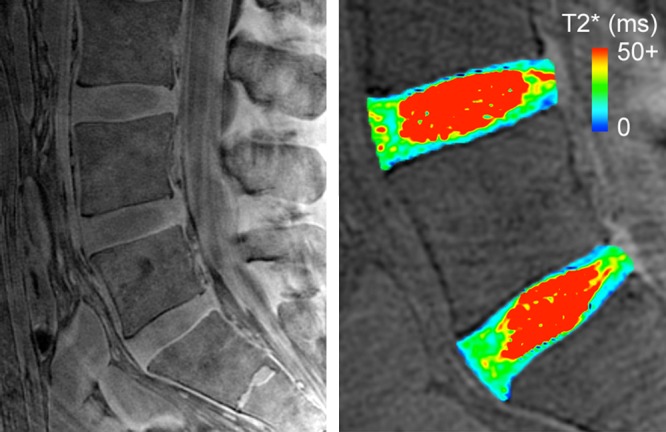
Midsagittal UTE image (left) with echo time of 292 μs from a 37-year-old male donor showed higher end plate signal intensity in lower lumbar region than in middle-to-upper lumbar region. For reference, cartilaginous end plate caudal to L5 disc was approximately 50°, the cartilaginous end plates cranial to L3 disc and caudal to L4 disc were approximately 90°. T2* map (right) of L4 and L5 discs in lower lumbar region showed T2* of 10–40 msec, which appeared to decrease with depth. ms = Milliseconds.
Discussion
On UTE images of cadaveric lumbar end plates, we observed that signal intensity and T2* were appreciably dependent on the orientation of the end plate: signal intensity was higher and T2* was longer when the end plate was imaged in an oblique orientation to the constant magnetic induction field (54.7° angle) than when the end plate was imaged in a parallel (0° angle) or perpendicular (90° angle) orientation to the magnetic field. This so-called magic angle effect is similar to that reported for samples of articular cartilage (13,14,24) and tendons (25) imaged with multiple orientations and suggests that differences in orientation could cause the end plates in the lower lumbar spine (50–60° orientation) to appear brighter on an image and to have a longer T2* than end plates in the middle-to-upper lumbar spine (approximately 90° orientation). We also extended past work (8,9) by relating the cartilaginous end plate T2* to biochemical composition, which revealed that variation in T2* at 54.7°, but not at 0° or 90°, was highly correlated (|r| = 0.62–0.85) with GAG content, the collagen-to-GAG ratio, and water content. Prior work demonstrated that the collagen-to-GAG ratio and the GAG and water content significantly influence the end plate’s biomechanical (10) and transport (11) properties and that end plate biochemical composition deteriorates dramatically with age (12). Taken together, these findings indicate that T2* evaluation of the cartilaginous end plate with UTE MR imaging can provide quantitative estimates of biochemical composition; however, the accuracy of the estimates depends on the orientation of the end plate with respect to the constant magnetic induction field.
The observed orientation dependence of the imaging appearance and T2* of the end plate has potential clinical implications for qualitative and quantitative evaluation of end plate degeneration. The finding that end plate signal intensity increased at 54.7° suggests that magic angle effects could confound clinical UTE-based evaluation of cartilaginous end plate integrity. For example, orientation-related differences in signal intensity may exceed the changes produced by cartilage thinning or damage, and thereby reduce diagnostic sensitivity. Likewise, magic angle effects could limit the use of T2* as an imaging biomarker for end plate degeneration because orientation-related differences in T2* may exceed the changes associated with biochemical deterioration.
A second interpretation of this orientation dependence suggests the value of optimizing T2* analysis by limiting evaluation to certain levels of the spine. For example, when a patient is positioned in an MR imager, end plate orientation is approximately 55° at L4-L5 and L5-S1; hence, these levels may be ideal for T2* evaluation. End plates at L4-L5 and L5-S1 had a similar range of T2* values in situ, as did end plates imaged at 54.7° ex situ. Although limiting T2* analysis to L4-S1 is clearly restrictive, end plate pathologies occur most frequently at L4-L5 and L5-S1.
Imaging the end plates at 54.7° increased T2* and its variation between samples, and this variation in T2* between samples was highly correlated with biochemical composition. A likely explanation for these findings relates to the structural anisotropy of the cartilaginous end plate and its contribution to proton mobility. Cartilaginous end plate microstructure consists primarily of type II collagen and entangled GAGs (26). The water molecules bound to the collagen and GAGs have restricted mobility, so they contribute to spin-spin relaxation through angularly dependent dipole to dipole interactions (13,19). This causes the short T2* when the cartilage is imaged in a parallel orientation to the constant magnetic induction field (0° angle). However, at the magic angle (54.7°), the dipole to dipole interactions vanish, thereby increasing T2*. The longer T2* mainly reflects the spin-spin relaxation associated with mobile water, which we estimated by means of lyophilization of the cartilage. Because this water content depends on the amount of GAGs that attract water and collagen that resists swelling, end plates with higher GAG content and lower collagen-to-GAG ratios had significantly greater water content, and thus, longer T2* values. Bound and mobile water is suspected to have unique contributions to T2* (24). Hence, our findings suggest that T2* analysis of the end plate at 54.7° may provide meaningful insight into the mobile water component. In a sense, magic angle imaging is a convenient method of isolating the contributions of mobile water content, and by extrapolation, the contributions of GAG and collagen content.
Besides providing insight into the relative quantities of the matrix constituents, T2* analysis also appears to be sensitive to their spatial distribution. Spatial mapping and quantitative comparison indicated that T2* decreased with increasing depth from the cartilage surface. This is consistent with observations that water and GAG content decreases and collagen content increases with depth (15). Spatial variation in T2* could also reflect variation in collagen anisotropy, as was demonstrated in articular cartilage (27). This may be especially true at 0° and 90°, where any variation in collagen anisotropy is expected to have an appreciable contribution to T2*. Yet, the available data suggest that collagen fiber orientation is uniform through the thickness of the end plate (15,17). Nevertheless, collagen anisotropy in the cartilaginous end plate, including any changes with age or degeneration, is not well understood. Thus, detailed analysis of collagen anisotropy and T2* mapping in end plates from donors with varying ages and stages of degeneration represents an interesting future study, because it may clarify the spatial trends in T2*.
Our study had several limitations. Most importantly, we imaged the end plates ex situ. Although removing the samples from the surrounding tissue ensured precision when colocating the biochemical and T2* analyses, this may have subjected the end plates to different amounts of inhomogeneous swelling, resulting in artificial increases in T2*. However, a preliminary analysis indicated that end plates imaged in situ and ex situ had a similar range of T2* values. That finding, in combination with the assumption that any increases in T2* due to tissue swelling are likely to be small compared with the effect of sample orientation, suggests that imaging the end plates in situ is unlikely to change our main conclusions. A second limitation is that we immersed the end plate samples in saline solution, which may have leached collagen and GAGs from the cartilage. Yet, the collagen content (563.8 μg/mg of dry weight ± 18.8, all samples pooled) and GAG content (87.7 μg/mg of dry weight ± 3.1) were similar to the values reported previously for end plates from 51–66 year-old donors (collagen, 558.5 μg/mg of dry weight ± 32.8; GAG, 99.8 μg/mg of dry weight ± 7.1) (10), which suggests that any leaching is minor. A third limitation is that we imaged end plates from just three spines, with a narrow subject age range. Although the age range typified that of patients seeking care for end plate-related pathologies (28), expansion to larger cohorts with older and younger donors is clearly desirable. In addition, the freeze-thaw cycle could affect the T2* of the end plate samples, although results of a recent UTE study showed that repetitive freeze-thaw cycles had no significant effect on T2* values in tendons (29).
One technical caveat is that we imaged the end plate samples with a longer minimum echo time and low spatial resolution, which prevented us from accurately measuring the T2* of the calcified cartilage. By using a shorter echo time (8 μsec vs 75 μsec in our study) and a higher spatial resolution (100 μm vs 220 μm in our study), Bae et al (8) found that the cartilaginous end plate had a bilaminar appearance: an approximately 100-μm–thick lower region with high signal intensity and an approximately 1-mm–thick upper region with intermediate signal intensity. This bilaminar appearance was attributed to the thin calcified cartilage and the thick uncalcified cartilage. Although the bilaminar appearance was evident in our study (Fig 1), it is possible that the thin region with high signal intensity reflects both the uncalcified and calcified components owing to partial volume effects. In relation to this, the T2* of the deep layer of cartilage also may contain contributions from both components. Additional studies with higher resolution are required to measure the T2* of the calcified cartilage and to assess its orientation dependence.
Quantitative evaluation of cartilaginous end plate degeneration with UTE imaging provides a method for addressing the unmet clinical need for more sensitive and quantitative diagnostic tools to assess spine health, for which the end plates are important. Conventional MR imaging sequences do not depict subtle end plate damage that is associated with neoinnervation and with pain; and these sequences are not sensitive to the compositional traits that influence end plate function. Consequently, the clinical significance of end plate damage and the importance of end plate dysfunction in low back pain remain uncertain. UTE imaging, which shows the structure of the cartilaginous end plate and is sensitive to end plate biochemical composition, has the potential to address these uncertainties. It is also likely that UTE imaging will help identify discs that are appropriate for regeneration or repair. This is because the success of technologies to regenerate or biologically repair a painful disc may depend, ultimately, on proper end plate function to ensure adequate disc cell nutrition. Thus, noninvasive techniques for evaluating end plate function will be important for patient selection, and therefore, ultimately may help improve treatment outcomes. In this regard, T2* analysis of the cartilaginous end plate with UTE MR imaging may be an effective imaging biomarker at lower lumbar spinal levels.
Advances in Knowledge
■ MR imaging at 3 T with very short echo times can be used to evaluate the T2* of the cartilaginous end plate.
■ The signal intensity and T2* of the cartilaginous end plate were dependent on orientation: signal intensity was higher and T2* was two times longer (P < .001) when the end plate was imaged oblique to the magnetic field (54.7° angle) than when it was imaged parallel (0° angle) or perpendicular (90° angle) to the magnetic field.
■ Cartilaginous end plate T2* variation at 54.7° was highly correlated with glycosaminoglycan content (r = 0.85, P < .001), the collagen-to-glycosaminoglycan ratio (r = −0.78, P < .001), and water content (r = 0.62, P = .02); however, at 0° and 90° there were no significant differences in these relationships, with a minimum P value of .19.
Implication for Patient Care
■ MR imaging with very short echo times can be used for quantitative evaluation of cartilaginous end plate degeneration, which associates with neoinnervation and with pain; changes in T2* may provide a marker for end plate biochemical deterioration in the lower lumbar spine.
Acknowledgments
Acknowledgment
We thank Peder Larson, PhD, Department of Radiology and Biomedical Imaging, University of California-San Francisco for his assistance with UTE sequence optimization.
Received May 13, 2014; revision requested June 9; revision received July 21; accepted August 1; final version accepted August 13.
Supported by Relievant Medsystems.
Funding: This research was supported by the National Institutes of Health (grant AR063705).
Disclosures of Conflicts of Interest: A.J.F. disclosed no relevant relationships. M.H. disclosed no relevant relationships. R.K. disclosed no relevant relationships. J.C.L. Activities related to the present article: received grant as a scientific advisor for Relievant. Activities not related to the present article: owns stock in Relievant. Other relationships: disclosed no relevant relationships.
Abbreviations:
- GAG
- glycosaminoglycan
- UTE
- very short (“ultrashort”) echo time
References
- 1.Adams MA, Freeman BJ, Morrison HP, Nelson IW, Dolan P. Mechanical initiation of intervertebral disc degeneration. Spine 2000;25(13):1625–1636. [DOI] [PubMed] [Google Scholar]
- 2.Urban JP, Holm S, Maroudas A, Nachemson A. Nutrition of the intervertebral disk. An in vivo study of solute transport. Clin Orthop Relat Res 1977;(129):101–114. [PubMed] [Google Scholar]
- 3.Fields AJ, Liebenberg EC, Lotz JC. Innervation of pathologies in the lumbar vertebral end plate and intervertebral disc. Spine J 2014;14(3):513–521. [DOI] [PMC free article] [PubMed] [Google Scholar]
- 4.Brown MF, Hukkanen MV, McCarthy ID, et al. Sensory and sympathetic innervation of the vertebral endplate in patients with degenerative disc disease. J Bone Joint Surg Br 1997;79(1):147–153. [DOI] [PubMed] [Google Scholar]
- 5.Ohtori S, Inoue G, Ito T, et al. Tumor necrosis factor-immunoreactive cells and PGP 9.5-immunoreactive nerve fibers in vertebral endplates of patients with discogenic low back Pain and Modic Type 1 or Type 2 changes on MRI. Spine 2006;31(9):1026–1031. [DOI] [PubMed] [Google Scholar]
- 6.Lotz JC, Fields AJ, Liebenberg EC. The role of the vertebral end plate in low back pain. Global Spine J 2013;3(3):153–164. [DOI] [PMC free article] [PubMed] [Google Scholar]
- 7.Robson MD, Gatehouse PD, Bydder M, Bydder GM. Magnetic resonance: an introduction to ultrashort TE (UTE) imaging. J Comput Assist Tomogr 2003;27(6):825–846. [DOI] [PubMed] [Google Scholar]
- 8.Bae WC, Statum S, Zhang Z, et al. Morphology of the cartilaginous endplates in human intervertebral disks with ultrashort echo time MR imaging. Radiology 2013;266(2):564–574. [DOI] [PMC free article] [PubMed] [Google Scholar]
- 9.Law T, Anthony MP, Chan Q, et al. Ultrashort time-to-echo MRI of the cartilaginous endplate: technique and association with intervertebral disc degeneration. J Med Imaging Radiat Oncol 2013;57(4):427–434. [DOI] [PubMed] [Google Scholar]
- 10.Fields AJ, Rodriguez D, Gary KN, Liebenberg EC, Lotz JC. Influence of biochemical composition on endplate cartilage tensile properties in the human lumbar spine. J Orthop Res 2014;32(2):245–252. [DOI] [PMC free article] [PubMed] [Google Scholar]
- 11.Roberts S, Urban JP, Evans H, Eisenstein SM. Transport properties of the human cartilage endplate in relation to its composition and calcification. Spine 1996;21(4):415–420. [DOI] [PubMed] [Google Scholar]
- 12.Antoniou J, Goudsouzian NM, Heathfield TF, et al. The human lumbar endplate. Evidence of changes in biosynthesis and denaturation of the extracellular matrix with growth, maturation, aging, and degeneration. Spine 1996;21(10):1153–1161. [DOI] [PubMed] [Google Scholar]
- 13.Henkelman RM, Stanisz GJ, Kim JK, Bronskill MJ. Anisotropy of NMR properties of tissues. Magn Reson Med 1994;32(5):592–601. [DOI] [PubMed] [Google Scholar]
- 14.Xia Y. Relaxation anisotropy in cartilage by NMR microscopy (muMRI) at 14-microm resolution. Magn Reson Med 1998;39(6):941–949. [DOI] [PubMed] [Google Scholar]
- 15.Roberts S, Menage J, Urban JP. Biochemical and structural properties of the cartilage end-plate and its relation to the intervertebral disc. Spine 1989;14(2):166–174. [DOI] [PubMed] [Google Scholar]
- 16.Moon SM, Yoder JH, Wright AC, Smith LJ, Vresilovic EJ, Elliott DM. Evaluation of intervertebral disc cartilaginous endplate structure using magnetic resonance imaging. Eur Spine J 2013;22(8):1820–1828. [DOI] [PMC free article] [PubMed] [Google Scholar]
- 17.Paietta RC, Burger EL, Ferguson VL. Mineralization and collagen orientation throughout aging at the vertebral endplate in the human lumbar spine. J Struct Biol 2013;184(2):310–320. [DOI] [PubMed] [Google Scholar]
- 18.Reiser KM, Bratton C, Yankelevich DR, Knoesen A, Rocha-Mendoza I, Lotz J. Quantitative analysis of structural disorder in intervertebral disks using second harmonic generation imaging: comparison with morphometric analysis. J Biomed Opt 2007;12(6):064019. [DOI] [PubMed] [Google Scholar]
- 19.Erickson SJ, Prost RW, Timins ME. The “magic angle” effect: background physics and clinical relevance. Radiology 1993;188(1):23–25. [DOI] [PubMed] [Google Scholar]
- 20.Coleman TF, Li YY. An interior trust region approach for nonlinear minimization subject to bounds. SIAM J Optim 1996;6(2):418–445. [Google Scholar]
- 21.Farndale RW, Buttle DJ, Barrett AJ. Improved quantitation and discrimination of sulphated glycosaminoglycans by use of dimethylmethylene blue. Biochim Biophys Acta 1986;883(2):173–177. [DOI] [PubMed] [Google Scholar]
- 22.Woessner JF, Jr. The determination of hydroxyproline in tissue and protein samples containing small proportions of this imino acid. Arch Biochem Biophys 1961;93:440–447. [DOI] [PubMed] [Google Scholar]
- 23.Holm S. A simple sequentially rejective multiple test procedure. Scand J Stat 1979;6(2):65–70. [Google Scholar]
- 24.Pauli C, Bae WC, Lee M, et al. Ultrashort-echo time MR imaging of the patella with bicomponent analysis: correlation with histopathologic and polarized light microscopic findings. Radiology 2012;264(2):484–493. [DOI] [PMC free article] [PubMed] [Google Scholar]
- 25.Du J, Pak BC, Znamirowski R, et al. Magic angle effect in magnetic resonance imaging of the Achilles tendon and enthesis. Magn Reson Imaging 2009;27(4):557–564. [DOI] [PubMed] [Google Scholar]
- 26.Roberts S, Menage J, Duance V, Wotton S, Ayad S. 1991 Volvo Award in basic sciences. Collagen types around the cells of the intervertebral disc and cartilage end plate: an immunolocalization study. Spine 1991;16(9):1030–1038. [PubMed] [Google Scholar]
- 27.Nissi MJ, Rieppo J, Töyräs J, et al. T(2) relaxation time mapping reveals age- and species-related diversity of collagen network architecture in articular cartilage. Osteoarthritis Cartilage 2006;14(12):1265–1271. [DOI] [PubMed] [Google Scholar]
- 28.Albert HB, Briggs AM, Kent P, Byrhagen A, Hansen C, Kjaergaard K. The prevalence of MRI-defined spinal pathoanatomies and their association with modic changes in individuals seeking care for low back pain. Eur Spine J 2011;20(8):1355–1362. [DOI] [PMC free article] [PubMed] [Google Scholar]
- 29.Chang EY, Bae WC, Statum S, Du J, Chung CB. Effects of repetitive freeze-thawing cycles on T2 and T2 of the Achilles tendon. Eur J Radiol 2014;83(2):349–353. [DOI] [PubMed] [Google Scholar]