
Figure 4:
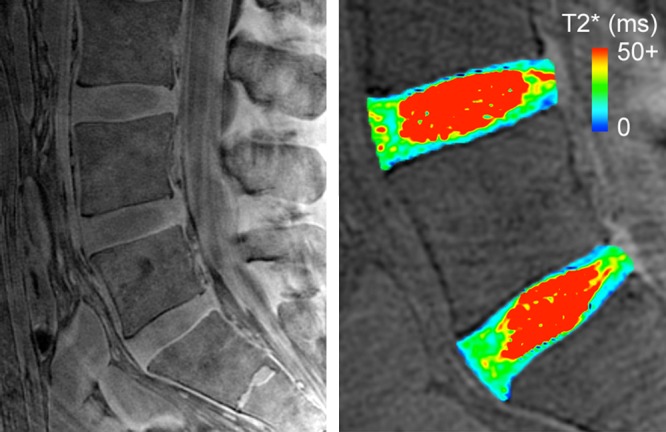
Midsagittal UTE image (left) with echo time of 292 μs from a 37-year-old male donor showed higher end plate signal intensity in lower lumbar region than in middle-to-upper lumbar region. For reference, cartilaginous end plate caudal to L5 disc was approximately 50°, the cartilaginous end plates cranial to L3 disc and caudal to L4 disc were approximately 90°. T2* map (right) of L4 and L5 discs in lower lumbar region showed T2* of 10–40 msec, which appeared to decrease with depth. ms = Milliseconds.