

Abstract
BACKGROUND
Blood alcohol is present in a third of trauma patients and has been associated with organ dysfunction. In both human studies and in animal models, it is clear that alcohol intoxication exerts immunomodulatory effects several hours to days after exposure, when blood alcohol is no longer detectable. The early immunomodulatory effects of alcohol while blood alcohol is still elevated are not well understood.
METHODS
Human volunteers achieved binge alcohol intoxication after high-dose alcohol consumption. Blood was collected for analysis prior to alcohol ingestion, and 20 min, 2 h, and 5 h after alcohol ingestion. Flow cytometry was performed on isolated peripheral blood mononuclear cells, and cytokine generation in whole blood was measured by enzyme-linked immunosorbent assay (ELISA) after 24-h stimulation with lipopolysaccharide (LPS) and phytohemagglutinin-M (PHA) stimulation.
RESULTS
An early pro-inflammatory state was evident at 20 min when blood alcohol levels were ~130 mg/dL, which was characterized by an increase in total circulating leukocytes, monocytes, and natural killer cells. During this time, a transient increase in LPS-induced tumor necrosis factor (TNF)-α levels and enhanced LPS sensitivity occurred. At 2 and 5 h post-alcohol binge, an anti-inflammatory state was shown with reduced numbers of circulating monocytes and natural killer cells, attenuated LPS-induced interleukin (IL)-1β levels, and a trend toward increased interleukin (IL)-10 levels.
CONCLUSIONS
A single episode of binge alcohol intoxication exerted effects on the immune system that caused an early and transient pro-inflammatory state followed by an anti-inflammatory state.
Keywords: ethanol, binge drinking, innate immunity, cytokines, antigen-presenting cells, peripheral blood mononuclear cells
Introduction
Traumatic injury accounted for 30% of all life years lost in the United States and was the leading cause of death in Americans between 1 and 44 years old (CDC, 2014). Acute alcohol exposure was encountered in more than 30% of trauma patients and intoxication carried the highest risk for injury (Afshar et al., 2014; Gmel et al., 2006). In preclinical trauma studies, alcohol-induced vasodilation, diuresis, decreased cardiac output, impaired vasoreactivity, and depressed myocardial contractility negatively impacted resuscitation and worsened outcomes (Molina, Sulzer, & Whitaker, 2013). Alcohol-exposed trauma victims who survived their injuries were at increased risk for nosocomial infection and acute respiratory distress syndrome (Afshar et al., 2014; Gmel et al., 2006). Acute alcohol ingestion also decreased resistance to infection-related complications and increased risk for mortality in humans and animals with sepsis (Pruett et al., 2010; Shih et al., 2003). The risks for systemic inflammatory syndrome and sepsis after alcohol exposure were best described in trauma patients with blood alcohol levels above 100 mg/dL (Griffin, Poe, Cross, Rue, & McGwin, 2009).
Experimental studies have shown acute alcohol exposure resulted in suppressed pro-inflammatory cytokine release in response to an inflammatory challenge, decreased neutrophil recruitment and phagocytic function, and impaired chemotaxis (Molina et al., 2013). Most murine models focused on time points when blood alcohol was no longer present (Fuance, Gregory, & Kovacs, 1997, 1998), but even in murine models examining very early effects on immune response when blood alcohol was still present, markedly suppressed cellular immunity with inhibition of IL-6 and TNF-α production was found (Goral, Choudhry, & Kovacs, 2004; Goral & Kovacs, 2005). Additional murine in vivo and in vitro studies showed alcohol suppressed alveolar macrophage phagocytosis of P. aeruginosa and inhibited splenic and alveolar macrophage pro-inflammatory cytokine release in response to LPS stimulation as soon as 3 h from alcohol exposure, at physiologically relevant blood alcohol levels (Karavitis, Murdoch, Deburghgraeve, Ramirez, & Kovacs, 2012; Karavitis, Murdoch, Gomez, Ramirez, & Kovacs, 2008). Trauma models with full thickness excisional wound injury and episodic alcohol intoxication exhibited delayed wound closure with dysfunction in several components of the innate immune response, including phagocyte recruitment and chemokine/cytokine production in the alcohol-treated mice (Curtis, Hlavin, Brubaker, Kovacs, & Radek, 2014; Fitzgerald et al., 2007). In trauma patients, acute alcohol exposure was associated with altered immune responsiveness at several days after injury (Szabo, Mandrekar, Verma, Isaac, & Catalano, 1994). The immunomodulatory effects of alcohol in humans have been studied many hours to days after alcohol exposure, when blood alcohol is no longer detectable. Elevated blood alcohol is a frequent occurrence in trauma patients, and understanding the acute effects of alcohol on host response to infection and other inflammatory stimuli has clinical relevance to the care of such patients.
The purpose of this study was to elucidate the early immune effects of binge alcohol ingestion on circulating leukocyte composition and function in healthy human subjects. We used flow cytometry and whole blood cytokine assays to define the temporal changes in circulating leukocyte composition and function in 15 young healthy volunteers during the first 5 h after alcohol ingestion.
Methods
Reagents and antibodies
The following antibodies were purchased from BD Pharmingen, unless otherwise noted: BV421-conjugated anti-CD3 (#562426); BV421-conjugated anti-CD4 (BioLegend, #300532); BV421-conjugated anti-CD56 (BD Horizon, #562751); BV421-conjugated anti-CD86 (#562432); BV421-conjugated anti-HLA-DR (BD Horizon, #562804); BV421-conjugated IgG1, κ Isotype Control (BioLegend, #400158); BV421-conjugated IgG2a, κ Isotype Control (BD Horizon, #562439); BV421-conjugated IgG2b, κ Isotype Control (BioLegend, #400342); FITC-conjugated anti-CD4 (#555346); FITC-conjugated anti-CD14 (#555397); FITC-conjugated anti-CD15 (#562370); FITC-conjugated anti-CD19 (#555412); FITC-conjugated anti-CD25 (#555431); FITC-conjugated anti-CD69 (#555530); FITC-conjugated IgG1, κ Isotype Control (#555748); FITC-conjugated IgG2a, κ Isotype Control (#555573); PE-conjugated anti-CD8 (#555367); PE-conjugated anti-CD11b (BioLegend, #301406); PE-conjugated anti-Cd11c (#555392); PE-conjugated IgG1, κ Isotype Control (#555749); APC-conjugated anti-CD3 (#555335); APC-conjugated anti-CD11a (R&D Systems, #FAB3595A); APC-conjugated anti-HLA-DR (#559866); APC-conjugated IgG1, κ Isotype Control (#555751); and APC-conjugated IgG2a, κ Isotype Control (BioLegend, #400220).
Alcohol dosing protocol
The Institutional Review Board of the University of Maryland, Baltimore approved this study. We recruited 15 healthy human volunteers without a history of an alcohol-use disorder (Hasin, Fenton, Beseler, Park, & Wall, 2012), identified by the Short Michigan Alcohol Survey Tool and the 2010 National Health Survey alcohol questionnaire. All subjects had normal liver function as determined by hepatic function panel laboratory testing, and abstained from alcohol ingestion, smoking, and caffeine for 72 h prior to study enrollment. Alcohol abstinence was confirmed by the urinary biomarkers ethyl glucuronide and ethyl sulfate (Høiseth et al., 2008).
Following screening and enrollment, subjects consumed 100 proof ethanol (50% alcohol by volume) mixed with chilled sugar-free flavored seltzer water in a 1:4 ratio (1 part alcohol spirits to 4 parts seltzer water) over 20 min. The alcohol dose was calculated based on actual body weight and sex (0.89 g/kg body weight for men and 0.81 g/kg for women) to reach a target breath alcohol content (BrAC) > 0.1%. After a 20-min absorption period, BrAC level was measured using a BACTrack® S80 Select Breathalyzer (KHN Solutions LLC, San Francisco, CA; sensor accuracy ± 0.005% blood alcohol content [BAC] at 0.050% BAC) and was repeated every 30 min. BAC was measured in heparinized blood prior to alcohol ingestion to confirm an undetectable level. For correlation with BrAC measurements, BAC was also measured at the following times after BrAC level 0.1% was achieved: 20 min, 2 h, and 5 h. When BrAC decreased to ≤ 0.03% and no significant adverse effects were noted, subjects were discharged from the General Clinical Research Center at the University of Maryland.
Peripheral blood mononuclear cell preparation
Blood was collected for peripheral blood mononuclear cell (PBMC) isolation prior to alcohol ingestion and at 20 min, 2 h, and 5 h after BrAC 0.1% was achieved. Whole blood was collected in sodium heparin tubes and transported to the lab for PBMC isolation. PMBCs were isolated from whole blood within 3 h of collection by density gradient centrifugation with Lymphocyte Separation Medium (Corning, #25-072-CV, density = 1.077–1.080 g/mL), according to the manufacturer’s protocol. Cell counts and viability were determined with trypan blue (Corning, #25-900-CI) and manual counting, and PBMCs were cryopreserved in RPMI-1640 Medium (Corning, #15-040-CV) containing 20% heat-inactivated human AB serum and 10% dimethylsulfoxide (American Bioanalytical, #AB00435). Cells were frozen at approximately 2.0 × 10⁶ per vial with an automated step-down freezer (Gordinier Electronics) and stored in the vapor phase of liquid nitrogen at −140 °C for flow cytometric analysis, usually the following day.
On the day of analysis, PBMCs were thawed and suspended in RPMI-1640 Medium with 20% fetal bovine serum. To block non-specific antibody binding to Fc receptors, the cells were incubated in blocking buffer phosphate-buffered-saline (PBS) 1X with 5% heat-inactivated human AB serum for 15 min on ice prior to staining with labeled antibodies. Cell counts and viability were again determined with trypan blue, and cells were then stained with antibodies in the dark at 4 °C for 30 min at 1.0 to 2.0 × 10⁵ cells per tube. The cells were subsequently washed with Flow Wash Buffer (PBS with 1% fetal bovine serum) and resuspended in 1% paraformaldehyde for flow cytometry analysis.
Flow cytometry analysis
Sample acquisition was performed using an iCyt Eclipse Flow Cytometer (Sony Biotechnology, Inc.) with a minimum of 2.0 × 10⁴ cells acquired per sample tube. The data were analyzed using iCyt EC800 software, version 1.3.5.
Stimulus treatment of whole blood samples and cytokine measurements
Aliquots of 0.5 mL of blood diluted with 1:1 RPMI-1640 medium were incubated in 24-well plates (Becton Dickinson, Sunnyvale, CA) with phytohemagglutinin-M (PHA) (GIBCO/Invitrogen, Paisley, UK), at final concentrations of 0.3%, 1%, and 3% (v/v), LPS (Sigma-Aldrich Chemie, Steinheim, Germany) at final concentrations of 1, 10, and 100 ng/mL, or no exogenous stimulus. After incubation for 24 h at 37 °C in 5% CO2, plasma supernatants were collected following centrifugation at 6000 rpm for 3 min and stored at −80 °C for cytokine assays. The alcohol levels in the cultures were measured at the beginning and end of the 24-h incubation, and the half-life of alcohol in vitro was approximately 24 h.
The cytokines were measured by sandwich ELISA using paired antibodies and recombinant standards from R&D Systems (Minneapolis, MN), according to manufacturer’s specifications. A standard curve was generated and sample cytokine concentrations calculated using a computer program (SoftPro; Molecular Dynamics). The minimal detection levels for TNF-α, interferon (IFN)-γ, and interleukin (IL)-17 were 15.6 pg/mL. The minimal detection level for interleukin (IL)-1β was 3.9 pg/mL, interleukin (IL)-1RA was 39 pg/mL, and interleukin (IL)-10 was 7.8 pg/mL. Levels below the lower detection limit were assigned a value of 0 for statistical analysis.
Sensitivity to LPS and PHA was evaluated at each time point by comparing the cytokine response induced by the lowest LPS or PHA concentration to the maximal cytokine response at the same time point.
Statistical Analysis
Results between treatment groups were compared by the repeated-measures analysis of variance or paired samples t test with correction for multiple comparisons. Analysis was performed using SAS Version 9.1.3 (SAS Institute, Cary, NC). We set p ≤ 0.05 for statistical significance in ANOVA analysis and p ≤ 0.017 ([1−alpha* = (1−alpha)k], k = 3 and 1−alpha* = 0.95, so alpha = 0.016952) in paired t test with multiple comparisons.
Results
The median age of the cohort was 27.0 (interquartile range [IQR] 25–30) years; 53% were female. All subjects met the 2004 National Institute on Alcohol Abuse and Alcoholism definition for binge pattern of drinking (Table 1). The mean dose of alcohol consumed was 62.0 (IQR 56.7–80.9) grams and was 0.89 g/kg in males and 0.81 g/kg in females. The median peak BAC after alcohol ingestion was 129.0 (IQR 119–149) mg/dL, and the median level at 5 h post-alcohol ingestion decreased to 57 (IQR 24–68) mg/dL. Peak blood alcohol levels were reached between 20 min and 2 h in all subjects. Strong correlation was found between BrAC and BAC measurements (Pearson’s r correlation coefficient 0.80, p value < 0.05). The average rate of alcohol clearance based on BrAC measurements was 17.8 mg/dL/h (Fig. 1).
Table 1.
Subject Characteristics
| Subject | Age | Sex | Ethanol Dose (grams) | Body Mass Index | 20 min BAC (mg/dL) | 2 Hour BAC (mg/dL) | 5 Hour BAC (mg/dL) | Peak BAC (mg/dL) |
|---|---|---|---|---|---|---|---|---|
| 1 | 31 | M | 73.69 | 28.85 | 116 | 129 | 73 | 129 |
| 2 | 30 | M | 79.83 | 30.11 | 169 | 129 | 66 | 129 |
| 3 | 29 | M | 69.60 | 23.87 | 120 | 113 | 46 | 120 |
| 4 | 28 | F | 61.24 | 25.44 | 99 | 112 | 69 | 112 |
| 5 | 24 | F | 59.62 | 28.46 | 114 | 133 | 77 | 133 |
| 6 | 23 | M | 88.47 | 28.86 | 182 | 113 | 57 | 182 |
| 7 | 34 | F | 62.05 | 32.55 | 126 | 129 | 68 | 129 |
| 8 | 26 | F | 80.92 | 33.53 | 111 | 119 | 62 | 119 |
| 9 | 25 | F | 44.87 | 22.79 | 162 | 89 | 12 | 162 |
| 10 | 28 | F | 52.97 | 23.68 | 124 | 99 | 11 | 124 |
| 11 | 22 | M | 87.58 | 33.73 | 155 | 146 | 60 | 155 |
| 12 | 27 | F | 59.86 | 27.75 | 118 | 94 | 24 | 118 |
| 13 | 27 | M | 86.95 | 25.72 | 101 | 109 | 56 | 109 |
| 14 | 33 | M | 56.07 | 20.52 | 149 | 81 | 10 | 149 |
| 15 | 25 | F | 56.70 | 23.15 | 120 | 96 | 28 | 120 |
|
| ||||||||
| SUMMARY | 27.5 ± 3.5 | Female 8 (53) |
68.0 ± 14.0 | 27.3 ± 4.1 | 131.0 ± 25.7 | 112.7 ± 18.4 | 47.9 ± 24.2 | 132.7 ± 20.5 |
Continuous variables presented as means ± standard deviation. Categorical variables presented as frequency with percentage.
Figure 1. Mean BrAC Levels Over Six Hours.

Breathalyzer levels from pre-alcohol to six hours post-alcohol ingestion with 20 minute post-alcohol peak and subsequent 30 minute recordings until discharge from General Clinical Research Center when BrAC reached ≤0.03%. Average clearance of 17.8mg/dL/hr.
In vivo alcohol ingestion modulates monocyte cell populations as soon as 20 minutes post-binge
Total leukocyte count from complete blood count measurements in the University of Maryland Medical Center clinical laboratory showed a significant increase at 20 min post-alcohol ingestion (7.2 ± 2.4 vs. 6.1 ± 2.1 × 10³/mm3, p < 0.001), but subsequently decreased to pre-alcohol baseline at 5 h (5.9 ± 1.8 × 10³/mm3 vs. 6.1 ± 2.1, p = 0.29). The total recoverable PBMCs rose significantly at 20 min post-alcohol ingestion (4.0 ± 1.6 vs. 3.3 ± 1.6 × 10³/mm3, p = 0.01), and subsequently decreased to pre-alcohol baseline at 5 h (3.4 ± 1.9 vs. 3.3 ± 1.6 × 10³/mm3, p < 0.001).
There were several notable changes in the distribution of subpopulations of PBMCs as identified with cell surface marker expression via flow cytometry. T cells, as identified in the PBMC population with CD3 surface staining, exhibited a significant percentage decrease 20 min post-alcohol ingestion and returned to baseline at 2 h post-alcohol ingestion (Table 2). No difference in B cell percentage, identified in PBMCs with CD19 surface marker profile, was shown at any of the post-alcohol ingestion time points. The percent of natural killer cells (NK) identified in the PBMCs by CD56 surface expression increased at 20 min post-alcohol ingestion but decreased below baseline at 5 h post-alcohol ingestion (Table 2).
Table 2.
Percent Gated in Pre-Alcohol Baseline versus Post-Alcohol Time Points
| Marker (Percent Gated) | Pre-Alcohol (Mean±SD) | 20 minutes Post-Alcohol (Mean±SD) | p value | 2 hours Post-Alcohol (Mean±SD) | p value | 5 hours Post-Alcohol (Mean±SD) | p value |
|---|---|---|---|---|---|---|---|
| PBMC Live Gate | |||||||
| CD3 | 52.3±10.2 | 46.0±10.3 | <0.001 | 51.3±11.5 | NS | 49.6±11.0 | NS |
| CD19 | 8.7±3.9 | 8.6±3.5 | NS | 9.9±3.5 | NS | 10.0±4.5 | NS |
| CD56 | 19.9±5.2 | 23.3±5.8 | 0.012 | 19.9±4.6 | NS | 16.9±5.1 | 0.009 |
| CD14 | 10.3±3.1 | 11.0±3.2 | NS | 7.2±3.1 | <0.001 | 9.8±3.3 | NS |
| CD11c | 17.7±3.8 | 20.4±4.5 | 0.003 | 15.0±3.1 | 0.004 | 16.0±3.8 | 0.013 |
|
| |||||||
| Monocyte Gate, Based on Forward Scatter and Side Scatter | |||||||
| HLA DR | 81.5±7.1 | 82.3±6.2 | NS | 79.5±5.6 | NS | 77.1±7.8 | 0.010 |
| CD14+ / CD11c+ | 84.1±6.4 | 83.8±5.2 | NS | 78.2±7.7 | 0.015 | 83.8±5.1 | NS |
| CD14− / CD11c+ | 8.6±3.2 | 9.0±3.3 | NS | 12.3±3.9 | 0.006 | 8.1±3.3 | NS |
|
| |||||||
| CD14/CD11c Gate Within Monocyte Gate | |||||||
| CD14+ / CD11c+/ HLA DR+ | 86.8±7.2 | 87.7±6.3 | NS | 88.6±6.0 | NS | 82.4±10.0 | 0.003 |
| CD14− / CD11c+/ HLA DR+ | 64.6±13.8 | 68.7±10.8 | 0.017 | 58.1±13.3 | 0.014 | 62.3±11.2 | NS |
T cells as identified by CD3 surface staining in the peripheral blood mononuclear cell (PBMC) live gate significantly decreased at 20 minutes with a return to pre-alcohol levels at 2 hours post-alcohol ingestion. The portion of PBMCs comprising CD14+ monocytes exhibited a 31.3% drop from pre-alcohol levels at 2 hours post-alcohol ingestion but returned to pre-alcohol levels at 5 hours. Natural killer cells identified by CD56 expression in PBMCs increased at 20 minutes post-alcohol ingestion and then decreased below pre-alcohol levels at 5 hours post-alcohol ingestion. The percent of monocytes with surface marker profile CD14−/CD11c+ cells increased at 2 hours post-alcohol ingestion. However, the percent of CD14−CD11c+ cells that were HLA-DR+ decreased compared to baseline. Comparisons were made by paired t test with significance level for multiple comparisons at p = 0.017. NS = not significant.
The portion of PBMCs comprised of monocytes, identified with CD14+ cell-surface staining, exhibited a 31.3% drop (p < 0.001) from baseline at 2 h post-alcohol ingestion, but recovered to baseline at 5 h (p = 0.40) (Fig. 2A). A representative dot plot shown in Fig. 3 demonstrates a decrease in percent of cells with CD14+ expression at 2 h post-alcohol ingestion in both PBMC and monocyte populations. Monocytes with possible dendritic cell differentiation were characterized by CD11c+ cell-surface staining. The percent of cells with CD11c+ expression within the PBMC population increased at 20 min post-alcohol ingestion and then decreased below baseline at 2 h and 5 h post-alcohol ingestion (Table 2).
Figure 2. Change in Monocyte Characteristics Over Time.
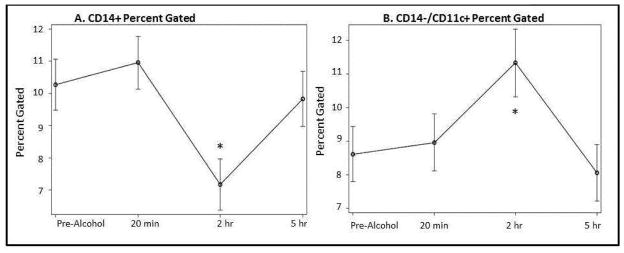
A) The portion of PBMCs comprised of CD14+ monocytes exhibited a 31.3% drop from pre-alcohol levels at 2 hours post-alcohol intoxication (7.2% at 2 hours vs. 10.3% pre-alcohol, p<0.001*). B) The percent of PBMCs with surface marker profile CD14−/CD11c+, characteristic of monocytes differentiated into dendritic cells, increased 43.2% at 2 hours post-alcohol (11.3% vs. 8.6% pre-alcohol, p=0.006*) and returned to pre-alcohol levels at 5 hours (p=0.43).
Figure 3. Representative Dot Plots Across Time.

Representative dot plot from a single subjet. CD14 and CD11c expression are shown in A) PBMC population gated cells and in B) monocyte population gated cells. Both groups demonstrate a decrease in CD14 expression at 2 hours post-alcohol ingestion.
Myeloid dendritic cells (DC) represent a terminally differentiated state of monocytes and are one of the most potent antigen-presenting cell types. To further characterize monocytes with possible dendritic cell differentiation from undifferentiated monocytes, we performed more specific cell-surface staining with the combination of CD14 and CD11c. When monocytes differentiate into immature DCs, they lose CD14 expression (Masten et al., 2006). The percent of monocytes with possible dendritic cell differentiation, identified in the monocyte gate with cell-surface marker profile CD14−/CD11c+, increased 43.2% at 2 h (p = 0.006) post-alcohol ingestion and returned to baseline at 5 h (Fig. 2B). Human leukocyte antigen-D related (HLA-DR) was evaluated in the CD14/CD11c gate within the monocyte gate to further examine a surface marker profile characteristic of myeloid dendritic cells but not plasmacytoid dendritic cells (Masten et al., 2006). At 2 h, the percent of CD14−/CD11c+ cells that were HLA-DR+ decreased from 64.6% to 58.1% compared to baseline (p = 0.014) (Table 2).
In vivo alcohol ingestion modified cytokine responsiveness to ex vivo stimulation with LPS
In pre-alcohol blood samples, addition of LPS at final concentrations of 1 to 100 ng/mL stimulated expression of TNF-α, IL-1β, IL-1RA, and IL-10 (Table 3). The changes in levels for the pro-inflammatory cytokines TNF-α and IL-1β are shown in Fig. 4A and 4B, respectively. No significant change over time occurred in levels for TNF-α, but IL-1β levels decreased below baseline at 2 and 5 h post-alcohol ingestion. The changes in levels for the anti-inflammatory cytokines IL-1RA and IL-10 are shown in Fig. 4C and 4D. In blood collected 20 min post-alcohol ingestion, maximal LPS-induced IL-1RA levels increased by 64.7% (p < 0.001) compared to baseline blood samples, and returned to baseline at 2 h post-alcohol. The increase in IL-1RA only occurred at the highest LPS concentration (100 ng/mL). No significant changes occurred in levels of IL-10 at 20 min. IL-10 levels increased at 5 h post-alcohol ingestion, although the change was not significant when compared to baseline.
Table 3.
Pre-Alcohol Baseline Cytokine Levels (106 pg/mL)
| Cytokine (pg/mL) | Plasma (Mean±SD) | 1 ng/mL LPS (Mean±SD) | 10 ng/mL LPS (Mean±SD) | 100 ng/mL LPS (Mean±SD) | p value |
|---|---|---|---|---|---|
| TNF-α | 20.9±28.2 | 864.5±1,142.0 | 1,955.0±2,063.2 | 2,682.8±2,223.3 | 0.045 |
| IL-1β | 2.2±4.5 | 3,219.3±4,634.7 | 6,878.0±6,919.8 | 9,478.9±9,519.7 | NS |
| IL-1RA | 0 | 7,435.6±5,197.3 | 9,808.7±6,354.9 | 10,865.0±7223.0 | NS |
| IL-10 | 17.1±22.0 | 156.3±92.0 | 379.4±206.6 | 533.6±282.9 | <0.001 |
|
| |||||
| 0.3% v/v PHA (Mean±SD) | 1% v/v PHA (Mean±SD) | 3% v/v PHA (Mean±SD) | |||
|
| |||||
| IL-17 | 1.7±4.1 | 8.5±19.1 | 117.6±121.0 | 349.3±167.9 | <0.001 |
| IFN-γ | 4.6±11.0 | 16.5±18.8 | 418.2±451.3 | 1,133.7±528.0 | <0.001 |
Cytokine levels from plasma and three concentrations of LPS or PHA. Cytokines levels increased significantly for IL-10, IL-17, and IFN-γ with increasing concentrations of LPS or PHA. Other cytokines showed a trend for increasing levels with increasing concentration of stimulant. One-Way ANOVA test for stimulated samples only (excluding plasma). NS = not significant.
Figure 4. Cytokine Levels After LPS Stimulation (100 ng/mL).

A and B) LPS stimulated pro-inflammaotry (TNF-α and IL-1β) cytokine expression changed over time from pre-alcohol up to 5 hours post-alcohol intoxication. More notably, IL-1β was signficantly decreased by 2 hours (p<0.001*) and 5 hours (p=0.007*) when compared to pre-alcohol levels. C and D) LPS stimulated anti-inflammaotry (IL-10 and IL-1RA) cytokine levels changed over time from pre-alcohol up to 5 hours post-alcohol ingestion. More notably, IL-1RA increased signficiantly by 20 minutes when compared to pre-alcohol levels (p<0.001*) but returned to baseline by 5 hours and IL-10 was overall increased expression by 5 hours. Stimulation of samples occurred at LPS concentration of 100 ng/mL. The stated p-value across time for each cytokine was produced by repeated measures ANOVA.
To determine whether alcohol ingestion altered leukocyte sensitivity to LPS, the level of TNF-α stimulated by 1 ng/mL LPS was expressed as a percent of maximal TNF-α level at each time point. Based on this assay, LPS sensitivity increased 20 min post-alcohol ingestion and subsequently returned to baseline levels of LPS sensitivity. The level of TNF-α released with 1 ng/mL LPS was 38.1% of maximal TNF-α levels 20 min post-alcohol ingestion versus 28.2% in baseline samples (p = 0.008) (Table 4). IL-1β levels paralleled TNF-α levels in the LPS sensitivity assays, but did not reach significance.
Table 4.
Percent of Maximal Response from Lowest Concentration of LPS (1 ng/mL) and PHA (0.3%) Stimulation
| Cytokine | Pre-Alcohol (Mean±SD) | 20 minutes Post-Alcohol (Mean±SD) | p value | 2 hours Post-Alcohol (Mean±SD) | p value | 5 hours Post-Alcohol (Mean±SD) | p value |
|---|---|---|---|---|---|---|---|
| TNF-α | 28.2±10.9 | 38.1±15.0 | 0.008* | 30.8±11.1 | NS | 40.0±25.4 | NS |
| IL-1β | 27.2±10.7 | 33.5±14.4 | NS | 22.4±10.5 | NS | 30.5±15.7 | NS |
| IL-1RA | 66.7±16.2 | 71.0±11.0 | NS | 64.4±19.0 | NS | 53.5±19.0 | 0.003 |
| IL-10 | 32.7±15.6 | 28.7±10.3 | NS | 24.3±11.4 | NS | 39.3±26.8 | NS |
| IL-17 | 2.2±5.1 | 2.9±4.1 | NS | 2.5±4.6 | NS | 1.0±1.6 | NS |
| IFN-γ | 1.6±2.0 | 1.4±1.5 | NS | 1.7±1.4 | NS | 1.6±1.9 | NS |
To determine whether alcohol ingestion altered leukocyte sensitivity to LPS, the level of cytokines stimulated by 1 ng/mL LPS was expressed as a percent of maximal cytokine level at each time point. LPS sensitivity was increased for TNF-α at 20 minutes before returning to baseline levels of LPS sensitivity at 2 hours and no significant difference at 5 hours. IL-1β showed similar results but did not reach statistical significance. T cell sensitivity as reflected by the ration of IFN-γ and IL-17 induced by 0.3% PHA to maximal levels did not change post-alcohol ingestion. Comparisons were made by paired t test with significance level for multiple comparisons at p = 0.017. NS = not significant.
Unlike LPS-induced cytokine levels, neither PHA-stimulated IFN-γ nor IL-17 levels changed significantly post-alcohol ingestion except for increased IFN-γ levels at 20 min post-alcohol ingestion, which returned to baseline at 5 h (Supplement 1S). T cell sensitivity to PHA activation, as reflected by the ratio of IFN-γ and IL-17 induced by 0.3% PHA to maximal levels, did not change post-alcohol ingestion (Table 4).
Discussion
Our study cohort was representative of the age group and drinking behavior of the population at risk for alcohol intoxication and associated trauma (Gmel et al., 2006). The time intervals studied at 20 min, 2 h, and 5 h post-alcohol ingestion were selected to model trauma victims presenting to the trauma center with positive blood alcohol levels (Afshar et al., 2014). The immunologic effects of binge alcohol intoxication in healthy volunteers with a history of low to moderate alcohol ingestion were assessed with analysis of the composition of PBMCs and cytokine levels in whole blood assay. LPS-induced cytokine levels in whole blood were previously shown to parallel cytokine levels in isolated PBMCs, including studies of alcohol ingestion (De Groote et al., 1992).
A single episode of binge alcohol intoxication with mean peak blood alcohol levels above 130 mg/dL elicited a biphasic immunologic response. An early pro-inflammatory state, evident 20 min post-alcohol ingestion, was characterized by increased total circulating leukocytes, monocytes, and NK cells, increased capacity for LPS-induced TNF-α levels, and enhanced LPS sensitivity. The increase in TNF-α levels observed in the 20-min post-alcohol samples may reflect a change in either the numbers or the function of cytokine producing cells. Our flow analysis of the 20-min post-alcohol samples demonstrated an increase in circulating monocytes, the predominant source of LPS-inducible TNF-α in blood (Takeuchi & Akira, 2007). We also found an increase in LPS sensitivity in these samples, suggestive of contributions from both increased monocyte numbers and cellular responsiveness to LPS. TNF-α production stimulated by the lowest LPS concentration (1 ng/mL) almost doubled in 20-min post-alcohol samples. The increase in TNF-α production occurred despite the presence of alcohol in culture medium at concentrations previously shown to directly inhibit TNF-α levels in vitro (Szabo, Mandrekar, Girouard, & Catalano, 1996).
The rapid increase in circulating leukocytes at 20 min post-alcohol ingestion was most likely the result of de-margination. Acute alcohol ingestion can rapidly activate the hypothalamic-pituitary-adrenal axis and lead to increased endogenous corticosteroid, an inducer of leukocyte de-margination (Hong et al., 2005). In rats, elevations in plasma corticosterone levels were detected within minutes of acute alcohol ingestion and returned to baseline within an hour (László et al., 2001), a time course that is consistent with the changes in leukocyte numbers observed in our subjects. Acute alcohol ingestion in humans was also shown to rapidly increase circulating levels of catecholamines (Ireland, Vandongen, Davidson, Beilin, & Rouse, 1984), another stimulus for leukocyte de-margination (Benschop, Rodriguez-Feuerhahn, & Schedlowski, 1996). Furthermore, the route of alcohol administration may affect circulating glucocorticoid levels. Oral ingestion may induce a greater stress response than intravenous or intraperitoneal administration. However, generation of IL-1RA, an inhibitor of IL-1β response (Ohlsson, Björk, Bergenfeldt, Hageman, & Thompson, 1990), also increased at 20 min post-alcohol ingestion. While our results showed profound acute effects of binge alcohol intoxication, the overall impact on the in vivo inflammatory state cannot be definitively determined from these data.
At 2 and 5 h post-alcohol ingestion, when BAC decreased by 40 to 70% from peak levels, subjects exhibited an anti-inflammatory state characterized by a reduction in percent gated of circulating monocytes and NK cells, reduced LPS-induced IL-1β levels, and a trend toward increased levels of the anti-inflammatory cytokine IL-10. Szabo and colleagues similarly found that IL-8 levels in the LPS-stimulated whole blood assay was reduced 4 h after but not 16 h after alcohol intoxication (Szabo, Chavan, Mandrekar, & Catalano, 1999). The same group also found IL-10 levels to be elevated 18 h after alcohol intoxication (Szabo, Mandrekar, Dolganuic, Catalano, & Kodys, 2001).
We found an increased percentage of cells within the monocyte gate expressing the cell-surface markers CD14−/CD11c+ at 2 h post-alcohol ingestion. However, the increase was largely attributable to HLA-DR− cells. The change in pattern of expression may represent a transition of monocytes to immature dendritic cells, given that CD14+ expression decreased in a corresponding manner. The HLA-DR− cells are likely to be plasmacytoid dendritic cells, which have much lower capacity for antigen presentation than conventional dendritic cells and an increased capacity for secreting IFN-α (Masten et al., 2006). We did not analyze antigen-presenting function of circulating dendritic cells in this study, but a previous study by Mandrekar and colleagues demonstrated that experimental alcohol intoxication using a protocol similar to ours resulted in impaired dendritic cell antigen-presenting activity (Mandrekar, Catalano, Doganiuc, Kodys, & Szabo, 2004). Blood was collected 24 h after alcohol ingestion, and dendritic cells were generated from PBMCs in a 7-day culture with granulocyte macrophage colony-stimulating factor and interluekin-4. The suppressive effect of alcohol ingestion on the phenotype of cells after 1 week in culture suggested alcohol ingestion may change the composition of circulating monocytic cell precursors. These authors also showed the addition of alcohol to the dendritic cell culture medium suppressed antigen-presenting activity, indicating additional direct effects of alcohol on dendritic cell function. Collectively, these data suggested transient immune suppression may occur at 2 h post-alcohol ingestion. The contribution of catecholamines and glucocorticoids to the observed post-alcohol ingestion changes in leukocyte numbers was not assessed in the current study, but the known immune suppressive effects of these agents (Li et al., 2005) could have contributed to the anti-inflammatory effects observed at 2 and 5 h post-alcohol ingestion.
In contrast to the effects of alcohol ingestion on the innate immune system, we failed to detect either a change in PHA responsiveness within the T cell population or significant changes in IFN-γ or IL-17 levels. We did find a significant drop in CD3 expression at 20 min post-alcohol ingestion with flow cytometry, but we did not perform an extensive analysis of T cell subsets or lymphokine expression to exclude narrower effects of alcohol ingestion on T lymphocyte composition or function. A transient rise in IFN-γ levels in human blood after alcohol exposure and ex vivo LPS challenge after 4 h was previously described (Szabo, 1998), and changes in T cell responsiveness and cytokine generation were shown 18–24 h post-alcohol ingestion. These effects may have differed in our laboratory because we stimulated cells with PHA, or because the whole blood assays had indirect effects on cytokine production. Our study suggested that, at most, modest effects on adaptive immunity occurred within 5 h of alcohol intoxication.
Conclusion
A single episode of binge alcohol intoxication exerted effects on the immune system that caused an early and transient pro-inflammatory state followed by an anti-inflammatory response. The clinical impacts of these changes are not yet known but occurred during the post-alcohol ingestion time frame when trauma victims are exposed to endogenous activators of inflammation and microbial pathogens.
Table S.1. Pre-Alcohol Baseline Cytokine Level Versus Maximal Cytokine Level at Each Time Point after LPS stimulation (106 pg/mL)
Supplementary Material
HIGHLIGHTS.
A single episode of binge alcohol elicits a biphasic immunologic response.
An early pro-inflammatory state was evident 20 minutes post-alcohol ingestion.
At two and five hours post-alcohol, subjects exhibited an anti-inflammatory state.
Circulating monocytes and LPS-induced cytokines are affected most after binge.
Acknowledgments
The University of Maryland Clinical Translational Science Institute and the University of Maryland General Clinical Research Center supported this work. Support was also provided by the National Institute on Alcohol Abuse and Alcoholism (NIAAA) of the National Institute of Health (NIH) under award number F32AA022553 (MA).
Footnotes
Publisher's Disclaimer: This is a PDF file of an unedited manuscript that has been accepted for publication. As a service to our customers we are providing this early version of the manuscript. The manuscript will undergo copyediting, typesetting, and review of the resulting proof before it is published in its final citable form. Please note that during the production process errors may be discovered which could affect the content, and all legal disclaimers that apply to the journal pertain.
Contributor Information
Majid Afshar, Email: Majid.afshar@luhs.org.
Stephanie Richards, Email: Stephanie.richards@som.umaryland.edu.
Dean Mann, Email: dmann001@umaryland.edu.
Alan Cross, Email: across@medicine.umaryland.edu.
Gordon B. Smith, Email: gssmith@som.umaryland.edu.
Giora Netzer, Email: gnetzer@medicine.umaryland.edu.
Elizabeth Kovacs, Email: ekovacs@luc.edu.
Jeffrey Hasday, Email: jhasday@umaryland.edu.
References
- Afshar M, Smith GS, Terrin ML, Barrett M, Lissauer ME, Mansoor S, et al. Blood alcohol content, injury severity, and adult respiratory distress syndrome. The Journal of Trauma and Acute Care Surgery. 2014;76:1447–1455. doi: 10.1097/TA.0000000000000238. [DOI] [PMC free article] [PubMed] [Google Scholar]
- Benschop RJ, Rodriguez-Feuerhahn M, Schedlowski M. Catecholamine-induced leukocytosis: early observations, current research, and future directions. Brain, Behavior, and Immunity. 1996;10:77–91. doi: 10.1006/brbi.1996.0009. [DOI] [PubMed] [Google Scholar]
- Centers for Disease Control and Prevention, National Center for Injury Prevention and Control. Web-based Injury Statistics Query and Reporting System (WISQARS) Retrieved May 17, 2014, from http://www.cdc.gov/injury/WISQARS.
- Curtis BJ, Hlavin S, Brubaker AL, Kovacs EJ, Radek KA. Episodic binge ethanol exposure impairs murine macrophage infiltration and delays wound closure by promoting defects in early innate immune responses. Alcoholism: Clinical and Experimental Research. 2014;38:1347–1355. doi: 10.1111/acer.12369. [DOI] [PMC free article] [PubMed] [Google Scholar]
- De Groote D, Zangerle PF, Gevaert Y, Fassotte MF, Beguin Y, Noizat-Pirenne F, et al. Direct stimulation of cytokines (IL-1 beta, TNF-alpha, IL-6, IL-2, IFN-gamma and GM-CSF) in whole blood. Comparison with isolated PBMC stimulation. Cytokine. 1992;4:239–248. doi: 10.1016/1043-4666(92)90062-v. [DOI] [PubMed] [Google Scholar]
- Fitzgerald DJ, Radek KA, Chaar M, Faunce DE, DiPietro LA, Kovacs EJ. Effects of acute ethanol exposure on the early inflammatory response after excisional injury. Alcoholism: Clinical and Experimental Research. 2007;31:317–323. doi: 10.1111/j.1530-0277.2006.00307.x. [DOI] [PubMed] [Google Scholar]
- Fuance DE, Gregory MS, Kovacs EJ. Effects of acute ethanol exposure on cellular immune responses in a murine model of thermal injury. Journal of Leukocyte Biology. 1997;62:733–740. doi: 10.1002/jlb.62.6.733. [DOI] [PubMed] [Google Scholar]
- Fuance DE, Gregory MS, Kovacs EJ. Acute ethanol exposure prior to thermal injury results in decreased T-cell responses mediated in part by increased production of IL-6. Shock. 1998;10:135–140. doi: 10.1097/00024382-199808000-00009. [DOI] [PubMed] [Google Scholar]
- Gmel G, Bissery A, Gammeter R, Givel JC, Calmes JM, Yersin B, et al. Alcohol-attributable injuries in admissions to a swiss emergency room - an analysis of the link between volume of drinking, drinking patterns, and preattendance drinking. Alcoholism: Clinical and Experimental Research. 2006;30:501–509. doi: 10.1111/j.1530-0277.2006.00054.x. [DOI] [PubMed] [Google Scholar]
- Goral J, Choudhry MA, Kovacs EJ. Acute ethanol exposure inhibits macrophage IL-6 production: role of p38 and ERK1/2 MAPK. Journal of Leukocyte Biology. 2004;75:553–559. doi: 10.1189/jlb.0703350. [DOI] [PubMed] [Google Scholar]
- Goral J, Kovacs EJ. In vivo ethanol exposure down-regulates TLR2-, TLR4-, and TLR9-mediated macrophage inflammatory response by limiting p38 and ERK1/2 activation. Journal of Immunology. 2005;174:456–463. doi: 10.4049/jimmunol.174.1.456. [DOI] [PubMed] [Google Scholar]
- Griffin R, Poe AM, Cross JM, Rue LW, 3rd, McGwin G., Jr The association between blood alcohol level and infectious complications among burn patients. Journal of Burn Care & Research. 2009;30:395–399. doi: 10.1097/BCR.0b013e3181a28966. [DOI] [PubMed] [Google Scholar]
- Hasin DS, Fenton MC, Beseler C, Park JY, Wall MM. Analyses related to the development of DSM-5 criteria for substance use related disorders: 2. Proposed DSM-5 criteria for alcohol, cannabis, cocaine and heroin disorders in 663 substance abuse patients. Drug and Alcohol Dependence. 2012;122:28–37. doi: 10.1016/j.drugalcdep.2011.09.005. [DOI] [PMC free article] [PubMed] [Google Scholar]
- Høiseth G, Bernard JP, Stephanson N, Normann PT, Christophersen AS, Mørland J, et al. Comparison between the urinary alcohol markers EtG, EtS, and GTOL/5-HIAA in a controlled drinking experiment. Alcohol and Alcoholism. 2008;43:187–191. doi: 10.1093/alcalc/agm175. [DOI] [PubMed] [Google Scholar]
- Hong S, Johnson TA, Farag NH, Guy HJ, Matthews SC, Ziegler MG, et al. Attenuation of T-lymphocyte demargination and adhesion molecule expression in response to moderate exercise in physically fit individuals. Journal of Applied Physiology. 2005;98:1057–1063. doi: 10.1152/japplphysiol.00233.2004. [DOI] [PubMed] [Google Scholar]
- Ireland MA, Vandongen R, Davidson L, Beilin LJ, Rouse IL. Acute effects of moderate alcohol consumption on blood pressure and plasma catecholamines. Clinical Science. 1984;66:643–648. doi: 10.1042/cs0660643. [DOI] [PubMed] [Google Scholar]
- Karavitis J, Murdoch EL, Deburghgraeve C, Ramirez L, Kovacs EJ. Ethanol suppresses phagosomal adhesion mutation, Rac activation, and subsequent actin polymerization during FcγR-mediated phagocytosis. Cellular Immunology. 2012;274:61–71. doi: 10.1016/j.cellimm.2012.02.002. [DOI] [PMC free article] [PubMed] [Google Scholar]
- Karavitis J, Murdoch EL, Gomez ER, Ramirez L, Kovacs EJ. Acute ethanol exposure attenuates pattern recognition receptor activated macrophage functions. Journal of Interferon & Cytokine Research. 2008;28:413–422. doi: 10.1089/jir.2007.0111. [DOI] [PMC free article] [PubMed] [Google Scholar]
- László FA, Varga C, Pávó I, Gardi J, Vecsernyés M, Gálfi M, et al. Vasopressin pressor receptor-mediated activation of HPA axis by acute ethanol stress in rats. American Journal of Physiology Regulatory, Integrative, and Comparative Physiology. 2001;280:R458–465. doi: 10.1152/ajpregu.2001.280.2.R458. [DOI] [PubMed] [Google Scholar]
- Li X, Rana SN, Kovacs EJ, Gamelli RL, Chaudry IH, Choudhry MA. Corticosterone suppresses mesenteric lymph node T cells by inhibiting p38/ERK pathway and promotes bacterial translocation after alcohol and burn injury. American Journal of Physiology Regulatory, Integrative and Comparative Physiology. 2005;289:R37–44. doi: 10.1152/ajpregu.00782.2004. [DOI] [PubMed] [Google Scholar]
- Mandrekar P, Catalano D, Doganiuc A, Kodys K, Szabo G. Inhibition of myeloid dendritic cell accessory cell function and induction of T cell anergy by alcohol correlates with decreased IL-12 production. Journal of Immunology. 2004;173:3398–3407. doi: 10.4049/jimmunol.173.5.3398. [DOI] [PubMed] [Google Scholar]
- Masten BJ, Olson GK, Tarleton CA, Rund C, Schuyler M, Mehran R, et al. Characterization of myeloid and plasmacytoid dendritic cells in human lung. Journal of Immunology. 2006;177:7784–7793. doi: 10.4049/jimmunol.177.11.7784. [DOI] [PubMed] [Google Scholar]
- Molina PE, Sulzer JK, Whitaker AM. Alcohol abuse and the injured host: dysregulation of counterregulatory mechanisms review. Shock. 2013;39:240–249. doi: 10.1097/SHK.0b013e318285b86d. [DOI] [PMC free article] [PubMed] [Google Scholar]
- Ohlsson K, Björk P, Bergenfeldt M, Hageman R, Thompson RC. Interleukin-1 receptor antagonist reduces mortality from endotoxin shock. Nature. 1990;348:550–552. doi: 10.1038/348550a0. [DOI] [PubMed] [Google Scholar]
- Pruett SB, Fan R, Cheng B, Glover M, Tan W, Deng X. Innate immunity and inflammation in sepsis: mechanisms of suppressed host resistance in mice treated with ethanol in a binge-drinking model. Toxicological Sciences. 2010;117:314–324. doi: 10.1093/toxsci/kfq215. [DOI] [PMC free article] [PubMed] [Google Scholar]
- Shih HC, Hu SC, Yang CC, Ko TJ, Wu JK, Lee CH. Alcohol intoxication increases morbidity in drivers involved in motor vehicle accidents. The American Journal of Emergency Medicine. 2003;21:91–94. doi: 10.1053/ajem.2003.50025. [DOI] [PubMed] [Google Scholar]
- Szabo G. Monocytes, alcohol use, and altered immunity. Alcoholism: Clinical and Experimental Research. 1998;22:216S–219S. doi: 10.1097/00000374-199805001-00002. [DOI] [PubMed] [Google Scholar]
- Szabo G, Chavan S, Mandrekar P, Catalano D. Acute alcohol consumption attenuates interleukin-8 (IL-8) and monocyte chemoattractant peptide-1 (MCP-1) induction in response to ex vivo stimulation. Journal of Clinical Immunology. 1999;19:67–76. doi: 10.1023/a:1020518703050. [DOI] [PubMed] [Google Scholar]
- Szabo G, Mandrekar P, Dolganuic D, Catalano D, Kodys K. Reduced alloreactive T-cell activation after alcohol intake is due to impaired monocyte accessory cell function and correlates with elevated IL-10, IL-13, and decreased IFNgamma levels. Alcoholism: Clinical and Experimental Research. 2001;25:1766–1772. [PubMed] [Google Scholar]
- Szabo G, Mandrekar P, Girouard L, Catalano D. Regulation of human monocyte functions by acute ethanol treatment: decreased tumor necrosis factor-alpha, interleukin-1 beta and elevated interleukin-10, and transforming growth factor-beta production. Alcoholism: Clinical and Experimental Research. 1996;20:900–907. doi: 10.1111/j.1530-0277.1996.tb05269.x. [DOI] [PubMed] [Google Scholar]
- Szabo G, Mandrekar P, Verma B, Isaac A, Catalano D. Acute ethanol consumption synergizes with trauma to increase monocyte tumor necrosis factor alpha production late postinjury. Journal of Clinical Immunology. 1994;14:340–352. doi: 10.1007/BF01546318. [DOI] [PubMed] [Google Scholar]
- Takeuchi O, Akira S. Signaling pathways activated by microorganisms. Current Opinion in Cell Biology. 2007;19:185–191. doi: 10.1016/j.ceb.2007.02.006. [DOI] [PubMed] [Google Scholar]
Associated Data
This section collects any data citations, data availability statements, or supplementary materials included in this article.