Abstract
Hypoxia is a critical hallmark of glioma, and significantly compromises treatment efficacy. Unfortunately, techniques for monitoring glioma pO2 to facilitate translational research are lacking. Furthermore, poor prognoses of patients with malignant glioma, in particular glioblastoma multiforme, warrant effective strategies that can inhibit hypoxia and improve treatment outcome.
EPR oximetry using implantable resonators was implemented for monitoring pO2 in normal cerebral tissue and U251 glioma in mice. Breathing carbogen (95% O2 + 5% CO2) was tested for hyperoxia in the normal brain and glioma xenografts. A new strategy to inhibit glioma growth by rationally combining gemcitabine and MK-8776, a cell cycle checkpoint inhibitor, was also investigated.
The mean pO2 of left and right hemisphere were approximately 56 – 69 mmHg in the normal cerebral tissue of mice. The mean baseline pO2 of U251 glioma on the first and fifth day of measurement was 21.9 ± 3.7 and 14.1 ± 2.4 mmHg, respectively. The mean brain pO2 including glioma increased by at least 100% on carbogen inhalation, although the response varied between the animals over days. Treatment with gemcitabine + MK-8776 significantly increased pO2 and inhibited glioma growth assessed by MRI.
In conclusion, EPR oximetry with implantable resonators can be used to monitor the efficacy of carbogen inhalation and chemotherapy on orthotopic glioma in mice. The increase in glioma pO2 of mice breathing carbogen can be used to improve treatment outcome. The treatment with gemcitabine + MK-8776 is a promising strategy that warrants further investigation.
Keywords: pO2, glioma, carbogen, chemotherapy, cell cycle checkpoint
Introduction
Tumor hypoxia (partial pressure of oxygen, pO2 < 15–20 mmHg) is a major impediment to radiation and chemotherapy1–4. Extensive research has focused on the development of strategies that can overcome hypoxia to improve treatment outcome5–7. One of the simplest strategies is inhaling gases with high oxygen content, e.g. carbogen (95% O2 + 5% CO2)7–9. However, tumor pO2 and response to carbogen cannot be predicted by tumor type or size, and therefore must be measured3, 4. Furthermore, tumor pO2 can vary temporally in response to various treatments, such as chemotherapy. Techniques that can monitor pO2 are crucial for developing strategies to modulate hypoxia and schedule therapy at times of optimal oxygen levels in the tumors to improve treatment outcome.
Malignant glioma, in particular, are therapeutically challenging due to their aggressive growth characteristics and hypoxic environment2, 4, 10. Additionally, techniques for direct and repeated measurements of pO2 in orthotopic glioma for translational research are lacking. EPR oximetry using microcrystalline oxygen sensors (e.g. LiPc, lithium phthalocyanine crystals) can be used to measure temporal changes in glioma pO2 in experimental animal models11–14. Recently developed implantable resonators provide 6–10 times greater signal to noise (S/N) of the EPR signal compared to direct implants of LiPc crystals in a tissue of interest12. The goal of this study was to demonstrate pO2 measurements in both hemispheres of mouse brain by using implantable resonators with multi-site EPR oximetry. The multi-site oximetry approach involves the use of magnetic field gradients for simultaneous measurement of pO2 at two or more sites in a tissue of interest12, 14, 15. The oximetry technique with implantable resonators was used to investigate temporal changes in the cerebral pO2 of control mice and those inoculated with U251 glioma and the response to carbogen inhalation for hyperoxygenation.
Ongoing clinical trials have investigated the potential of gemcitabine as a radiosensitizer for the treatment of glioma16–18. Compared to temozolomide, gemcitabine offers several advantages that can potentially enhance treatment outcome. It is metabolized to di- and triphosphate analogues which exert cytotoxicity by the incorporation of gemcitabine triphosphate into the DNA, while the diphosphate inhibits ribonucleotide reductase thereby depleting the deoxyribonucleotide pool required for DNA synthesis19–21. Consequently, gemcitabine stalls replication forks resulting in cell cycle arrest in S phase. The stalled replication forks are stabilized by Chk1 such that inhibition of Chk1 by MK-8776 collapses the replication forks to generate lethal DNA double-strand breaks 22. We have tested the hypothesis that cell cycle checkpoint inhibition following treatment with gemcitabine can selectively inhibit aggressive glioma growth to improve outcome. The efficacy of gemcitabine and/or MK-8776 on glioma growth and potential effect on pO2 was evaluated using MRI and EPR oximetry, respectively.
The results highlight the application of EPR oximetry with implantable resonators for monitoring temporal changes in brain pO2 including orthotopic glioma and the effectiveness of carbogen inhalation for hyperoxygenation. The treatment with gemcitabine + MK-8776 also increased pO2 significantly and inhibited glioma growth.
Material and Methods
Animals, tumor cells and drugs
The animal protocol was approved by the Dartmouth College Institutional Animal Care and Use Committee (IACUC). Male athymic Nu/Nu mice (Charles River Laboratory, MA) weighing 18–20 g each were used for the experiments. U251 cells were obtained from the Developmental Therapeutics Program, National Cancer Institute, and maintained in RPMI1640 medium plus serum and antibiotics. Gemcitabine was obtained from Eli Lilly, IN and diluted in saline for treatment. MK-8776 (Merck, NJ) was prepared in (2-Hydroxylpropyl)-β-cyclodextrin (45% w/v, Sigma-Aldrich) 23. The mice were treated with gemcitabine, MK-8776, or gemcitabine + MK-8776 by intraperitoneal injection.
Implantable resonator for pO2 measurements using EPR
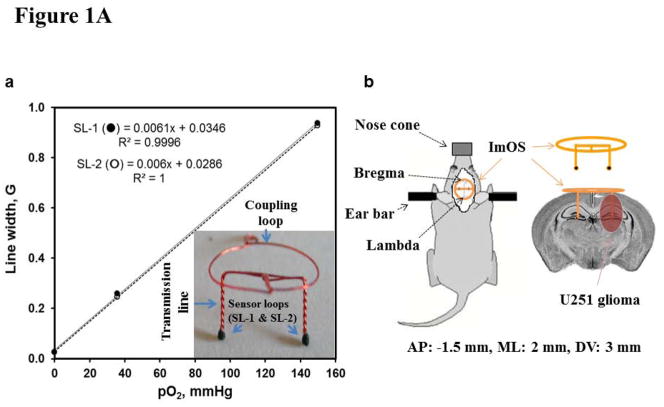
The implantable resonators were constructed with enameled copper wire (0.15 mm wire gauge) and had a large loop (coupling loop, 10 mm diameter) on one end and two small loops (sensory loops, 0.4–0.5 mm diameter) on the other end of the wire (transmission line), Fig. 1A12. The sensory loops were loaded with 30–50 μg of LiPc crystals and then the entire implantable resonator was coated with a gas permeable and biocompatible Teflon AF240012, 24. For implantation, a small incision was made on the skull of anesthetized (2% isoflurane in 30% O2) mice and sensory tips were gently inserted through burr holes drilled using 23 gauge needles 2 mm left and right from the midline and 1.5 mm posterior to the bregma using a stereotaxic frame. The coupling loop was placed on the skull below the skin for inductive coupling with the external surface loop resonator of the EPR spectrometer. The length of the transmission lines (i.e. depth of tissue probed) was 3 mm and the distance between two sensory loops was 4 mm. The implantable resonator was calibrated prior to placement in the mice and the EPR spectrum reflects the average pO2 from each sensory tip with an approximate surface area of 0.13–0.2 mm2.
Figure 1.
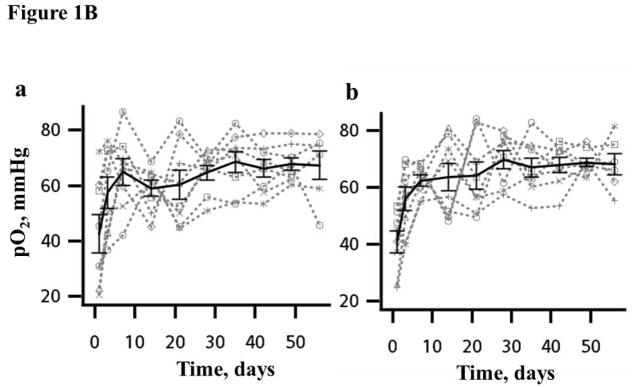
Figure 1A. (a) Implantable resonator with two sensory loops (SLs) and the response of each SL to different concentration of perfused oxygen (calibration) and regression coefficient (R2). (b) Axial view of a mouse skull with trephination positions of the SLs, and a schematic showing the location of the U251 glioma and the location of the SLs in the brain. AP: anterior-posterior; ML; medial-lateral; DV: dorsal-ventral.
Figure 1B. Time course of normal brain pO2 in the (a) left and (b) right hemisphere measured simultaneously in each mouse using implantable resonator with EPR oximetry in experiments repeated for 8 consecutive weeks. The bold line is the mean group pO2, Mean ± SEM, N = 8.
Inoculation of U251 glioma cells in mouse brain
In the experiments with glioma, 2 ×10⁶ U251 cells in 8–10 μl were injected slowly in 2–3 min through the right burr hole at a depth of 2.5 mm immediately after the placement of the implantable resonator. The holes were cleaned and sealed with bone wax, and the skin sutured.
Magnetic Resonance Imaging (MRI) for U251 glioma volume and ADC measurements
The mice were imaged on day 1 (approximately 14–18 days after cell injection along with the placement of implantable resonators) to confirm glioma growth prior to the start of experiments and on day 8 (last day of the experiment). The implantable resonator appears as a signal void in the T1-weighted scans, which was used to confirm their location in the brain. The images were acquired on an Agilent 9.4T horizontal magnet equipped with gradient coils and a physiological monitoring unit for temperature and respiration rates. Gadopentate (0.2 mmol/kg, i.p., Magnevist, Bayer Healthcare) was injected and a multi-slice spin echo sequence was used to acquire T1-weighted images for tumor volume determination, 12 slices of 1 mm thickness with repetition time TR: 700 ms, echo time TE: 16 ms, field-of-view: 40 mm × 40 mm and acquisition matrix: 256 × 256 and 2 signal averages. The glioma volumes were calculated by selecting a region-of-interest on the contrast enhanced glioma.
Diffusion-weighted images (DWI) were acquired using the same geometry, TR/TE = 700/36 ms, b-value = 1000 mm2/s, and 1 signal average. Apparent diffusion coefficient (ADC) maps were generated by fitting the DWI signal to a mono-exponent on a pixel-by-pixel basis25, 26, using VnmrJ software.
Multi-site EPR oximetry using implantable resonator
A 1.2 GHz EPR spectrometer equipped with a surface loop resonator was used for in vivo oximetry27, 28. The anesthetized mice (1.5% isoflurane in 30% O2) were positioned in the EPR magnet and the external surface loop resonator was gently placed over the head region. A magnetic field gradient of 3.0 G/cm was used to separate the EPR spectra from each sensory tip14, 15. The peak-to-peak line-widths of the EPR spectra were used to determine pO2 by using the calibration of each implantable resonator. The mice were maintained at 37 ± 0.5°C (monitored via a rectal probe) by keeping the animals warm with a heated water blanket and warm air during the experiments. The EPR settings were: incident microwave power: 0.08–0.8 mW; modulation frequency 24 kHz; magnetic field center 425 G; scan time 10 sec, scan range 3–30 G, and modulation amplitude not exceeding one third of the line width.
Longitudinal measurement of brain pO2 and response to carbogen inhalation
The mice were anesthetized and the pO2 of left and right hemispheres were measured simultaneously for 30 min on day 1 (24 h after the placement of sensor) and the measurements were repeated on days 3, 7, 14, 21, 28, 35, 42, 49 and 56 (n = 8). In the experiment on day 14, the breathing gas was switched from 30% O2 to carbogen for 25 min and then returned to 30% O2 for 15 min of EPR measurements. This experimental protocol was repeated on days 15–18.
The experiments with breathing carbogen was also carried out in mice bearing U251 glioma to evaluate the response to hyperoxygenation (n = 6).
Efficacy of treatment with gemcitabine, MK-8776 or gemcitabine+MK-8776
The animals were randomly assigned to 4 groups: (i) control group (saline), n = 5; (ii) 150 mg/kg gemcitabine, n = 5; (iii) 20 mg/kg MK-8776, n = 6; and (iv) 150 mg/kg gemcitabine followed by 20 mg/kg MK-8776 at 18 h, n = 8.
The gemcitabine and MK-8776 doses were selected based on prior publications22, 23. The schedule is based on our in vitro and in vivo observations of maximal cell cycle arrest and sensitivity to the Chk1 inhibitor when added 18 h after gemcitabine22. First, a baseline glioma and contralateral brain (CLB) pO2 was measured in anesthetized mice (1.5% Isoflurane with 30% O2) for 30 min and then treated as described above (day 1). The pO2 measurements were repeated for four subsequent days.
Immunohistochemistry
The U251 glioma were harvested, fixed in formalin, and serial sections were stained with anti-Ki67 (Vector Laboratories) and anti-geminin (Santa-Cruz) in the Research Pathology Shared Resource. For each tumor, at least 2 fields from each of 2 sections were photographed, each field representing about 1000 cells; 2–4 individual tumors were scored at each time point. The number of cells positive for geminin was expressed as a percentage of those positive for Ki67. Geminin is an established marker of S/G2 cells and readily amenable to analysis of cell cycle distribution in solid tumors, particularly as normal tissues are rarely proliferative. We have previously demonstrated that the use of geminin is best when combined with the Ki67 index which thereby corrects for differential proliferative index in different regions of a tumor 22.
Statistical analysis
One-way ANOVA and paired t test were used to analyze the mean baseline pO2, temporal changes in pO2 on treatment with gemcitabine, MK-8776, gemcitabine + MK-8776 and glioma volume. The multilevel linear mixed effects model was used to analyze the longitudinal pO2 data in the log scale 29, 30. An exponential quadratic function of time was used to determine maximum pO2 (pO2 max) and the time to reach maximum pO2 (T max) during carbogen inhalation, and time taken to return to baseline pO2 (T base) when the gas was switched back to 30% O2. Each curve was analyzed accounting for three sources of variation: left- and right hemisphere, inter- and intra-mouse variations. The tests were two-sided, and a p value <0.05 was considered statistically significant. Analyses were done using the statistical package SAS 9.3 (SAS Institute Inc., NC, USA).
Results
Longitudinal measurement of cerebral pO2 and response to carbogen breathing
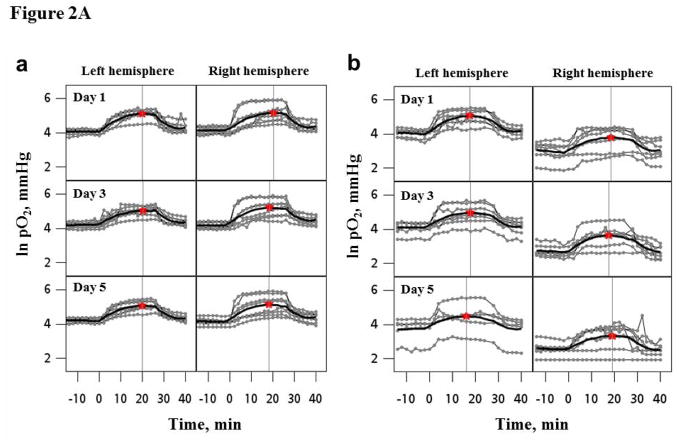
A day-to-day variation in the cerebral pO2 of each animal was evident, Fig. 1B. The mean tissue pO2 in the left and right hemispheres were 43 ± 6.8 and 41 ± 3.9 mmHg respectively on day 1 (24 h after the placement of implantable resonators). No significant change in the mean brain pO2 was evident from day 3, and remained stable thereafter for 8 weeks. A significant increase (>100%) in mean brain pO2 was observed on carbogen inhalation in experiments repeated for 5 days, Figure 2A and Table 1. At the individual mouse level, a day-to-day variation in the response to breathing carbogen was apparent. Additionally, the mean baseline pO2, pO2 max, Tmax and Tbase were similar in both hemispheres of the mice, Table 1.
Figure 2.
Figure 2A. Temporal changes in the pO2 of left and right hemisphere of (a) normal mice (n = 8) and (b) mice bearing U251 glioma in the right hemisphere (n=6) during 30% O2, carbogen and 30% O2 breathing. The experiment was repeated for five consecutive days. The bold lines are the mean response in the group obtained using an exponential quadratic function. The star symbol and horizontal line indicates the maximal pO2 and time to reach maximal pO2 on each day, respectively.
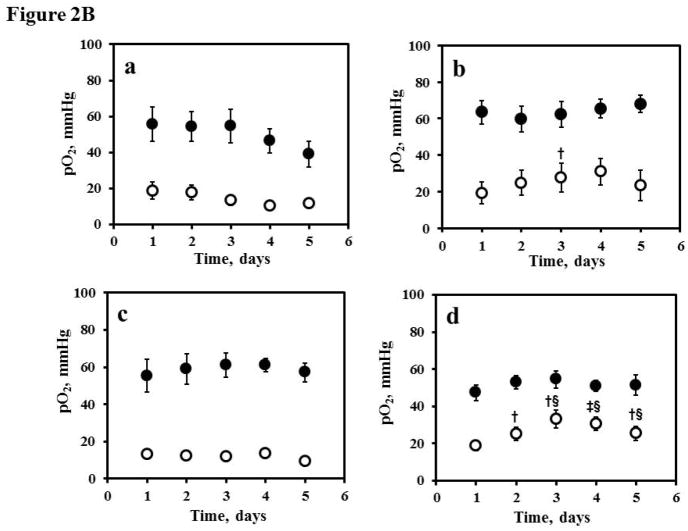
Figure 2B. Tissue pO2 of the contralateral brain (●: CLB) and ipsilateral glioma (
 : U251) in the (a) control (vehicle, n = 5); (b) gemcitabine (150 mg/kg, n = 5); (c) MK-8776 (50 mg/kg, n = 6), and (d) gemcitabine (150mg/kg) + MK-8776 (50 mg/kg) at 18 h (n = 8) measured using EPR oximetry with implantable resonator for five consecutive days. The mice were treated on day 1 after baseline pO2 measurement. †p<0.05, ‡p<0.01, compared with day 1; §p<0.01, compared with control group at the same day.
Table 1.
Time course and extent of maximum increase in normal brain pO2 prior to, during and post carbogen inhalation on 5 consecutive days in mice
| Days | Site | pO2 base (mmHg) | PO2 max (mmHg) | T max (min) | T base (min) |
|---|---|---|---|---|---|
| 1 | LH | 59.2±2.9 | 187.6±18.8‡ | 22.5±2.8 | 12.4±0.4 |
| RH | 63.7±4.8 | 279.8±70.8‡ | 24.4±3.0 | 12.4±0.6 | |
| 2 | LH | 63.0±1.4 | 233.5±68.1‡ | 22.8±2.7 | 12.2±0.6 |
| RH | 70.3±5.1 | 287.1±67.5‡ | 22.2±3.6 | 12.6±0.7 | |
| 3 | LH | 67.3±3.7 | 172.9±17.2‡ | 23.9±3.0 | 13.0±0.7 |
| RH | 66.3±4.0 | 279.8±70.2‡ | 21.5±2.8 | 12.8±0.8 | |
| 4 | LH | 67.9±4.7 | 167.9±20.6‡ | 19.6±1.1 | 14.3±1.3 |
| RH | 67.6±3.4 | 209.5±40.2‡ | 19.6±1.2 | 13.1±0.6 | |
| 5 | LH | 67.0±3.2 | 235.8±63.4‡ | 22.9±2.9 | 14.2±1.1 |
| RH | 64.0±4.2 | 208.4±44.3‡ | 21.5±2.8 | 14.1±3.1 |
Abbreviations: pO2 base: baseline pO2; T max: time to reach maximum pO2; pO2 max: maximum pO2; T base: time to return to the baseline pO2 since switch carbogen to 30%O2. LH: left hemisphere; RH: right hemisphere.
p< 0.01, compared with the pO2 max from pO2 base on same day.
Orthotopic U251 glioma and contralateral brain pO2 and response to carbogen breathing
The mean baseline pO2 of U251 glioma and contralateral brain (CLB) were 21.9 ± 3.7 and 57.2 ± 4.9 mmHg, respectively on day 1 (approximately 14–18 days after cell injection along with the placement of implantable resonators) and were significantly different, Table 2. A modest decline in the mean baseline glioma pO2 from 18.4±3.9 to 14.1 ± 2.4 mmHg was observed on days 2–5 (p = 0.056 on day 4 and p = 0.086 on day 5 compared to day 1), respectively.
Table 2.
Time course and extent of maximum increase in normal brain and U251 glioma pO2 prior to, during and post carbogen inhalation on 5 consecutive days in mice
| Days | Site | pO2 base (mmHg) | PO2 max (mmHg) | T max (min) | T base (min) |
|---|---|---|---|---|---|
| 1 | CLB | 57.2±4.9 | 170.5±26.4‡ | 17.6±0.8 | 12.6±0.6 |
| U251 | 21.9±3.7§§ | 53.6±10.9† | 20.1±1.6 | 14.1±0.4 | |
| 2 | CLB | 59.3±5.7 | 191.4±41.0‡ | 18.4±1.6 | 12.6±0.8 |
| U251 | 18.4±3.9§§ | 45.9±9.2‡ | 21.7±2.1 | 14.0±2.4 | |
| 3 | CLB | 62.2±6.6 | 168.6±37.5‡ | 18.7±0.8 | 12.6±0.8 |
| U251 | 15.6±2.1§§£ | 45.1±10.7‡ | 19.6±1.3 | 12.4±0.8 | |
| 4 | CLB | 52.0±5.1 | 136.9±31.4‡ | 18.9±1.6 | 13.5±1.3 |
| U251 | 13.0±2.1§§£ | 29.7±7.8‡ | 22.3±1.1 | 13.2±0.7 | |
| 5 | CLB | 67.0±3.2 | 119.2±43.4† | 16.8±2.7 | 13.9±0.9 |
| U251 | 14.1±2.4§ | 34.5±7.2† | 21.2±1.4 | 11.9±0.8 |
Abbreviations: pO2 base: baseline pO2; T max: time to reach maximum pO2; pO2 max: maximum pO2; T base: time to return to the baseline pO2, the numbers in the brackets are actual time to return to baseline level since switch carbogen to 30%O2. CLB: Contralateral brain; U251: U251 glioma.
p<0.05,
p< 0.01, compared with the pO2 max from pO2 base on same day;
p<0.05,
p < 0.01, compared with CLB on same day;
p<0.05, compared with the U251 pO2 on day 1.
The mean pO2 of the glioma and CLB increased significantly by at least 100% during carbogen inhalation on days 1–5, Table 2. No significant change in the pO2 max, T max and T base of the glioma and contralateral brain over 5 days was noted.
U251 glioma and CLB pO2 on treatment with gemcitabine, MK-8776, and gemcitabine + MK-8776
The mean baseline U251 glioma pO2 in the control, gemcitabine, MK-8776 and gemcitabine + MK-8776 groups were 18.9 ± 4.7, 19.4 ± 5.9, 13.1 ± 2.2 and 19.1 ± 2.8 mmHg respectively, Fig. 2B. On the other hand, the mean baseline contralateral brain pO2 in the control, gemcitabine, MK-8776 and gemcitabine + MK-8776 groups were 55.6 ± 9.5, 63.4 ± 6.3, 55.3 ± 8.8 and 47.1 ± 4.1 mmHg, respectively. No significant change in the pO2 of glioma and CLB was evident in the control group over 5 days. However, the mean pO2 of glioma increased significantly by approximately 20% on day 3 after treatment with gemcitabine on day 1. A significant increase in mean pO2 of glioma by 50% was evident on days 3–5 following treatment with gemcitabine + MK-8776. On the other hand, the pO2 of contralateral brain did not change over 5 days of repeated measurement in all the groups.
Cell cycle arrest with gemcitabine + MK-8776
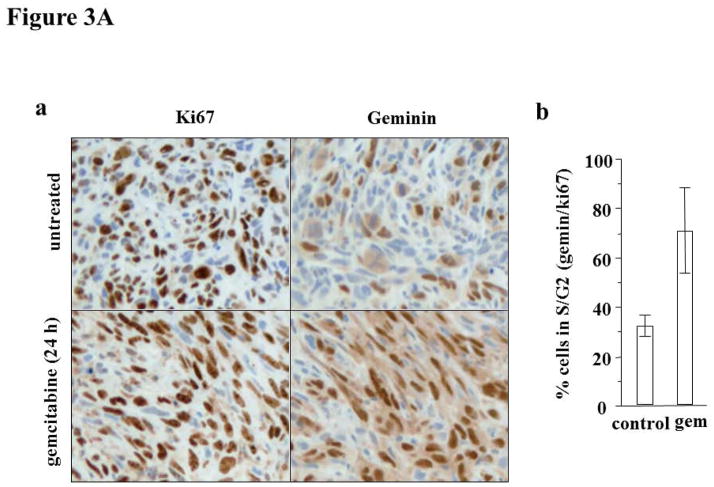
We investigated the cell cycle arrest induced by gemcitabine in the U251 glioma, Fig. 3A. Ki67 staining represents cells at all phases of the cell cycle except G0. On the other hand, geminin reflects cells in only S and G2. Hence the ratio of geminin to Ki67 represents the proportion of proliferative cells that are present in S or G2. Untreated U251 glioma exhibited ~32% geminin/Ki67. However, eighteen hours following administration of gemcitabine, geminin/Ki67 were >70%. The administration of MK-8776 alone or following gemcitabine did not alter the percent of cells in S/G2 phase (data not shown). The increase in the number of cells in S/G2 reflects the ability of gemcitabine to arrest cells at this phase of the cell cycle, and does not reflect an enhanced proliferative capacity. The geminin/Ki67 values are similar to our recent experiments with two pancreas tumor models22, 31, and confirm that gemcitabine crosses any blood-brain barrier that may exist.
Figure 3.
Figure 3A. (a) Geminin and Ki67 immunohistochemistry images of the control and glioma treated with gemcitabine. (b) The results expressed as the % geminin positive/%Ki67 positive; n = 2–4 (Mean ± SD).
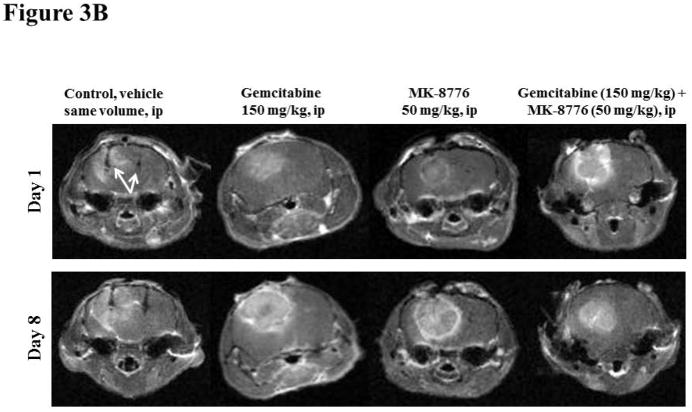
Figure 3B. Typical diffusion images used to assess volume and apparent diffusion coefficient of water (ADC) of orthotropic U251 glioma on days 1 and 8 in the control, gemcitabine, MK-8776 and gemcitabine + MK-8776 groups by MRI. The implantable resonators are visible in the images of the control group (indicated by arrows).
U251 glioma growth, ADC and correlation with pO2
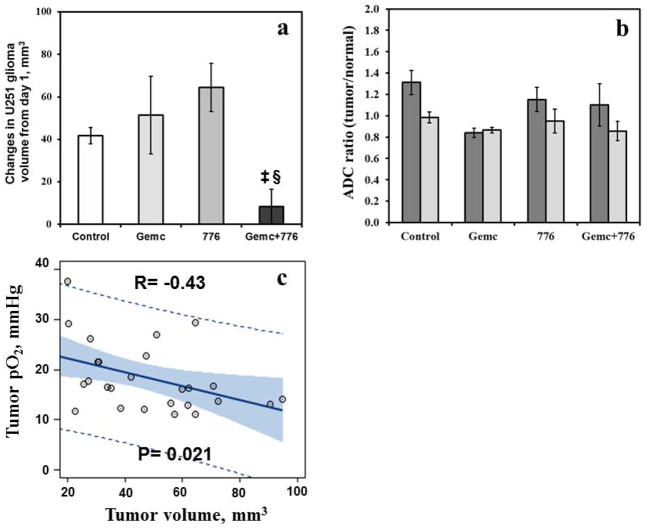
The typical T1-weighted images superimposed with ADC acquired in the control and treatment groups on day 1 and day 8 are shown in Fig. 3B. The mean glioma volumes on day 1 in the control, gemcitabine, MK-8776 and gemcitabine + MK-8776 groups were 48.1 ± 5.4, 52.3 ± 14.5, 33.5 ± 6.7 and 58.8 ± 14.7 mm3, respectively and were not significantly different. The relative change in the glioma volume of the group treated with gemcitabine + MK-8776 was significantly smaller than the control, Fig. 4a However, no significant change in the ADC was evident in all the groups, Fig. 4b.
Figure 4.
(a) Relative change in U251 glioma volume (day 8 - day 1, mm3) and (b) ADC ratio (tumor/normal) in the control, gemcitabine, MK-8776 and gemcitabine + MK-8776 groups. ‡p < 0.01, compared with day 1; §p < 0.01, compared with control group. (c) U251 glioma pO2 vs volume on day 1. Dash lines indicate 95% prediction limits, bold line indicates the fit and grey area indicates confidence limits.
A significant linear correlation was evident between the glioma volume and pO2 on day 1, Fig. 4c. These results suggest that the glioma pO2 is size dependent, smaller tumors are relatively better oxygenated but the pO2 declines with increase in volume.
Discussion
The prognosis of patients with malignant glioma has remained poor despite aggressive treatment protocols of maximal surgical resection followed by chemoradiation10, 32. Given the significant role of tumor hypoxia in therapeutic resistance and malignant progression, it is vital to develop strategies that can alleviate hypoxia as well as inhibit glioma growth. We have previously investigated the effect of an allosteric effector of hemoglobin (Efaproxiral), carbogen inhalation and radiotherapy on tumor pO2 in orthotopic 9L, C6, CNS-1 and F98 glioma11, 12, 33, 34. Our goal is to characterize temporal changes in glioma pO2, improve oxygen level and treatment outcome. In this study, we have implemented a novel implantable resonator for monitoring cerebral pO2 including orthotopic glioma in mice with EPR oximetry.
Stable brain pO2 was observed within 3 days after the placement of the implantable resonator. The low cerebral pO2 observed initially is likely due to the trauma associated with the surgical procedures used for the placement of the resonators in the brain of mice. A systematic study is underway to determine the minimal number of days that may be needed before a robust pO2 measurement can be made. A consistent increase in the cerebral pO2 was attained in experiments with carbogen breathing for five consecutive days. The pO2 of the U251 glioma was significantly lower than the contralateral brain and declined further over days. Additionally, glioma pO2 was dependent on size, smaller glioma were relatively oxygenated. A significant increase in glioma pO2 was achieved with carbogen inhalation for five consecutive days. A maximal increase in glioma pO2 was observed within 15–20 min of carbogen inhalation and glioma remained oxygenated for at least 10–12 min after the carbogen was discontinued. Carbogen inhalation along with real-time oximetry will be valuable in the potential optimization of treatment modalities reliant on the levels of hypoxia in glioma.
A significant increase in glioma pO2 on day 3 was observed following treatment with gemcitabine. However, a consistent increase in pO2 occurred on days 3–5 along with a significant decrease in glioma growth following treatment with gemcitabine + MK-8776. The robust increase in oxygen levels in the glioma is likely due to a decrease in oxygen consumption with malignant cell kill induced by cell cycle arrest and subsequent collapse of the replication forks to generate lethal DNA double-strand breaks. The extent of cell cycle arrest observed in the orthotopic U251 glioma is similar to that observed in the ectopic tumors on the flank of mice22. These results confirm that gemcitabine and MK-8776 effectively permeate the blood-brain barrier and inhibit glioma growth. However, no significant change in the ADC ratio of U251 glioma on day 8 compared to day 1 was evident. The heterogeneous U251 glioma is comprised of solid and cystic regions, which will impact the overall ADC values. Jenkinson et al. have reported no correlation between the ADC metrics and cellularity in oligodendrogliomas35. Additionally, Koral et al. have shown that although ADC metrics are useful in the preoperative diagnosis of common pediatric cerebellar tumors, however tumor cellularity may not be the sole determinant of the differences in diffusivity25.
In conclusion, these results confirm the practicality of implantable resonators for longitudinal oximetry in mice. A significant increase in pO2 and decrease in glioma growth following treatment with gemcitabine + MK-8876 warrants further investigation for potential clinical translation of this approach to improve treatment outcome. The therapeutic window during which an increase in glioma pO2 occurred on breathing carbogen or treatment with gemcitabine + MK-8776 can be used to schedule irradiation for further improving treatment outcome. A direct and repeated measurement of glioma pO2 is likely to play a vital role in understanding the dynamics of hypoxia, and effectiveness of hyperoxic strategies and chemotherapy. A real-time knowledge of glioma pO2 will be extremely useful in developing oxygen guided optimal treatment plans in the clinic. We are currently pursuing Investigational Device Exemption from FDA for the application of implantable resonators for oximetry in glioma and head & neck cancer in patients.
Novelty and Impact.
Despite pathological consequence of hypoxia including poor prognosis, techniques for direct monitoring of glioma pO2, and strategies to improve oxygen levels and effective treatment are lacking. EPR oximetry is implemented for repeated quantification of pO2 in human xenograft glioma, and then carbogen inhalation is investigated for hyperoxygenation. An innovative treatment strategy by rationally combining gemcitabine with a cell cycle checkpoint inhibitor to significantly arrest glioma growth and increase pO2 is demonstrated.
Acknowledgments
This study was funded by the National Institutes of Health (NIH) grants CA117874, CA23108, 1S10RR25048, CA120919, Pilot Program Project funded by the Norris Cotton Cancer Center, Department of Radiology, and the EPR Center for Viable Systems, Lebanon, NH.
Abbreviations
- pO2
Partial pressure of oxygen
- EPR oximetry
Electron paramagnetic resonance oximetry
- MRI
Magnetic resonance imaging
- ADC
Apparent diffusion coefficient of water
References
- 1.Overgaard J. Hypoxic radiosensitization: adored and ignored. J Clin Oncol. 2007;25:4066–74. doi: 10.1200/JCO.2007.12.7878. [DOI] [PubMed] [Google Scholar]
- 2.Jensen RL. Brain tumor hypoxia: tumorigenesis, angiogenesis, imaging, pseudoprogression, and as a therapeutic target. J Neurooncol. 2009;92:317–35. doi: 10.1007/s11060-009-9827-2. [DOI] [PubMed] [Google Scholar]
- 3.Vaupel P. Hypoxia and aggressive tumor phenotype: implications for therapy and prognosis. Oncologist. 2008;13 (Suppl 3):21–6. doi: 10.1634/theoncologist.13-S3-21. [DOI] [PubMed] [Google Scholar]
- 4.Oliver L, Olivier C, Marhuenda FB, Campone M, Vallette FM. Hypoxia and the malignant glioma microenvironment: regulation and implications for therapy. Curr Mol Pharmacol. 2009;2:263–84. doi: 10.2174/1874467210902030263. [DOI] [PubMed] [Google Scholar]
- 5.Wilson WR, Hay MP. Targeting hypoxia in cancer therapy. Nat Rev Cancer. 2011;11:393–410. doi: 10.1038/nrc3064. [DOI] [PubMed] [Google Scholar]
- 6.Jordan BF, Sonveaux P. Targeting tumor perfusion and oxygenation to improve the outcome of anticancer therapy. Frontiers in pharmacology. 2012;3:94. doi: 10.3389/fphar.2012.00094. [DOI] [PMC free article] [PubMed] [Google Scholar]
- 7.Overgaard J. Hypoxic modification of radiotherapy in squamous cell carcinoma of the head and neck:a systematic review and meta-analysis. Radiother Oncol. 2011;100:22–32. doi: 10.1016/j.radonc.2011.03.004. [DOI] [PubMed] [Google Scholar]
- 8.Janssens GO, Rademakers SE, Terhaard CH, Doornaert PA, Bijl HP, van den Ende P, Chin A, Marres HA, de Bree R, van der Kogel AJ, Hoogsteen IJ, Bussink J, et al. Accelerated radiotherapy with carbogen and nicotinamide for laryngeal cancer: results of a phase III randomized trial. J Clin Oncol. 2012;30:1777–83. doi: 10.1200/JCO.2011.35.9315. [DOI] [PubMed] [Google Scholar]
- 9.Ashkanian M, Borghammer P, Gjedde A, Ostergaard L, Vafaee M. Improvement of brain tissue oxygenation by inhalation of carbogen. Neuroscience. 2008;156:932–8. doi: 10.1016/j.neuroscience.2008.08.016. [DOI] [PubMed] [Google Scholar]
- 10.Lima FR, Kahn SA, Soletti RC, Biasoli D, Alves T, da Fonseca AC, Garcia C, Romao L, Brito J, Holanda-Afonso R, Faria J, Borges H, et al. Glioblastoma: therapeutic challenges, what lies ahead. Biochim Biophys Acta. 2012;1826:338–49. doi: 10.1016/j.bbcan.2012.05.004. [DOI] [PubMed] [Google Scholar]
- 11.Khan N, Li H, Hou H, Lariviere JP, Gladstone DJ, Demidenko E, Swartz HM. Tissue pO2 of orthotopic 9L and C6 gliomas and tumor-specific response to radiotherapy and hyperoxygenation. Int J Radiat Oncol Biol Phys. 2009;73:878–85. doi: 10.1016/j.ijrobp.2008.10.025. [DOI] [PMC free article] [PubMed] [Google Scholar]
- 12.Hou H, Dong R, Li H, Williams B, Lariviere JP, Hekmatyar SK, Kauppinen RA, Khan N, Swartz H. Dynamic changes in oxygenation of intracranial tumor and contralateral brain during tumor growth and carbogen breathing: a multisite EPR oximetry with implantable resonators. J Magn Reson. 2012;214:22–8. doi: 10.1016/j.jmr.2011.09.043. [DOI] [PMC free article] [PubMed] [Google Scholar]
- 13.Hou H, Khan N, O’Hara JA, Grinberg OY, Dunn JF, Abajian MA, Wilmot CM, Demidenko E, Lu S, Steffen RP, Swartz HM. Increased oxygenation of intracranial tumors by efaproxyn (efaproxiral), an allosteric hemoglobin modifier: In vivo EPR oximetry study. Int J Radiat Oncol Biol Phys. 2005;61:1503–9. doi: 10.1016/j.ijrobp.2004.12.077. [DOI] [PubMed] [Google Scholar]
- 14.Hou H, Mupparaju SP, Lariviere JP, Hodge S, Gui J, Swartz HM, Khan N. Assessment of the changes in 9L and C6 glioma pO2 by EPR oximetry as a prognostic indicator of differential response to radiotherapy. Radiat Res. 2013;179:343–51. doi: 10.1667/RR2811.1. [DOI] [PMC free article] [PubMed] [Google Scholar]
- 15.Smirnov AI, Norby SW, Clarkson RB, Walczak T, Swartz HM. Simultaneous multi-site EPR spectroscopy in vivo. Magn Reson Med. 1993;30:213–20. doi: 10.1002/mrm.1910300210. [DOI] [PubMed] [Google Scholar]
- 16.Fabi A, Mirri A, Felici A, Vidiri A, Pace A, Occhipinti E, Cognetti F, Arcangeli G, Iandolo B, Carosi MA, Metro G, Carapella CM. Fixed dose-rate gemcitabine as radiosensitizer for newly diagnosed glioblastoma: a dose-finding study. J Neurooncol. 2008;87:79–84. doi: 10.1007/s11060-007-9489-x. [DOI] [PubMed] [Google Scholar]
- 17.Metro G, Fabi A, Mirri MA, Vidiri A, Pace A, Carosi M, Russillo M, Maschio M, Giannarelli D, Pellegrini D, Pompili A, Cognetti F, et al. Phase II study of fixed dose rate gemcitabine as radiosensitizer for newly diagnosed glioblastoma multiforme. Cancer Chemother Pharmacol. 2010;65:391–7. doi: 10.1007/s00280-009-1155-x. [DOI] [PubMed] [Google Scholar]
- 18.Sigmond J, Honeywell RJ, Postma TJ, Dirven CM, de Lange SM, van der Born K, Laan AC, Baayen JC, Van Groeningen CJ, Bergman AM, Giaccone G, Peters GJ. Gemcitabine uptake in glioblastoma multiforme: potential as a radiosensitizer. Ann Oncol. 2009;20:182–7. doi: 10.1093/annonc/mdn543. [DOI] [PubMed] [Google Scholar]
- 19.Eisbruch A, Shewach DS, Bradford CR, Littles JF, Teknos TN, Chepeha DB, Marentette LJ, Terrell JE, Hogikyan ND, Dawson LA, Urba S, Wolf GT, et al. Radiation concurrent with gemcitabine for locally advanced head and neck cancer: a phase I trial and intracellular drug incorporation study. J Clin Oncol. 2001;19:792–9. doi: 10.1200/JCO.2001.19.3.792. [DOI] [PubMed] [Google Scholar]
- 20.Elnaggar M, Giovannetti E, Peters GJ. Molecular targets of gemcitabine action: rationale for development of novel drugs and drug combinations. Current pharmaceutical design. 2012;18:2811–29. doi: 10.2174/138161212800626175. [DOI] [PubMed] [Google Scholar]
- 21.Plunkett W, Huang P, Searcy CE, Gandhi V. Gemcitabine: preclinical pharmacology and mechanisms of action. Semin Oncol. 1996;23:3–15. [PubMed] [Google Scholar]
- 22.Montano R, Thompson R, Chung I, Hou H, Khan N, Eastman A. Sensitization of human cancer cells to gemcitabine by the Chk1 inhibitor MK-8776: cell cycle perturbation and impact of administration schedule in vitro and in vivo. BMC cancer. 2013;13:604. doi: 10.1186/1471-2407-13-604. [DOI] [PMC free article] [PubMed] [Google Scholar]
- 23.Guzi TJ, Paruch K, Dwyer MP, Labroli M, Shanahan F, Davis N, Taricani L, Wiswell D, Seghezzi W, Penaflor E, Bhagwat B, Wang W, et al. Targeting the replication checkpoint using SCH 900776, a potent and functionally selective CHK1 inhibitor identified via high content screening. Mol Cancer Ther. 2011;10:591–602. doi: 10.1158/1535-7163.MCT-10-0928. [DOI] [PubMed] [Google Scholar]
- 24.Dinguizli M, Jeumont S, Beghein N, He J, Walczak T, Lesniewski PN, Hou H, Grinberg OY, Sucheta A, Swartz HM, Gallez B. Development and evaluation of biocompatible films of polytetrafluoroethylene polymers holding lithium phthalocyanine crystals for their use in EPR oximetry. Biosens Bioelectron. 2006;21:1015–22. doi: 10.1016/j.bios.2005.03.009. [DOI] [PubMed] [Google Scholar]
- 25.Koral K, Mathis D, Gimi B, Gargan L, Weprin B, Bowers DC, Margraf L. Common pediatric cerebellar tumors: correlation between cell densities and apparent diffusion coefficient metrics. Radiology. 2013;268:532–7. doi: 10.1148/radiol.13121362. [DOI] [PubMed] [Google Scholar]
- 26.Gimi B, Cederberg K, Derinkuyu B, Gargan L, Koral KM, Bowers DC, Koral K. Utility of apparent diffusion coefficient ratios in distinguishing common pediatric cerebellar tumors. Acad Radiol. 2012;19:794–800. doi: 10.1016/j.acra.2012.03.004. [DOI] [PubMed] [Google Scholar]
- 27.Hirata H, Walczak T, Swartz HM. Electronically tunable surface-coil-type resonator for L-band EPR spectroscopy. J Magn Reson. 2000;142:159–67. doi: 10.1006/jmre.1999.1927. [DOI] [PubMed] [Google Scholar]
- 28.Salikhov I, Hirata H, Walczak T, Swartz HM. An improved external loop resonator for in vivo L-band EPR spectroscopy. J Magn Reson. 2003;164:54–9. doi: 10.1016/s1090-7807(03)00175-7. [DOI] [PubMed] [Google Scholar]
- 29.Demidenko E. Mixed models: Theory and applications. New York: Wiley; 2004. [Google Scholar]
- 30.Demidenko E, Stukel T. Efficient estimation of general mixed effects models. J Stat Plan Infer. 2002;104:197–219. [Google Scholar]
- 31.Montano R, Chung I, Garner KM, Parry D, Eastman A. Preclinical development of the novel Chk1 inhibitor SCH900776 in combination with DNA-damaging agents and antimetabolites. Mol Cancer Ther. 2012;11:427–38. doi: 10.1158/1535-7163.MCT-11-0406. [DOI] [PMC free article] [PubMed] [Google Scholar]
- 32.Omuro A, DeAngelis LM. Glioblastoma and other malignant gliomas: a clinical review. JAMA: the journal of the American Medical Association. 2013;310:1842–50. doi: 10.1001/jama.2013.280319. [DOI] [PubMed] [Google Scholar]
- 33.Khan N, Mupparaju SP, Hou H, Lariviere JP, Demidenko E, Swartz HM, Eastman A. Radiotherapy in conjunction with 7-hydroxystaurosporine: a multimodal approach with tumor pO2 as a potential marker of therapeutic response. Radiat Res. 2009;172:592–7. doi: 10.1667/RR1781.1. [DOI] [PMC free article] [PubMed] [Google Scholar]
- 34.Dunn JF, O’Hara JA, Zaim-Wadghiri Y, Lei H, Meyerand ME, Grinberg OY, Hou H, Hoopes PJ, Demidenko E, Swartz HM. Changes in oxygenation of intracranial tumors with carbogen: a BOLD MRI and EPR oximetry study. J Magn Reson Imaging. 2002;16:511–21. doi: 10.1002/jmri.10192. [DOI] [PubMed] [Google Scholar]
- 35.Jenkinson MD, Du Plessis DG, Walker C, Smith TS. Advanced MRI in the management of adult gliomas. Br J Neurosurg. 2007;21:550–61. doi: 10.1080/02688690701642020. [DOI] [PubMed] [Google Scholar]


