Abstract
To understand the effect of three-dimensional oligonucleotide structure on protein corona formation, we studied the identity and quantity of human serum proteins that bind to spherical nucleic acid (SNA) nanoparticle conjugates. SNAs exhibit cellular uptake properties that are remarkably different from those of linear nucleic acids, which have been related to their interaction with certain classes of proteins. Through a proteomic analysis, this work shows that the protein binding properties of SNAs are sequence-specific and supports the conclusion that the oligonucleotide tertiary structure can significantly alter the chemical composition of the SNA protein corona. This knowledge will impact our understanding of how nucleic acid-based nanostructures, and SNAs in particular, function in complex biological milieu.
Keywords: DNA, G-quadruplexes, nanoparticles, protein corona, proteomics
Spherical nucleic acids (SNAs) are a unique class of nanoparticles (NPs), often consisting of a NP core that is densely functionalized with highly oriented oligonucleotides.[1] The architecture of these structures leads to novel properties that are different from those of their linear counterparts and enables their use in a wide variety of therapeutic and diagnostic applications.[2] Unlike the linear form of DNA, SNAs exhibit high cellular uptake without the use of additional transfection reagents[3] through enhanced binding of class A scavenger receptors on the cell surface.[3c] Additionally, the dense layer of oligonucleotides on SNAs makes them resistant to degradation and provides increased stability compared to the linear form.[4]
These differences between SNAs and linear nucleic acids highlight the need to understand protein–SNA interactions in complex biological media, ranging from in vitro to in vivo systems. Immediately upon intravenous administration, particles encounter a multitude of serum proteins that often form a corona around the nanoparticle and may significantly alter its in vivo behavior.[5] In particular, the binding of opsonin proteins leads to recognition and sequestration by macrophages, which causes decreased blood residence times and lower accumulation in target tissue.[6] Herein, for the first time, we explore the interaction between blood serum and SNAs, focusing on the number and type of proteins that bind to SNAs as a function of DNA sequence. Specifically, we look at the role of G-rich sequences, which are known to facilitate interactions with scavenger receptors, an important component in the mechanism of SNA cellular internalization.[7]
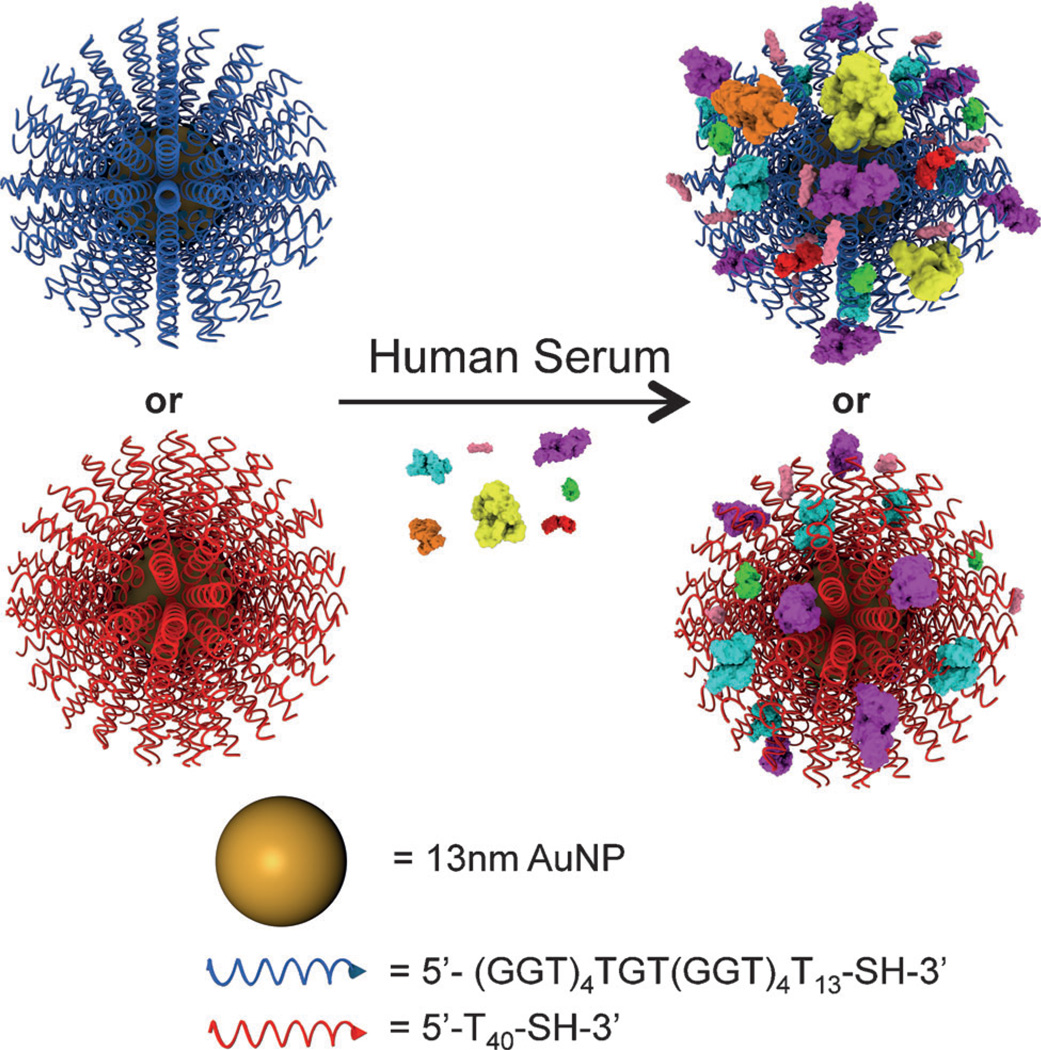
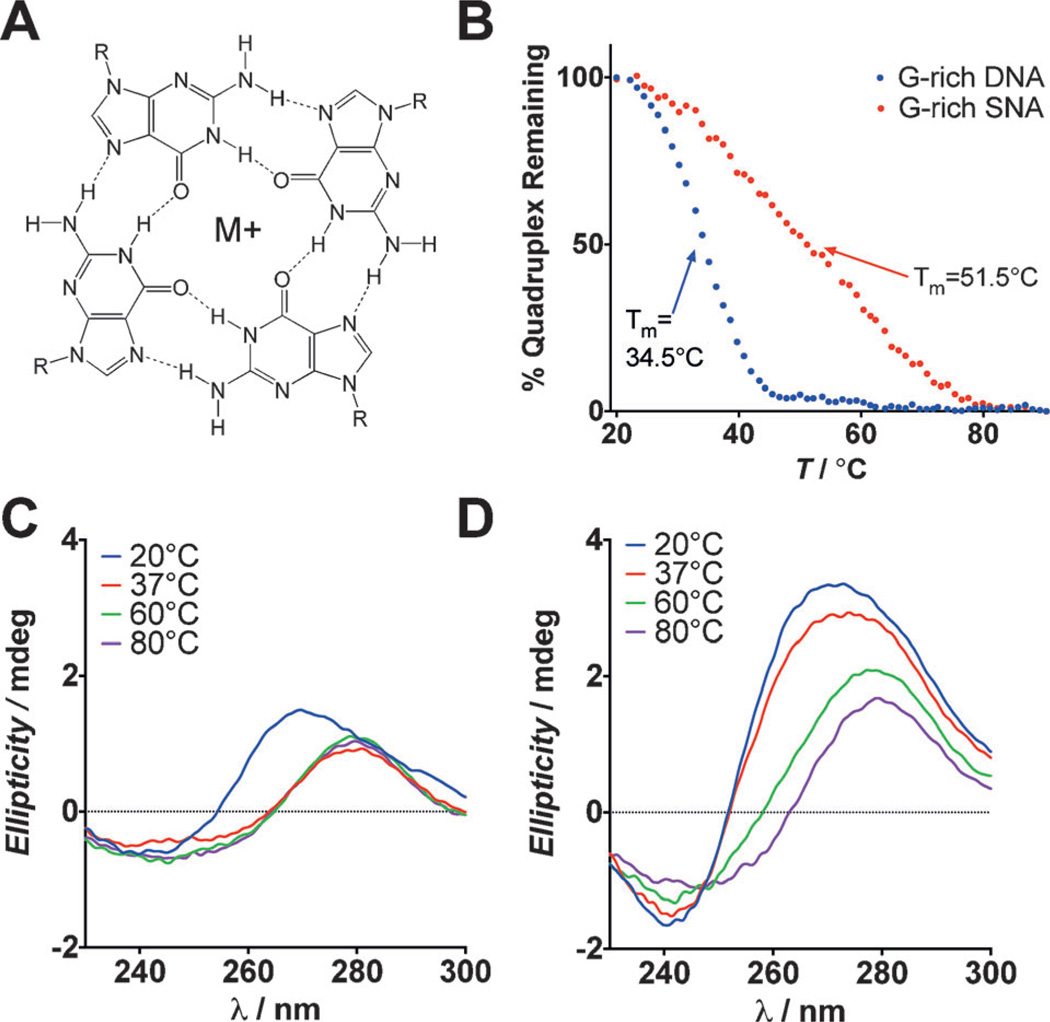
Based on the dense and highly oriented structure of oligonucleotides, we hypothesized that the formation of tertiary DNA structures would be enhanced on the SNA scaffold, and alter its serum protein interactions. In particular, we investigated the effect of the SNA architecture on the formation of G-quadruplexes. We designed gold nanoparticle (AuNP) core SNAs with a 3′ thiol-modified guanine-rich (G-rich) sequence (Scheme 1) to form G-quadruplexes consisting of G-quartets that are hydrogen-bonded through non-Watson Crick base pairing and are stabilized by metal cations (Figure 1A). We first wanted to compare the formation of G-quadruplexes on the SNAwith the linear DNA form using circular dichroism (CD) spectroscopy. Both G-rich SNAs and G-rich DNA exhibit a peak at 265 nm and a trough at 240 nm, which is indicative of parallel G-quadruplex formation.[8] This suggests that G-quadruplexes on SNAs primarily form between neighboring DNA strands on the same AuNP, rather than between DNA strands on multiple AuNPs. The SNA structure supports this, because the DNA on the SNA is highly oriented. Further, G-rich SNAs exhibit a higher degree of ellipticity, suggesting that the G-quadruplex characteristic is enhanced by the SNA scaffold, which brings pre-oriented DNA strands in close proximity (Figure 1).
Scheme 1.
Sequence-specific interactions of SNAs and human serum proteins.
Figure 1.
A) G-quartet structure stabilized by M+ (Na+, K+, etc.) B) CD spectroscopy was used to measure the melting temperature (Tm) of G-quadruplexes formed on the SNA and with linear G-rich DNA. The full CD spectra for C) G-rich DNA and D) G-rich SNAs are shown at increasing temperatures, demonstrating the enhanced thermal stability of G-quadruplexes formed on the SNA scaffold.
The thermal stabilities of G-quadruplexes formed on the SNA and with linear G-rich DNAwere analyzed by variable-temperature CD spectroscopy. Notably, at physiological temperature (37°C), the characteristic parallel G-quadruplex CD spectrum disappears and is replaced by signatures diagnostic of single-stranded DNA. In contrast, the CD spectra of G-rich SNAs maintain the signatures associated with G-quadruplexes at elevated temperatures (Figure 1C and D). To further probe this, the melting temperatures of G-quadruplexes on SNAs and linear DNA were determined by measuring the ellipticity of each sample at 260 nm from 20–90°C and determining the fraction of quadruplex remaining at each temperature. The results indicate a significant shift in the melting temperature from 34.5°C for linear G-rich DNA to 51.5°C for G-rich SNAs (Figure 1B), confirming that the stabilities of G-quadruplexes are enhanced considerably through the SNA structure.
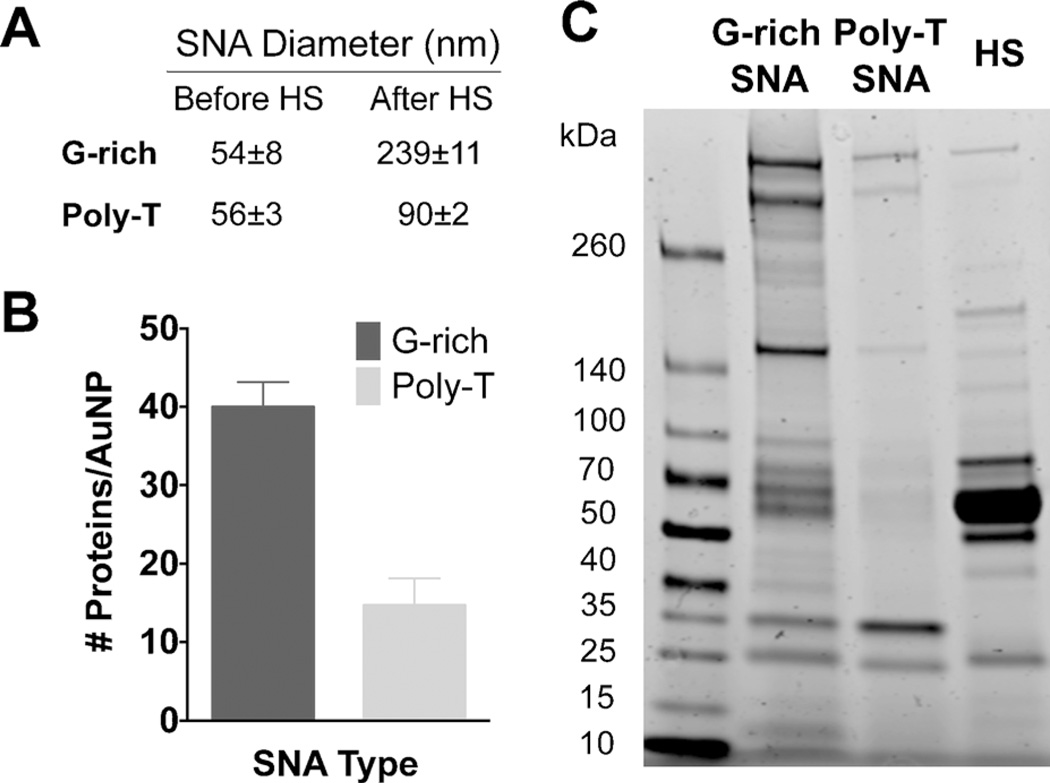
Based on the presence of stable G-quadruplexes on G-rich SNAs, it was hypothesized that G-rich SNAs would exhibit different interactions with proteins upon exposure to serum. Indeed it is known that class A scavenger receptors recognize and bind G-quadruplexes better than single-stranded DNA.[7, 9] As a control, SNAs with a poly-T sequence (T40) were used to probe the effect of the tertiary G-quadruplex structures on protein corona formation. G-rich and poly-T SNAs were incubated in 10% human serum (HS) for 24 h at 37°C. The excess, unbound proteins were removed by washing with PBS. Protein-coated NPs were then characterized using dynamic light scattering (DLS) to investigate the increase in SNA size associated with protein corona formation (Figure 2A). It was found that both G-rich and poly-T SNAs become larger in the presence of HS, corresponding to the presence of adsorbed proteins. Interestingly, the increase in size of G-rich SNAs was larger than the increase in size of poly-T SNAs; 185±19 nm versus 34±5 nm for G-rich and poly-T SNAs, respectively. This is likely due to two factors: first, G-rich SNAs bind more serum proteins (see below); second, the proteins that adsorb onto G-rich SNAs may facilitate clustering through protein–protein interactions.
Figure 2.
Characterization of protein adsorption onto G-rich and poly-T SNAs following incubation in 10% human serum for 24 h at 37°C. A) Size of G-rich and poly-T SNAs before and after protein adsorption as determined by DLS. B) Quantity of protein adsorbed onto G-rich and poly-T SNAs determined using the BCA assay. C) PAGE analysis of proteins adsorbed onto G-rich and poly-T SNAs. Note that the heavy band in HS is serum albumin.
To further explore this, we quantified the amount of proteins adsorbed onto G-rich and poly-T SNAs. This was accomplished by isolating the proteins that were bound to the SNAs following incubation in 10%HS. First, excess, unbound proteins were removed by centrifugation. SNAs (1 pmole) were then treated with 1%sodium dodecyl sulfate (SDS) and heated for 5 min to denature and release the bound proteins. The amount of protein in these samples was then quantified using the bicinchoninic acid (BCA) assay. It was found that 4.4±10−12±3.5 × 10⁻¹³ µg protein/NP adsorbs to G-rich SNAs whereas 1.6±10−12±3.8 × 10⁻¹³ µg protein/NP adsorbs to poly-T SNAs. This corresponds to 40±3 proteins/SNA and 15±3 proteins/SNA that adsorb onto G-rich and poly-T SNAs, respectively, assuming an average protein mass of 66.5 kDa obtained from serum albumin (Figure 2B).
Denaturing polyacrylamide gel electrophoresis (PAGE) analysis was subsequently performed to characterize the protein corona composition of G-rich and poly-T SNAs. Proteins adsorbed onto G-rich and poly-T SNAs were isolated from SNAs (3 pmole) following incubation in 10% HS at 37°C for 24 h. The proteins were then separated by PAGE and imaged using a fluorescent Coomassie protein stain (Figure 2C). Comparison of the band intensities from the resulting image confirms that indeed, more total protein adsorbs onto the surface of G-rich SNAs than onto poly-T SNAs. In addition, comparison of the number of bands of proteins isolated from G-rich SNAs to those isolated from poly-T SNAs indicates that more types of proteins bind G-rich SNAs.
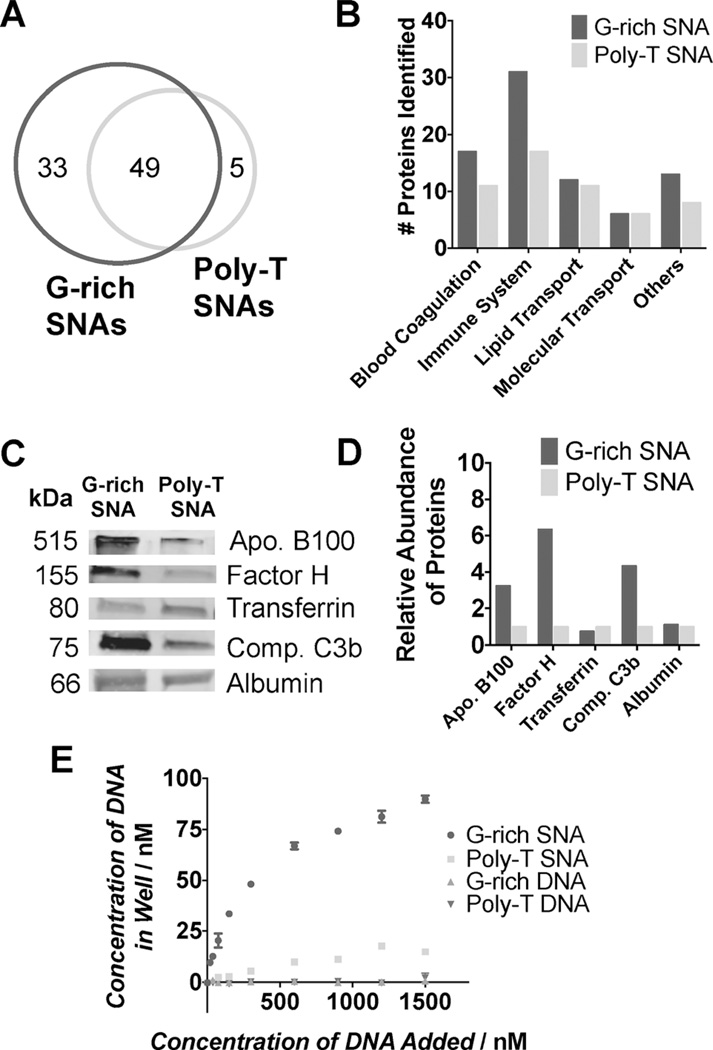
To identify the specific proteins that adsorb onto G-rich and poly-T SNAs, we performed mass spectrometry of trypsin-digested protein samples isolated from G-rich and poly-T SNAs following incubation in 10%HS (Tables S3 and S4). In total, 82 proteins were isolated from G-rich SNAs, whereas 54 were isolated from poly-T SNAs. Of these proteins, 49 were common between both G-rich and poly-T SNAs (Figure 3A). These results confirm that more types of proteins bind G-rich SNAs than poly-T SNAs, which is consistent with PAGE analysis.
Figure 3.
Analysis of the types of proteins that adsorb onto G-rich and poly-T SNAs from 10% human serum after incubation for 24 h at 37°C. A) Venn diagram indicating the number of distinct proteins identified by mass spectrometry that adsorb onto G-rich and poly-T SNAs, categorized by class (B). C and D) Western blotting analysis was used to quantify the relative abundance of proteins bound to G-rich and poly-T SNAs. E) A modified ELISA assay was used to study the affinity of linear and SNA forms of G-rich and poly-T DNA to complement factor H.
The proteins that were identified by mass spectrometry were grouped according to their function: blood coagulation, immune system, lipid transport, molecular transport, and others. This revealed that many of the proteins that bind exclusively to G-rich SNAs are components of the immune response, and that nearly twice as many immune system proteins adsorb onto G-rich SNAs than poly-T SNAs (Figure 3B). These results confirm that the protein corona on G-rich and poly-T SNAs differs not only in quantity but also composition.
To quantify the relative amounts of specific proteins bound to G-rich and poly-T SNAs, Western blotting analysis was performed for five proteins: apolipoprotein B100, factor H, transferrin, complement C3b, and serum albumin (Figure 3C). These proteins were chosen to represent a range of protein classes, as well as some of the most highly abundant serum proteins.[10] The proteins adsorbed onto G-rich and poly-T SNAs (3 pmole) were analyzed, and the relative amount of each protein was quantified using densitometry. Three of the five proteins analyzed adsorb onto G-rich SNAs more than poly-T SNAs (Figure 3D). In particular, about three (apolipoprotein B100), six (complement factor H), and four (complement C3b) times as much protein adsorbs onto G-rich SNAs than onto poly-T SNAs. This result suggests that these proteins may exhibit a higher affinity for G-rich SNAs than poly-T SNAs. To test this, we used a modified ELISA assay[3c] to characterize the binding affinity of G-rich and poly-T sequences in their SNA and linear forms to complement factor H. The results indicate that G-rich SNAs bind significantly more to complement factor H than linear G-rich DNA, which had no appreciable binding (Figure 3E). This may be explained by the enhancement of G-quadruplex formation on the SNA scaffold. In addition, the increased affinity of complement factor Hfor G-rich SNAs compared to their poly-T SNA counterparts correlates with the observed differences in protein corona composition between G-rich and poly-T SNAs.
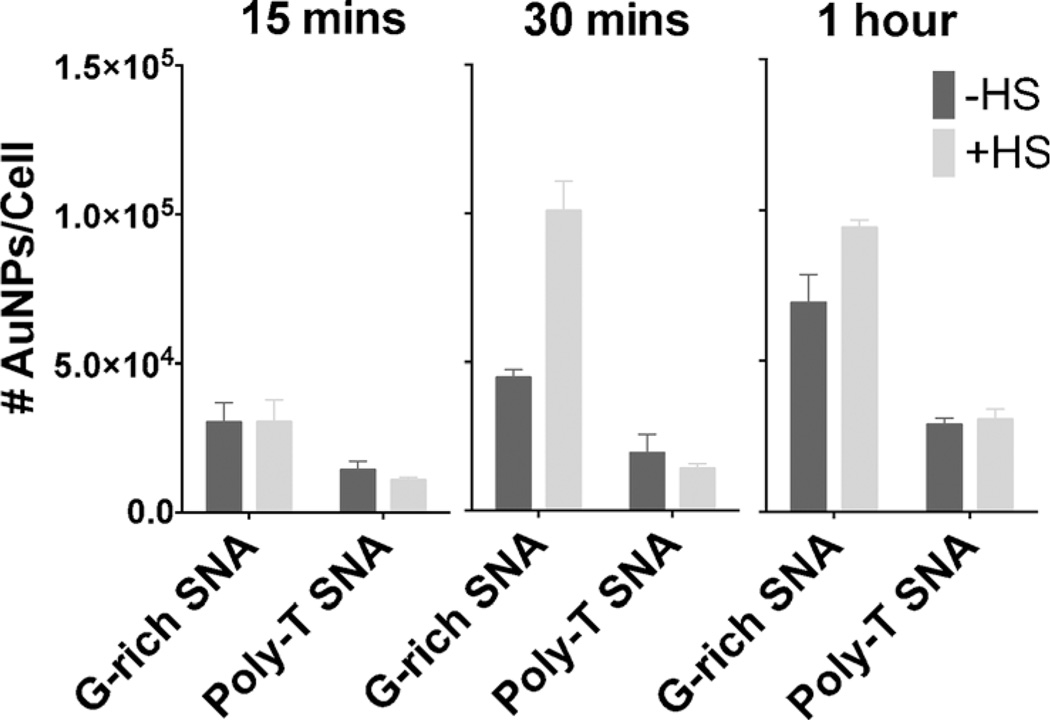
The presence of opsonin proteins in the protein corona is known to facilitate the interaction of nanoparticles with macrophages.[6] One such protein, complement C3, is recognized by complement receptors on the macrophage cell surface, which leads to phagocytosis and subsequent removal from the bloodstream.[11] Based on the observed increase in complement C3b adsorption onto G-rich SNAs, we hypothesized that the uptake of G-rich SNAs by macrophages would be higher than that of poly-T SNAs. To test this, we quantified the uptake of G-rich and poly-T SNAs in a phagocytic macrophage cell line. RAW 264.7 macrophage cells were treated with one of the following conditions: 1 nm G-rich SNA, 1 nm protein-coated G-rich SNAs, 1 nm poly-T SNAs, or 1 nm protein-coated poly-T SNAs for 15 min, 30 min, or 1 h.[13] The cells were counted and digested with strong acid for determination of gold content by inductively coupled plasma mass spectrometry to quantify uptake and association (Figure 4).
Figure 4.
Association of RAW 264.7 mouse macrophages after 15 min, 30 min, and 1 h incubations with G-rich and poly-T SNAs with and without a HS protein corona.
Initially, the association of G-rich SNAs with and without protein coating is about twice as much as the association of poly-T SNAs to macrophages. This is expected, since SNAs are known to be internalized through class A scavenger receptor-mediated endocytosis, and poly-G is a natural ligand for class A scavenger receptors.[9] For all three incubation times, uptake and association of poly-T SNAs to macrophages is not significantly altered by the presence of a protein coating. In contrast, macrophage uptake of protein-coated G-rich SNAs increases after 30 min by more than two-fold compared to uncoated G-rich SNAs. We suspect that the difference in uptake is due to the higher amount of opsonin protein complement C3b present on G-rich SNAs, which flags it for phagocytosis (Figure 3C).[11] This effect is lessened after a 1 h incubation with macrophages, suggesting that G-rich SNAs with a HS protein corona may saturate cell surface receptors after a 30 min incubation. This is consistent with previous work that reported typical Langmuir binding isotherms of SNA uptake, indicating that the mechanism is limited by receptor–ligand interactions.[3c] The increase in cellular uptake and association of G-rich SNAs suggests that they are recognized by macrophages to a greater extent than poly-T SNAs, which may cause them to be rapidly cleared from the blood stream in vivo.[12]
In conclusion, we have investigated the role of sequence on the protein binding properties of SNAs. In particular, we have shown that the SNA architecture enhances the formation of G-quadruplexes compared to a linear counterpart, which changes the types of proteins it can interact with in serum. This protein corona alters SNAuptake in a phagocytic macrophage cell line, suggesting that G-rich and poly-T SNAs may exhibit altered biodistribution and pharmacokinetic profiles in vivo. Specifically, this work contributes to the design rules for synthesizing therapeutically active SNAs and our understanding of how they will interact with proteins, and function in complex biological media. Most notably, whereas G-rich sequences may lead to greater cellular internalization, they also lead to greater macrophage uptake, which could cause increased clearance from the blood stream, a consideration that must be taken into account in all subsequent in vivo studies involving SNAs.
Supplementary Material
Footnotes
This research was supported by the Center for Cancer Nanotechnology Excellence (CCNE) initiative of the National Institutes of Health (NIH) under award number U54 CA151880 and the Defense Advanced Research Projects Agency under grant number HR0011-13-2-0018. The content of the information does not necessarily reflect the position or the policy of the Government, and no official endorsement should be inferred. A.B.C. and C.M.G. were both supported by the Department of Defense (DoD) through the National Defense Science & Engineering Graduate Fellowship (NDSEG) Program. Metal analysis was performed at the Northwestern University Quantitative Bioelemental Imaging Center generously supported by the NASA Ames Research Center NNA06CB93G. Circular dichroism measurements were supported by the Northwestern University Keck Biophysics Facility and a Cancer Center Support Grant (NCI CA060553). The authors acknowledge D. Nanavati and the Northwestern University proteomics core for help with analysis and proteomics data.
Supporting information for this article is available on the WWW under http://dx.doi.org/10.1002/anie.201409211.
Contributor Information
Alyssa B. Chinen, Department of Chemistry, Northwestern University, Evanston, IL 60201 (USA).
Chenxia M. Guan, Department of Chemical Engineering, Northwestern University, Evanston, IL 60201 (USA).
Chad A. Mirkin, Email: chadnano@northwestern.edu, Department of Chemistry, Northwestern University, Evanston, IL 60201 (USA).
References
- 1.a) Mirkin CA, Letsinger RL, Mucic RC, Storhoff JJ. Nature. 1996;382:607–609. doi: 10.1038/382607a0. [DOI] [PubMed] [Google Scholar]; b) Rosi NL, Giljohann DA, Thaxton CS, Lytton-Jean AK, Han MS, Mirkin CA. Science. 2006;312:1027–1030. doi: 10.1126/science.1125559. [DOI] [PubMed] [Google Scholar]
- 2.a) Cutler JI, Auyeung E, Mirkin CA. J. Am. Chem. Soc. 2012;134:1376–1391. doi: 10.1021/ja209351u. [DOI] [PubMed] [Google Scholar]; b) Giljohann DA, Seferos DS, Daniel WL, Massich MD, Patel PC, Mirkin CA. Angew. Chem. Int. Ed. 2010;49:3280–3294. doi: 10.1002/anie.200904359. ; Angew. Chem. 2010, 122, 3352 – 3366; [DOI] [PMC free article] [PubMed] [Google Scholar]; c) Zheng D, Giljohann DA, Chen DL, Massich MD, Wang XQ, Iordanov H, Mirkin CA, Paller AS. Proc. Natl. Acad. Sci. USA. 2012;109:11975–11980. doi: 10.1073/pnas.1118425109. [DOI] [PMC free article] [PubMed] [Google Scholar]; d) Jensen SA, Day ES, Ko CH, Hurley LA, Luciano JP, Kouri FM, Merkel TJ, Luthi AJ, Patel PC, Cutler JI, Daniel WL, Scott AW, Rotz MW, Meade TJ, Giljohann DA, Mirkin CA, Stegh AH. Sci. Transl. Med. 2013;5:209ra152. doi: 10.1126/scitranslmed.3006839. [DOI] [PMC free article] [PubMed] [Google Scholar]
- 3.a) Giljohann DA, Seferos DS, Patel PC, Millstone JE, Rosi NL, Mirkin CA. Nano Lett. 2007;7:3818–3821. doi: 10.1021/nl072471q. [DOI] [PMC free article] [PubMed] [Google Scholar]; b) Patel PC, Giljohann DA, Daniel WL, Zheng D, Prigodich AE, Mirkin CA. Bioconjugate Chem. 2010;21:2250–2256. doi: 10.1021/bc1002423. [DOI] [PMC free article] [PubMed] [Google Scholar]; c) Choi CH, Hao L, Narayan SP, Auyeung E, Mirkin CA. Proc. Natl. Acad. Sci. USA. 2013;110:7625–7630. doi: 10.1073/pnas.1305804110. [DOI] [PMC free article] [PubMed] [Google Scholar]
- 4.Seferos DS, Prigodich AE, Giljohann DA, Patel PC, Mirkin CA. Nano Lett. 2009;9:308–311. doi: 10.1021/nl802958f. [DOI] [PMC free article] [PubMed] [Google Scholar]
- 5.a) Cedervall T, Lynch I, Lindman S, Berggard T, Thulin E, Nilsson H, Dawson KA, Linse S. Proc. Natl. Acad. Sci. USA. 2007;104:2050–2055. doi: 10.1073/pnas.0608582104. [DOI] [PMC free article] [PubMed] [Google Scholar]; b) Lundqvist M, Stigler J, Elia G, Lynch I, Cedervall T, Dawson KA. Proc. Natl. Acad. Sci. USA. 2008;105:14265–14270. doi: 10.1073/pnas.0805135105. [DOI] [PMC free article] [PubMed] [Google Scholar]; c) Walkey CD, Olsen JB, Guo H, Emili A, Chan WC. J. Am. Chem. Soc. 2012;134:2139–2147. doi: 10.1021/ja2084338. [DOI] [PubMed] [Google Scholar]; d) Walkey CD, Olsen JB, Song F, Liu R, Guo H, Olsen DW, Cohen Y, Emili A, Chan WC. Acs Nano. 2014;8:2439–2455. doi: 10.1021/nn406018q. [DOI] [PubMed] [Google Scholar]; e) Cedervall T, Lynch I, Foy M, Berggad T, Donnelly SC, Cagney G, Linse S, Dawson KA. Angew. Chem. Int. Ed. 2007;46:5754–5756. doi: 10.1002/anie.200700465. Angew. Chem.2007, 119, 5856–5858; [DOI] [PubMed] [Google Scholar]; f) Lundqvist M, Stigler J, Cedervall T, Berggard T, Flanagan MB, Lynch I, Elia G, Dawson K. ACS Nano. 2011;5:7503–7509. doi: 10.1021/nn202458g. [DOI] [PubMed] [Google Scholar]
- 6.a) Aggarwal P, Hall JB, McLeland CB, Dobrovolskaia MA, McNeil SE. Adv. Drug Delivery Rev. 2009;61:428–437. doi: 10.1016/j.addr.2009.03.009. [DOI] [PMC free article] [PubMed] [Google Scholar]; b) Storm G, Belliot SO, Daemen T, Lasic DD. Adv. Drug Delivery Rev. 1995;17:31–48. [Google Scholar]; c) van Furth R, Cohn ZA, Hirsch JG, Humphrey JH, Spector WG, Langevoort HL. Bull.W. H. O. 1972;46:845–852. [PMC free article] [PubMed] [Google Scholar]; d) Walkey CD, Chan WC. Chem. Soc. Rev. 2012;41:2780–2799. doi: 10.1039/c1cs15233e. [DOI] [PubMed] [Google Scholar]
- 7.Pearson AM, Rich A, Krieger M. J. Biol. Chem. 1993;268:3546–3554. [PubMed] [Google Scholar]
- 8.Balagurumoorthy P, Brahmachari SK, Mohanty D, Bansal M, Sasisekharan V. Nucleic Acids Res. 1992;20:4061–4067. doi: 10.1093/nar/20.15.4061. [DOI] [PMC free article] [PubMed] [Google Scholar]
- 9.Platt N, Gordon S. J. Clin. Invest. 2001;108:649–654. doi: 10.1172/JCI13903. [DOI] [PMC free article] [PubMed] [Google Scholar]
- 10.Pieper R, Gatlin CL, Makusky AJ, Russo PS, Schatz CR, Miller SS, Su Q, McGrath AM, Estock MA, Parmar PP, Zhao M, Huang ST, Zhou J, Wang F, Esquer-Blasco R, Anderson NL, Taylor J, Steiner S. Proteomics. 2003;3:1345–1364. doi: 10.1002/pmic.200300449. [DOI] [PubMed] [Google Scholar]
- 11.Nagayama S, Ogawara K, Fukuoka Y, Higaki K, Kimura T. Int. J. Pharm. 2007;342:215–221. doi: 10.1016/j.ijpharm.2007.04.036. [DOI] [PubMed] [Google Scholar]
- 12.a) Moghimi SM, Patel HM. Adv. Drug Delivery Rev. 1998;32:45–60. doi: 10.1016/s0169-409x(97)00131-2. [DOI] [PubMed] [Google Scholar]; b) Owens III DE, Peppas NA. Int. J. Pharm. 2006;307:93–102. doi: 10.1016/j.ijpharm.2005.10.010. [DOI] [PubMed] [Google Scholar]
- 13.Note that cellular uptake of SNAs does not substantially increase after incubations longer than 1 h, and that this was further explored in Ref. [3c].
Associated Data
This section collects any data citations, data availability statements, or supplementary materials included in this article.


