Abstract
Inhibitors of HIV-1 protease (HIV-1-pr) generally only bind to the active site of the protease. However, for some mutants such as V32I and M46L the TMC114 can bind not only to the active cavity also to the groove of the flexible flaps. Although the second binding site suggests the higher efficiency of the drug against HIV-1-pr, the drug resistance in HIV-1-pr due to mutations cannot be ignored, which prompts us to investigate the molecular mechanisms of drug resistance and behavior of double bound TMC114 to HIV-1-pr. The conformational dynamics of HIV-1-pr and the binding of TMC114 to the WT, V32I and M46L mutants were investigated with all-atom molecular dynamic (MD) simulation. The 20 ns MD simulation shows many fascinating effects of the inhibitor binding to the WT and mutant proteases. MM-PBSA calculations explain the binding free energies unfavorable for the M46L and V32I mutants as compared to the WT. For the single binding the less binding affinity can be attributed to the entropic loss for both V32I-1T and M46L-1T. Although the second binding of TMC114 with flap does increase binding energy for the mutants (V32I-2T and M46L-2T), the considerable entropy loss results in the lower binding Gibbs free energies. Thus, binding of TMC114 in the flap region doesn't help much in the total gain in binding affinity of the system, which was verified from this study and thereby validating experiments.
Keywords: HIV-1 protease, TMC114, Drug resistance, double TMC114 bound complex, MM-PBSA, Molecular dynamics simulation
1. Introduction
HIV-1 protease (HIV-1-pr), one of the most essential enzymes of human immunodeficiency virus (HIV) acts at the late stage of HIV infection producing mature infectious virions.[1] This makes the HIV-1-pr one of the key targets for anti-HIV drug discovery. Although a number of drugs/inhibitors are in use to put a stop to the HIV-1-pr activity, success has been limited mainly due to the protein's drug induced mutations. Hence, scientists need to sweat a lot in order to explore the molecular details of drug resistance mechanism and design of more stable and effective HIV-1-pr inhibitors.
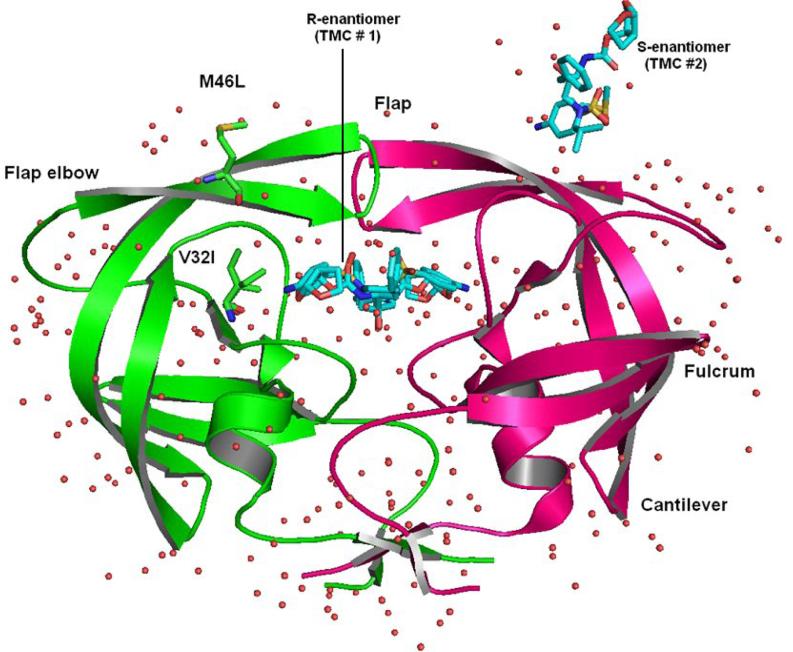
HIV-1-pr comes under the family of aspartyl proteases, which have the catalytic aspartate in the active site region. The structure of the HIV-1-pr (as shown in Figure 1) is C2 symmetric and is homodimeric with 99 residues in each monomer. The catalytic aspartate is accompanied by other two residues namely Threonine and Glycine to form the robust catalytic triad (Asp25-Thr26-Gly27) in both chains. The active site of the protein is crowned by two identical Glycine rich flexible flaps that control access of the substrate/inhibitor to the active site.
Figure 1.
Structure of HIV-1-pr complexed with TMC114. HIV-1-pr is shown in magenta and green ribbons for chain-A and chain-B respectively. The sites of mutation are indicated by ball and stick representation for V32I and M46L. The R-enantiomeric TMC114 (TMC # 1) is bound in the active site. Whereas the S- enantiomeric TMC114 (TMC # 2) is bound to the surface of one of the flexible flaps. Important regions of the HIV-1-pr like flap, flap elbow, fulcrum and cantilever are also shown. Crystallographic water molecules are shown as red tiny spheres around the protein.
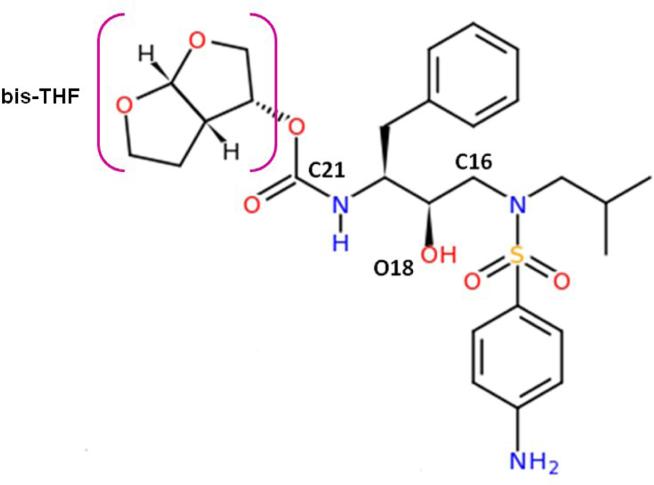
TMC114 (darunavir) is an enormously potent HIV-1-pr inhibitor for treatment of drug resistant HIV strains including many subtypes.[2] It is a non-peptidic analog with a chemical structure as shown in Figure 2. By the presence of the terminal bis-tetrahydrofuran (bis-THF) moiety, it somewhat differs from its chemical analog, amprenavir. TMC114 was designed to form robust interactions with the HIV-1-pr main chain atoms. Stereochemistry of the bis-THF moiety of this inhibitor has revealed the increased polar interactions with the main chain atoms. Studies have been carried out to explain the drug resistance behavior of HIV-1-pr mutants over TMC114. In a recent study, Kar et al. explored the MM-PBSA method to investigate the effectiveness of the HIV-1-pr inhibitors, Darunavir, GRL-06579A, and GRL-98065 against HIV-2 and HIV-1 proteases. They found that the binding affinity for HIV-2-pr decreases as compared to HIV-1-pr in the order of GRL-06579A > darunavir > GRL-98065, and the decrease is mainly due to the increase in the energetic penalty from the desolvation of polar groups or a decrease in the electrostatic interactions between the inhibitor and the protein.[3] Kovalevsk et al. and Tie et al. utilized the crystallographic study to analyze the effectiveness of TMC114 to HIV-1-pr, with highly drug resistant mutants D30N, I50V, V82A, I84V, and L90M. It was found that, the mutations D30N and I50V results in the drug resistance to TMC114; however the changes due to mutations V82A, I84V and L90M are well adapted by TMC114.[4-5] Chen et al. performed MD simulation studies combined with MM-PBSA to investigate the binding energies of TMC114 to D30N and I50V mutants. They found that, loss of H-bonds between Asp30 and TMC114 drives the drug resistance in D30N, while for I50V it is the increased polar solvation energies between TMC114 and two residues Asp30’ and Val50’.[6] Our previous studies on binding Gibbs free energies for WT, I50V single mutant and I50L/A71V double mutant showed that I50V decreases the binding affinity for TMC114, while the double mutant I50L/A71V increases the binding affinity and may be well adapted to accommodate the TMC114 in the active site.[7] The resistance of inhibitor amprenavir, which is an analog of TMC114 to mutant V32I, I50V and I84V with an increase in the energetic contribution from the van der Waals interactions, was also explained in another study by Kar et al. An increased free energy for the polar solvation contributes to the drug resistance for the V32I mutant to amprenavir.[8] A quite few other studies also dealt with the ligand binding interactions and multi-drug resistance in HIV-1-pr using the method of MM-PBSA. [9-21]
Figure 2.
Molecular structure of the inhibitor TMC114. The moiety bis-THF is labeled with a square bracket in color pink.
Currently more than 50 mutations at near about 30 different codon positions of HIV-1-pr have been identified.[22] The population of mutant strains of HIV-1-pr increases with the intake of drugs. These mutations in the HIV-1-pr can be classified as two types. One is near the active site and the other is distant from the active site. The former mutations (primary mutations) may change the direct interaction between the ligand and the protein. The reduction of binding affinity of the ligands due to the mutations on non-active sites (secondary) is likely related to the change in the conformational dynamics of the protein (indirect effect). Some mutations may have both direct and indirect effects.[7, 23] The flap dynamics of HIV-1-pr is known to be vital for ligand binding and estimation of cavity size, which changes with several mutations leading to numerous drug resistant mutants of the protease. Thus, understanding the conformational dynamics including flap dynamics is an essential step in designing new potent anti-HIV-1-pr drugs with minimal resistance. Mutations V32I and M46L are considered as two of the most multi-drug-resistant mutations [24] of the HIV-1-pr drug resistance to inhibitors in clinical use. V32I mutation is located in the active site region, which can directly contribute to the drug resistance by unfavorable interactions with an inhibitor because isoleucine is larger than valine.[24-25] However, M46L mutation in the flexible flap does not directly contact with an inhibitor bound in the active site cleft, while the main chain atoms of Met46 may form H-bonds with substrate analogs.[26] Therefore M46L mutation can affect the binding affinity indirectly either by reducing the hydrophobic interactions or by strengthening interactions with a substrate.
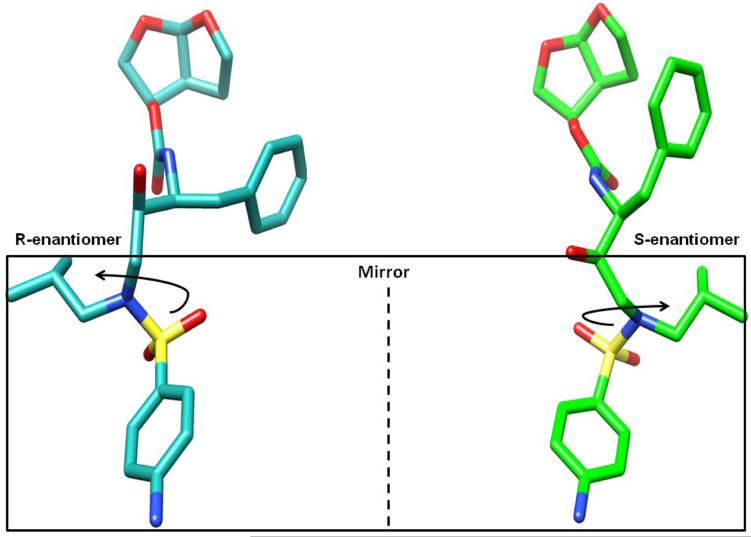
Inhibitors usually bind to the active site of the protease dimer. However, as shown in Figure 1, TMC114 can bind at two distinct sites for some HIV-1-pr mutants, one in the active site cavity and the second on the groove of one of the flexible flaps.[4, 27] Surprisingly, TMC114 binds at these two sites simultaneously in two diastereomers (R-enantiomer binds to active site cavity; S-enantiomer binds to flap surface region) related by the inversion of the sulfonamide nitrogen. The two enantiomers of the TMC114 are shown in the Figure 3. Existence of the second binding site, suggests a mechanism for the higher efficiency of TMC114 against the drug-resistant isolates of HIV-1-pr and the ultimate design for the new effective inhibitors.[27] Nevertheless, even so the drug resistance in HIV-1-pr due to mutations cannot be ignored, which prompts us to investigate the molecular mechanisms of drug resistance and behavior of double bound TMC114 to the HIV-1-pr structure as compared to the single bound TMC114. This may provide a different target for the design of novel effective inhibitors that bind to the second site on the flap region.
Figure 3.
Structures of the two enantiomers of TMC114 (R-enantiomer: bound in the active site cavity) and (S-enantiomer: bound in the flap region). The moieties in the box are related by reflection in a mirror and can be obtained by inversion of the sulfonamide nitrogen.
In the current study, to explore the drug resistance behavior of the two mutants V32I and M46L HIV-1-pr to the inhibitor TMC114 and to differentiate the binding affinities of the double TMC114 bound complex (2T) from that of single TMC114 bound complex (1T), MD simulations have been performed for five different inhibitor bound complexes: WT-1T, V32I-1T and M46L-1T HIV-1-pr as well as for V32I-2T and M46L-2T HIV-1-pr. The primary goal for the MD simulation was to check the effects of mutations on both single and double bound TMC114/HIV-1-pr complexes. Secondly, was to discriminate the binding affinity of TMC114, when it was bound to the flap and active site simultaneously with that to bind alone to the active site. For both the single and double TMC114 bound complex, the analysis designates the resistance behavior of both the mutants. The average flap-flap distance and flap tip - active site distances are believed to be longer for the M46L-2T HIV-1-pr complex as compare to the WT-1T and V32I-2T complexes suggesting a higher mobility in M46L-2T, possibly making the active site volume larger. Flap RMSD analysis suggests that, binding of TMC114 on the groove of flap-B of the mutant structures, has not much impact on the flap dynamics as a whole.
To quantitatively define the influence of the double and single bound TMC114 on the two mutants, the MM-PBSA method was then practiced to calculate the absolute binding free energies, which were further decomposed to a per-residue basis. The present study gives a clue that, both the single and double bound form of the protease mutants shows drug resistance to inhibitor TMC114. Also, from this detailed study it was found that, binding of the inhibitor TMC114 on the flap region has not much influence on the total gain in the binding affinity. This finding correlates well with the experimental verification by the Weber group.
2. Materials and Methods
2.1. System Setups
The crystal structures of the wild-type (WT) and mutant HIV-1-pr complexed with TMC114 were obtained from the Protein Date Bank (PDB). The PDB entries are: 1T3R [28] for the WT, 2HS1 [27] [4] for the V32I mutant and 2HS2 [27] [4] for the M46L mutant structures. There are alternate conformations in 2HS1 and 2HS2: conformation A and B, owing to C2 symmetry of HIV-1-pr, only conformation A was selected for the starting model, where two TMC114 ligands bound to the active site and the flap region, referred to a double bound complex (2T). However, the single bound TMC114 to the active site (1T) complex was also created by simply removing the ligand from the flap region. Due to the importance of the protonation state of Asp25/Asp25′ in the HIV-1-pr, only the monoprotonated HIV-1-pr was considered [29-30] and a proton was added to the oxygen atom of OD2 in Asp25 in chain B. Charges of TMC114 were calculated using the Restrained Electrostatic Potential (RESP) procedure [31] at the Hartee-Fock level with 6-31G* basis set after minimizing the molecule at the AM1 semi-empirical level[32]. GAFF force field[33] parameters and the RESP partial charges are assigned for TMC114 using the Antechamber module in AMBER11 package. [34] All missing hydrogen atoms were added using the LEaP module. The ff99SB [35] force field for the protease with TIP3P [36] water models was used for all the simulations. The system was solvated with the TIP3P waters in the periodic box of size 92.1 × 92.1 × 92.1 Å3 containing more than 10,000 water molecules. A cutoff of 10 Å was used along the three axes to discard any water molecule if it is farther than the cutoff from any solute molecule. An applicable number of Cl- counter ions were added to neutralize the net positive charge on the system. The default cutoff of 8.0 Å was used for Lennard-Jones interactions, and the long-range electrostatic interactions were calculated with the particle mesh ewald (PME) method. [37] Constant temperature and pressure conditions in the simulation were achieved by coupling the system to a Berendsen's thermostat and barostat.[38] The SHAKE [39] algorithm was utilized to constrain all bonds involving hydrogens.
2.2. Molecular dynamics simulations
The system was minimized in four phases. In the first phase, the system was minimized giving restraints (30kcal/mol/Å2) to all heavy atoms of protein and ligand for 10000 steps with subsequent second phase minimization of the all backbone atoms and C-alpha atoms, respectively, for 10000 steps each. Then the system was heated to 300K with a gap of 50K over 10 ps with a 1 fs time step. The protein atoms were restrained with force constant of 30 kcal/mol/Å2. In subsequent minimization of third phase, the force constant was reduced by 10 kcal/mol/ Å2 in each step to reach the unrestrained structure in three steps of 10000 steps each. Finally the whole system was minimized again for 10000 steps keeping all atoms free at the NVT ensemble. The system was equilibrated at the NVT ensemble and then switched over to the NPT ensemble equilibrating without any restraints for another 120 ps. The system was equilibrated in total of 220 ps in all the systems. The convergence of energies, temperature, pressure and global RMSD was used to verify the stability of the systems. All the apo and complexed trajectories were run for 20 ns. The time step for MD production run was 1 fs. The long 20 ns trajectories were used to calculate the average structure for all the systems.
2.3. MM-PBSA calculations
In the present work, the binding free energy was calculated using the MM-PBSA method and entropies with the nmode module in AMBER 11 package. For each complex, a total number of 50 snapshots were taken from the last 2 ns on the MD trajectory with an interval of 40 ps. The MM-PBSA method can be summarized as:
| (1) |
Where ΔG is the binding free energy in solution that consists of the molecular mechanics energy in the gas phase (ΔEMM), the solvation free energy (ΔGsol) and the conformational entropy effect due to binding (−TΔS).
| (2) |
Where ΔEvdw and ΔEele correspond to the van der Waals and electrostatic interactions in gas phase, respectively.
| (3) |
Where ΔGpb and ΔGnp are the polar and non-polar contributions to the solvation free energy, respectively. The ΔGsol is calculated with the PBSA module, where the dielectric constant is set to 1 inside the solute and 80.0 in the solvent. The nonpolar contribution of the solvation free energy is calculated as a function of the solvent-accessible surface area (SAS), as follows:
| (4) |
Where, SAS was estimated using the MSMS program, with a solvent probe radius of 1.4 Å. The values of empirical constants γ and β were set to 0.00542 kcal/(molÅ2) and 0.92 kcal/mol, respectively.
The experimental binding energies are calculated from published inhibition constants Ki by the following equation:
| (5) |
where inhibition constants for the mutants are obtained from Kovalevsky et al, and for WT from Wang et al [27, 40]
The contributions of entropy (−TΔS) to binding free energy arise from changes of the translational, rotational and vibrational degrees of freedom. Entropies are generally calculated using classical statistical thermodynamics and normal mode analysis. Due to extremely time consuming for entropy calculations, we applied only 50 snapshots taken at an interval of 200 ps from the final 10ns of the MD simulation. Each snapshot was minimized with a distance dependant dielectric function 4Rij (the distance between two atoms) until the root-mean-square of the energy gradient was lower than 10−4 kcal mol−1 Å−2.
2.4. Residue-inhibitor interaction decomposition
On account of the vast demand of computational resources for PB calculations, the interaction between TMC114 and each residue of HIV-1-pr was computed using the MM-GBSA decomposition process[42] applied in the mm_pbsa module in AMBER11. The binding interaction of each inhibitor-residue pair includes four terms: van der Waals (ΔEvdw) contribution, electrostatic (ΔEele) contribution, polar solvation (ΔGpb) contribution, and non-polar solvation (ΔGnp) contribution.
| (6) |
The polar contribution (ΔGpb) to solvation energy was calculated by using the GB (Generalized Born) module and the parameters for the GB calculation were developed by Onufriev et al. [43]. All energy components in Equation (6) were calculated using 50 snapshots from the last 2.0 ns of the MD simulation.
Graphic visualization and presentation of protein structures were done using PYMOL [www.pymol.org] and Maestro (Schrodinger LLC.) [www.schrodinger.com].
3. Results and Discussions
3.1. Stability of trajectories from RMSD
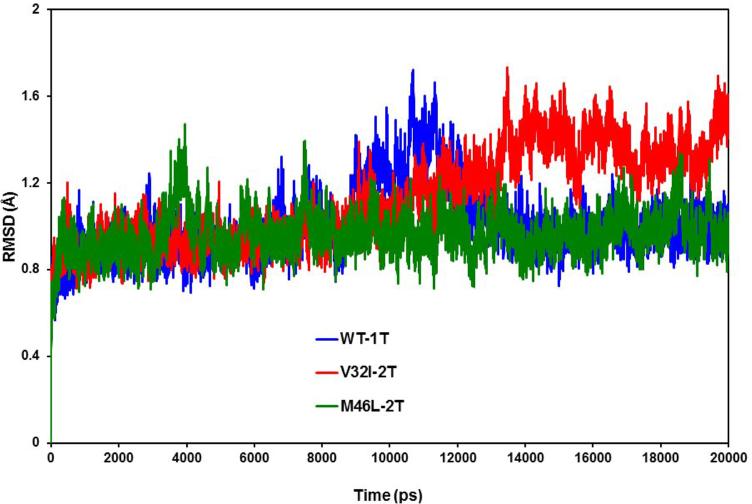
The effect of mutations on the conformational stability of the HIV-1-pr/TMC114 complexes with both TMC114 bound (2T) was explored. RMSD values for the HIV-1-pr Cα atoms during the 20 ns production phase relative to the initial structure were calculated and plotted in Figure 4. The RMSD plots indicate that the conformations of the WT-1T, V32I-2T and M46L-2T mutant HIV-1-pr/TMC114 complexes are in good equilibrium. The entire three HIV-1-pr/TMC114 complex trajectories go parallel to each other until 8-9 ns after the WT-1T has a brief fluctuation for around 3-4 ns going up to a maximum of 1.70 Å. The trajectory again continues parallel to the mutant M46L-2T. However, apart from that, mutant V32I-2T has higher values from around 10ns onwards. According to the RMSD average values of the three complexes, V32I-2T complex has a higher mean (1.12 Å) than the WT (1.01 Å) and M46L-2T mutant (0.96 Å), with a respective standard deviation (SD) of 0.21, 0.16 and 0. 09 Å. The result signifies that RMSD of all three complexes were within values around 0.7 to 1.7 Å ensuring stable trajectories.
Figure 4.
Root-mean-square-displacement (RMSD) plot for backbone Cα atoms relative to their initial minimized complex structures as a function of time. The plot shows the RMSD of Cα atoms for the singly bound TMC114 to the active site region of the HIV-1 protease (WT-1T) and doubly bound TMC114 to the active site and flap region of HIV-1 protease mutants (V32I-2T and M46L-2T).
RMSD values for the Cα atoms of the single bound (WT-1T, V32I-1T and M46L-1T) HIV-1-pr/TMC114 complexes, looks more stable than double bound (2T) complexes, as shown in supplementary Figure S1. The RMSD plots indicate that the conformations of the WT-1T, V32I-1T and M46L-1T mutant HIV-pr/TMC114 complexes are in good equilibrium. The entire three complex trajectories also go parallel to each other. V32I mutant complex again has a slightly higher mean (1.14 Å) than the WT (1.00 Å) and M46L mutant (1.03 Å). The above results signify that RMSD of the 2T complexes do not fluctuate more significantly than 1T in spite of the presence of an extra TMC114 bound on the flap region, where bis-THF moiety moves freely interacting with waters and ions.
3.2 Comparing the proteins from RMSF: WT vs. Mutant
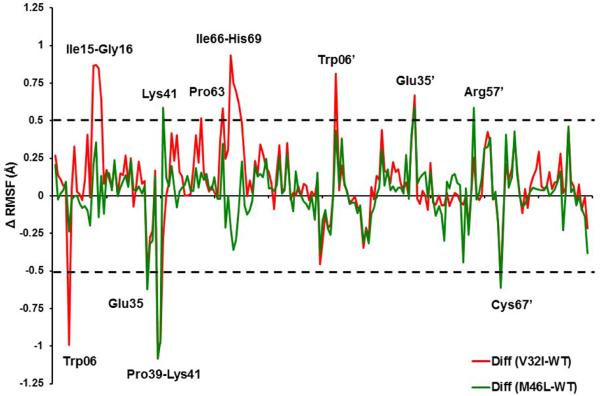
In order to analyze the detailed residual atomic fluctuations, the root mean square fluctuations (RMSF) of the alpha C atoms have been performed for the HIV-1-pr structures. The average RMSF values per-residue in the flap and active-site binding region for the WT-1T, V32I-2T and M46L-2T HIV-1-pr/TMC114 complexes are 0.89, 1.07 and 0.98 Å, respectively. Moreover, for the whole protein the average residual atomic fluctuation also seems to be higher in case of V32I mutant (1.00Å) than WT (0.91 Å) and M46L (0.92 Å). Regions near the catalytic triad (Asp25-Gly26-Thr27 and Asp25’-Gly26’-Thr27’) in both the chains show a rigid behavior, which is in accordance with the experimental[44] and theoretical[12, 45] studies. Difference in the RMSF values of the protein in its TMC114 bound form is shown in Figure 5. Residues with absolute difference more than 0.50 Å were considered as the highly fluctuating residues and were labeled by two cutoff dashed lines as shown in the figure. There are significant differences for the residues like Trp6, Ile15-Gly16 and Glu35-Lys41 (fulcrum and flap elbow of chain-A), Pro63-His69 (Cantilever of chain-A) Trp6’, Glu35’, Arg57’ (Flap elbow and flap of chain-B) and Ala67’ (cantilever of chain-B). The RMSF indicates that the two mutations cause more conformational changes of the HIV-1-pr near the flap elbow, fulcrum and cantilever regions, than other regions of the protease.
Figure 5.
Difference of RMSF values from molecular dynamics (MD) simulation for WT and mutant HIV-1-pr simulations (mutant RMSF – WT RMSF). The residues with absolute difference larger than 0.50 Å are labeled by two cutoff dashed black lines.
3.3. Local Fluctuations for double bound (2T) structures
We have then examined several key local fluctuations of the double bound complexes (2T) of TMC114 with WT and mutant HIV-1-prs. These include (1) RMSDs of the flap regions, distances of Asp25(25’)–Ile50(50’) and Ile50–Ile50’, and TriCa angle in flap region, which indicate flap dynamics and flap-active site movements.
3.3.1. RMSD of the Flaps
The RMSD of the flap residues (43-58 and 43’-58’) in both the chains-A and B in the double bound complexes (V32I-2T and M46L-2T) and compared to the RMSD of the WT-1T flaps was illustrated in Figure S13. The maximum range of RMSDs for the flaps (A+B), is 1.5Å, while most of the values ranges in between 0.2 to 1.3Å with substantial overlap among the three complexes. The average flap RMSD of M46L (0.58 Å) mutant was found to be little less than WT (0.73 Å) and V32I (0.71 Å) with respective SD of 0.12, 0.12 and 0.13 Å. Additionally, in order to differentiate the impact of TMC114 binding on chain-B from that of ligand free chain-A, we computed the individual RMSD for the chains of each complexes and shown in the Figure S13B and S13C. For flap-A, the RMSDs for all the three complexes seems to be overlapped and ranges from 0.2 to 1.2 Å with average values of 0.45 Å, 0.70 Å and 0.58 Å for WT-1T, V32I-2T and M46L-2T, respectively. However, for flap-B, where the inhibitor is bound, there is a difference in the RMSDs for the mutant M46L-2T from that of WT-1T and V32I-2T at around 3-4 ns. Here, the value goes up to 1.5Å, suggesting a higher mobility of the flap in this region. Apart from that, for a brief period at around 7 ns, WT-1T has also an increased RMSD up to 1.5 ns. However, the mean for the flap-B RMSDs, doesn't differ amongst the mutants with 0.65 Å for V32I-2T and 0.64 Å for M46L-2T. This analysis suggests that, although the dynamics and RMSDs of both the flaps combined or individual RMSDs of the flaps-A & B, differ to certain extent, it has not much impact on the flap dynamics as a whole.
3.3.2. Flap tip to active site distances
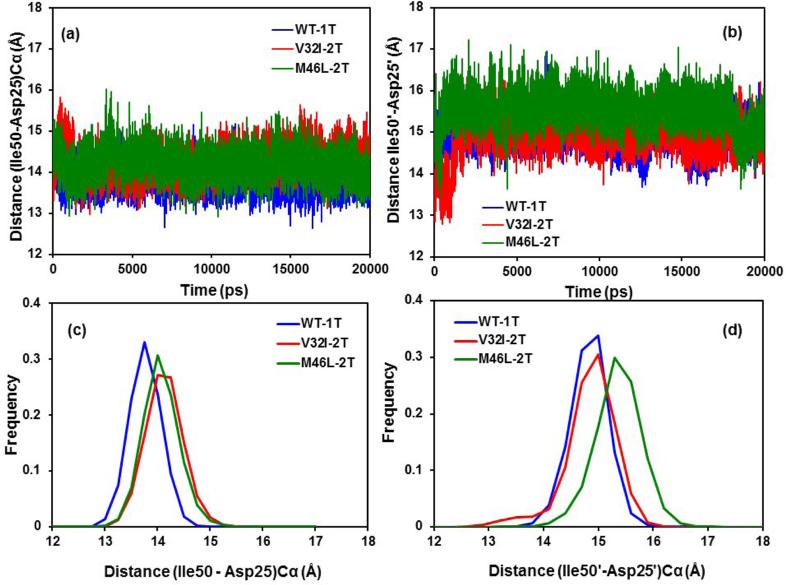
The Ile50(Ile50’) - Asp25(Asp25’) distances for double bound TMC114 mutants (V32I-2T and M46L-2T) were calculated from the MD trajectories and the observed results were compared with those of WT-1T proteins. The time series plot and the frequency distribution histograms are shown in Figures 6a-d for chains A and B, respectively. It was found that for chain-A the distribution was much more overlapped compared with the chain-B. The mean distances of flap tip-active site residues in chain A are 13.89, 14.25 and 14.19 Å with SD values of 0.29, 0.34, and 0.33 Å for WT-1T, V32I-2T and M46L-2T-HIV-1-pr/TMC114, respectively. This indicates that in the double inhibitor-bound state (2T), the distance between the flap tips and the active site is only slightly stretched by 0.3-0.4 Å due to the mutations for chain-A. For chain-B there is a substantial difference between the distributions as compared with chain-A (Figure 6b and 6d). The mean distances and SD of WT-1T (V32I-2T) are 14.99 (15.00) Å and 0.33 (0.47) Å, respectively; while for the M46L-2T, the mean and SD are 15.51 Å and 0.41 Å, respectively. The mean distance of the distribution for the mutant M46L differs by approximately 0.51 Å from WT and V32I. In general for all proteases (WT, V32I and M46L) the average flap tip-active site distance in chain-B is longer than that of chain-A. The frequency distribution plots (Figure 6c and 6d) for the flap tip-active site distances for chains A and B show the clear difference between WT-1T, V32I-2T and M46l-2T. It was demonstrated that for the two mutants of chain-A the distances from the flap regions to the active sites are further than that for the WT. However, for chain-B, the distribution plots for WT-1T and V32I-2T shares the overlapping as compared to M46L-2T, which shows a wider values. From this study, it seems that for M46L-2T, the average flap tip to active site distances for both the chains is longer than WT-1T, making the active site volume little wider.
Figure 6.
Time series plot of (a) the Ile50-Asp25 Cα distances, (b) the Ile50’-Asp25’ Cα distances of the WT-1T, V32I-2T mutant and M46L-2T mutant HIV-1-pr. (c) Histogram distributions of Ile50-Asp25 distance; and (d) histogram distributions of Ile50’-Asp25’ distance for WT-1T, V32I-2T mutant and M46L mutant HIV-1-pr simulation.
The distance between the flap tips (Ile50Cα and Ile50’Cα) and the catalytic aspartates (Asp25Cα and Asp25’Cα) for WT-1T, V32I-1T and M46L-1T HIV-1-pr/TMC114 shows that the distances in chain-A for all the three complexes are almost overlapped throughout the simulation with an average distance of 13.89, 14.05 and 14.05 Å, respectively, which are slightly shorter than those of double binding for the two mutants. For chain-B, this distance looks to be very stable and overlapped throughout the simulation (Figure S4b). The average distance for the three systems are 14.99, 14.85 and 14.92 Å with the respective SD of 0.33, 0.33 and 0.33 Å. The only exception is in case of WT-1T around 6.7 ns, where the distance goes up to a range of 17Å. This data complement well with the deviations in flap-flap distance in the same region (around 6.7ns) as discussed earlier. The difference between the distances in double bound (2T) complex from that of single bound (1T) complex is that, the difference in average distance of chain-B in M46L-2T mutant by about 0.61 Å making the active site volume little wider than the WT-1T.
3.3.3. Flap tip–flap tip distances
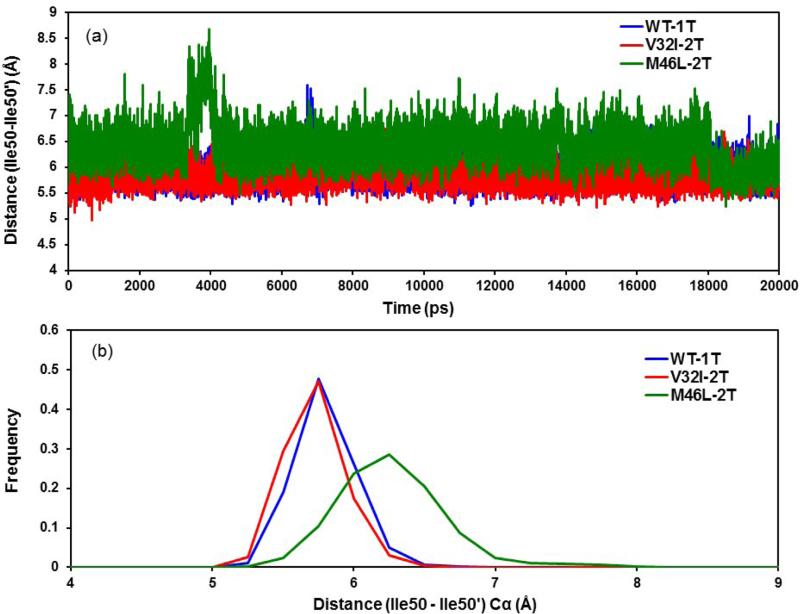
The Ile50-Ile50’ distance was examined to investigate the relative motion of the flap tips. The difference between the double bound V32I-2T and M46L-2T/HIV-1-pr was found to be broader than that of the single bound V32I-1T and M46L-1T/HIV-1-pr mutants (Figure 7a). The mean distances (SD) are 5.92 Å (0.20 Å) for WT-1T and 5.85 Å (0.20 Å) for V32I-2T, and 6.39 Å (0.38 Å) for M46L-2T mutant, respectively. While considerable overlaps exist in the WT-1T and V32I-2T trajectories, the distance between the flap tips was recognized to fluctuate more in the case of M46L than in the WT and mutant V32I. It is clearly seen that, at around 4 ns the flap tips distance rises up to 8.60 Å in case of M46L-2T mutant. This is believed to be due to the curling in and out of the flap tips. Hence, the mean of the double bound M46L mutant structure is more (~0.5 Å) than the WT and V32I, suggesting that there is a floppy movement of flaps in M46L-2T as compared to WT-1T and V32I-2T/HIV-1-pr structures and probably make the active site volume larger. The frequency distribution plots for flap tipA–flap tipB distance in Figure 7b also clearly show that with respect to (I50–I50′) Cα distance, WT-1T and V32I-2T mutant assemble different types of conformations as compared with the M46L-2T mutant. For the M46L-2T mutant, the distribution has one peak around 6.4 Å, whereas for WT-1T and V32I-2T mutant, the peak locates around 5.8 Å, region. While significant overlaps exist in the three distributions, the distance between the flap tips was recognized to fluctuate more in the case of M46L-2T and it covers wider values as compared to WT-1T and V32I-2T HIV-1-pr mutant.
Figure 7.
(a) Time-series plot and (b) frequency distribution plot for the distance between the flap tip (Ile50-Ile50’) Cα atoms for the double bound TMC114 to HIV-1-pr mutants and single bound to WT.
Figure S3 shows the time-series distance plot between the flap tip residues (Ile50 – Ile50’) for the three systems (WT-1T, V32I-1T, and the M46L-1T/TMC114 complexes), which have almost overlapped distances with average values of 5.92 Å, 5.82 Å, and 5.91 Å, respectively. The only exception is the fluctuations of the flap tip-flap tip distance in case of WT-1T around 6.7 ns, where the distance goes up to a range of 7-8Å. This is believed to be due to the re-arrangement in the flap curling in the tips. Average flap tip distances suggest that the less movement of the flap tips makes the inner active site less opened and tighter binding of TMC114 to the protein. Like in our previous study,[7] the TMC114 complexed protein also has less movement in flaps. The difference in the flap tips distances for the 1T and 2T complexes remains mostly in case of M46L mutant, where the distance is ~0.5 Å higher in 2T than 1T, suggesting that the higher mobility of the flaps in 2T, even if an extra TMC114 bound on one of the flaps.
3.3.4. Analysis of the TriCa Angle
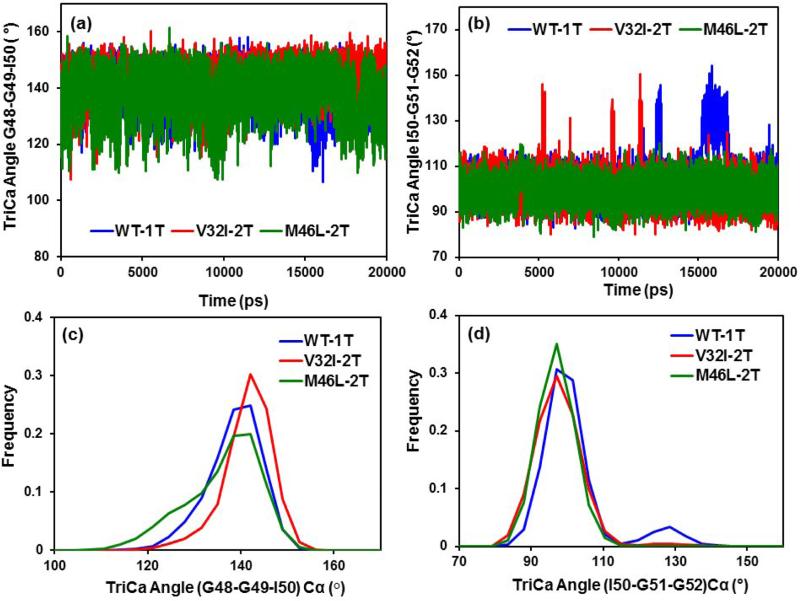
In order to explain the flap dynamics behavior of the protein, Scott et al. introduced the term flap curling [46] of the TriCa (G48Cα-G49Cα −I50Cα) angles involving the residues in the flap tip or nearby region. It is known that the flap curling in and out behavior makes the protein opened and closed states, respectively, in order to access the substrate/inhibitor. Rick et al. also have confirmed in their simulation studies that the curling behavior of flaps happens before the opening event.[47] We have calculated some of the angles in the flap region to describe about the flap dynamics. The flap dynamics of the inhibitor bound proteases can be further analyzed by the TriCa (Gly49-Ile50-Gly51) Cα angles in the flap tip region for all three WT-1T, V32I-2T and M46L-2T/HIV-1-pr complexes. Looking at the time-series plot for the TriCa angle in Figure 8a, we observed that the angles are seems to be overlapped for all the complexes except for around 10 ns where the M46L-2T has visibly lower angular values and around 15-17 ns where V32I-2T has lower values. The trajectories are quite similar to the single bound structures. Analyzing the frequency distribution plot for the TriCa angle G48–G49–I50 (Figure 8c), it was found that the distribution of the angle for WT-1T and M46L-2T overlaps substantially; however, the V32I-2T distribution shows a difference as compared to the other two. The mean values of the TriCa angle for WT-1T (M46L-2T) trajectories are 140.31° (137.89°) and SD is 5.81° (7.94°), whereas for the V32I-2T the mean and SD are 143.13° and 5.32°. The mean values of WT-1T and M46L-2T are smaller than that of V32I-2T complex by ~3° and > 5°, which implies the more curling in of the flap tips in WT-1T and M46L-2T than the V32I-2T. However, the general pattern of the trajectories remains the same as of single bound HIV-1-pr complexes of the protein.
Figure 8.
(a & b) Time series plots; and (c & d) frequency distribution histograms for the TriCa angles (Gly48-Gly49-Ile50), (Ile50-Gly51-Gly52) for the three systems (WT-1T, V32I-2T and M46L-2T).
Diagnosing the frequency distribution plot (Figure 8d) for the other TriCa angle Ile50–Gly51-Gly52, the distributions are almost overlapped for both the mutants and WT-1T, except for WT-1T, which have a second peak around 130°. The mean and SD of the TriCa angles for the V32I-2T (M46L-2T) distribution are 100.07° (99.22) and 7.02° (5.05), respectively, whereas for the WT-1T, the mean and SD are 103.97° and 9.79°. Therefore, the mean of the two distributions of V32I-2T and M46L-2T differ by 4° and 5° from that of the WT-1T. The time series plot (Figure 8b) also shows the higher fluctuations of WT-1T and V32I-2T structures as compared to M46L-2T structures.
3.4. Total Binding Free Energies
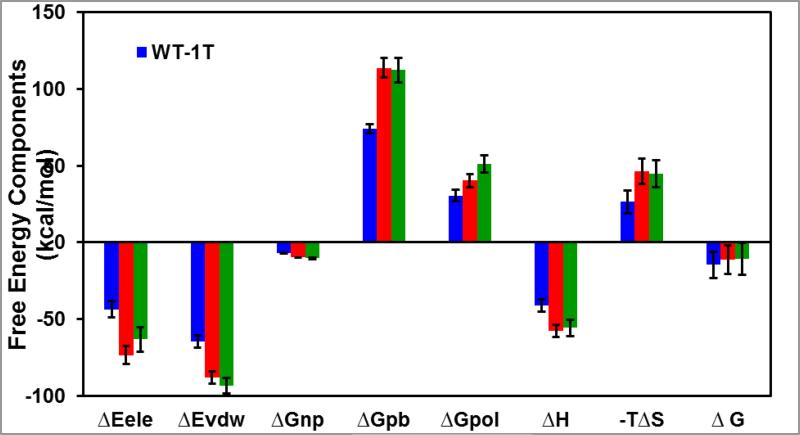
In order to get insights to the different contributions of binding free energy for double bound TMC114 with WT, V32I and M46L mutant, binding free energies were calculated for all the complexes using the MM-PBSA method. Contributions of the binding free energies of complexes WT-1T, V32I-2T and M46L-2T are summarized in Table 1 and Figure 9. As shown in the figure and table, the calculated binding free energies of WT-1T, V32I-2T and M46L-2T complexes are −14.67, −11.25 and −10.78 kcal/mol, respectively, suggesting that the binding free energy of WT is higher than the V32I and M46L mutants. Overall, the calculated data is consistent with the sequence of the experimental affinity of WT (−15.20 kcal/mol) [48], V32I and M46L (−11.6 and −11.3 kcal/mol) complexes. [27]
Table 1.
Binding free energy components for the HIV-pr/TMC114 complex for double bound (2T) by using the MM-PBSA method calculated from 50 snapshots extracted from 11th-20th ns.a
| Componentb | WT-1T | V32I-2T | M46L-2T | |||
|---|---|---|---|---|---|---|
| Mean | Stdc | Mean | Stdc | Mean | Stdc | |
| ΔEele | −43.54 | 5.32 | −73.50 | 5.95 | −63.13 | 8.09 |
| ΔEydw | −64.64 | 4.13 | −88.25 | 3.99 | −93.41 | 5.28 |
| ΔEint | 0.00 | 0.00 | 0.00 | 0.00 | −3.14 | 1.63 |
| ΔGnp | −6.93 | 0.10 | −9.69 | 0.21 | −10.41 | 0.36 |
| ΔGpb | 74.01 | 3.03 | 113.82 | 6.28 | 112.38 | 8.22 |
| ΔGpol | 30.46 | 3.73 | 40.32 | 4.49 | 51.24 | 5.54 |
| ΔH | −41.11 | 3.93 | −57.62 | 4.12 | −55.71 | 5.49 |
| -TΔS | 26.44 | 7.53 | 46.37 | 8.47 | 44.93 | 8.86 |
| ΔG | −14.67 −15.33d |
8.49 6.11 |
−11.25 | 9.41 | −10.78 | 10.42 |
| Δ Gexp | −15.20e −13.20f |
−11.6g | −11.3g | |||
All values are given in kcal/mol.
Component: ΔEele, electrostatic energy in the gas phase; ΔEvdw, van der Waals energy; ΔGnp, nonpolar solvation energy; ΔGpb, polar solvation energy; ΔGpol=ΔEele + ΔGpb; TΔS, total entropy contribution; ΔH = ΔEele + ΔEvdw + ΔGpb+ ΔGnp; ΔG = ΔH – TΔS.
Standard error of mean values.
Meher and Wang 2012. [7]
King et al. 2004.[48]
Kovalevsky et al. 2006.[4]
Kovalevsky et al. 2006.[27]
Figure 9.
Energy components (kcal/mol) for the binding of TMC114 to the WT-1T, V32I-2T and M46L-2T: ΔEele: Electrostatic energy in the gas phase; ΔEvdw: van der Waals energy; ΔGnp: non-polar solvation energy; ΔGpb: polar solvation energy; ΔGpol=ΔGele + ΔGpb; TΔS: total entropy contribution; ΔH = ΔEele + ΔEvdw + ΔGnp+ΔGpb; ΔG = ΔH - TΔS.
In accordance with the components of the binding free energy from Table-1, in all the three HIV-1-pr/TMC114 complexes, van der Waals and electrostatic energies in the gas phase provide the major favorable contributions to the inhibitor binding. Non-polar solvation energies (ΔGnp), resulted from the burial of TMC114 solvent accessible surface area, has also contributions to the binding energy a bit favorably. Conversely, polar solvation energies (ΔGpb) and entropy components create the considerably unfavorable contribution to the binding energy.
The binding affinities (ΔG) of V32I-2T and M46L-2T complexes decrease by 3.42 and 3.89 kcal/mol with respect to the WT-1T complex, which suggests that both the mutants demonstrate drug resistance to TMC114 heavily. Comparisons of the free energy components between WT complex and the mutant complexes are carried out to explicate the mechanism behind the drug resistance (Figure 9). The non-polar solvation energies among the three systems are very small, indicating good packing of cavity region in all the systems. As compared with the binding components for 1T complexes in Table 2, the binding of the second ligand on the flap region considerably enhances the electrostatic as well as van der Waal's contributions in V32I-2T and M46L-2T. On the other hand, although the second binding also causes significantly unfavorable polar solvation energy (ΔGpb), it does enhance the enthalpy (ΔH = ΔEele + ΔEvdw + ΔGpb). However, the entropy penalty eventually compress the binding Gibbs affinities (ΔG = ΔH - TΔS) and trigger the drug resistance for the V32I and M46L mutations.
Table 2.
Binding free energy components for the HIV-pr/TMC114 complex for single bound (1T) by using the MM-PBSA method calculated from 50 snapshots extracted from 11th-20th ns.a
| Componentb | WT-1T | V32I-1T | M46L-1T | |||
|---|---|---|---|---|---|---|
| Mean | Stdc | Mean | Stdc | Mean | Stdc | |
| ΔEele | −43.54 | 5.32 | −42.04 | 4.79 | −42.05 | 3.78 |
| ΔEvdw | −64.64 | 4.13 | −66.54 | 3.10 | −64.71 | 2.50 |
| ΔEint | 0.00 | 0.00 | 0.42 | 1.32 | 0.00 | 0.00 |
| ΔGnp | −6.93 | 0.10 | −6.97 | 0.15 | −6.96 | 0.11 |
| ΔGpb | 74.01 | 3.03 | 72.99 | 4.23 | 72.41 | 3.39 |
| ΔGpol | 30.46 | 3.73 | 30.94 | 4.13 | 30.35 | 2.18 |
| ΔH | −41.11 | 3.93 | −42.15 | 4.35 | −41.31 | 3.72 |
| -TΔS | 26.44 | 7.53 | 29.72 | 9.28 | 30.19 | 9.42 |
| ΔG | −14.67 −15.33d |
8.49 6.11 |
−12.43 | 10.24 | −11.12 | 10.12 |
| Δ Gexp | −15.20e −13.20f |
|||||
All values are given in kcal/mol.
Component: ΔEele, electrostatic energy in the gas phase; ΔEvdw, van der Waals energy; ΔGnp, nonpolar solvation energy; ΔGpb, polar solvation energy; ΔGpol=ΔEele + ΔGpb; TΔS, total entropy contribution; ΔH = ΔEele + ΔEvdw + ΔGpb+ ΔGnp; ΔG = ΔH – TΔS.
Standard error of mean values.
Meher and Wang 2012. [7]
King et al. 2004.[48]
Kovalevsky et al. 2006.[4]
The binding free energies for all the single bound 1T complexes were also summarized in Table 2 and Figure S6. The calculated binding free energies (ΔG) of WT-1T, V32I-1T and M46L-1T complexes are −14.67, −12.43 and −11.12 kcal/mol respectively. The affinity of the mutation V32I-1T complex decreases by 2.24kcal/mol, and that of the M46L-1T decreases by 3.55 kcal/mol with respect to the WT-1T complex. Table 2 shows that the ΔH for the M46L mutant does not change much (−41.31 vs. −41.11 kcal/mol), and the decrease of binding affinity for the mutant is mainly attributed to entropy penalty (TΔS: 30.19 vs. 26.44 kcal/mol); while for the mutant V32I the ΔH is even favorable than that of WT (−42.15 vs. −41.11 kcal/mol) mainly due to the ΔEvdw, yet the entropy penalty is still responsible for the binding affinity decrease. According to Tables 1 and 2, the binding Gibbs free energies for the binding of TMC114 with two mutants V32I and M46L at two sites (2T) are closer to the experimental results[27] than those binding at only active site (1T). Thus, the present all-atom molecular dynamics simulation results provide a theoretical evidence for the binding of TMC114 with V32I and M46L-HIV-1-pr at both active and flap sites. The binding of TMC114 with the flap region does result in higher ΔGtotal (more negative) for double bound complexes as shown in Table 1, and the lower binding Gibbs free energies ΔG (less negative) are due to entropy loss arising from the binding of TMC114 to the flap region.
3.4.1. Analysis of the Structure-affinity relation
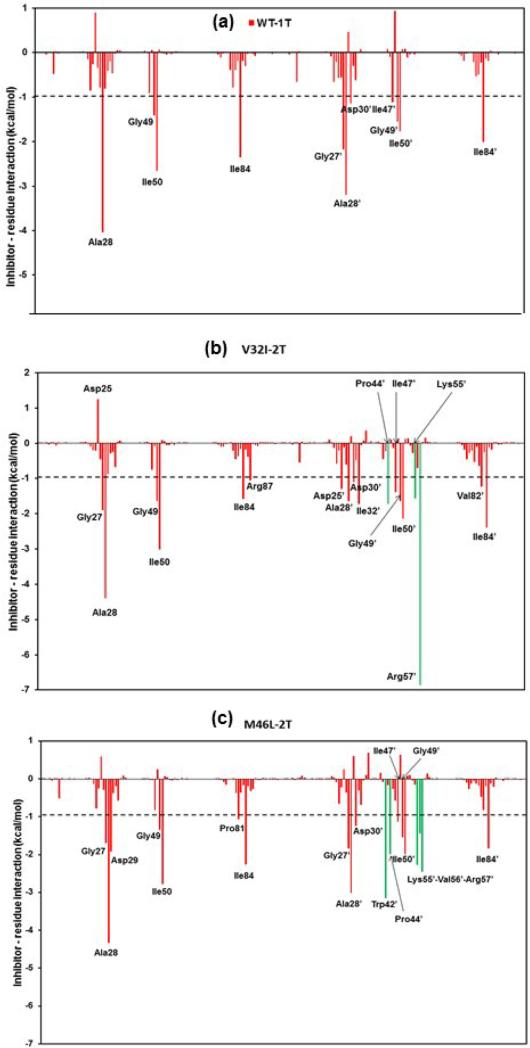
The inhibitor-protein interactions can be further studied from the structure-affinity relationship. The effect of mutations on the double bound TMC114 to the HIV-1-pr and its difference from the single bound TMC114 to the HIV-1-pr can be evaluated from the structure-affinity relation analysis. The decomposition of the inhibitor-residue pairs to create an interaction spectrum was shown in Figure 10.
Figure 10.
Decomposition of ΔG on a per-residue basis for the protein–inhibitor complex: (a) WT-1T, (b) V32I-2T, and (c) M46L-2T. Residues contributing from the TMC114 bound to flap (TMC-flap) are shown in solid green lines.
It was found that the interaction spectra of three complexes for double bound TMC114 structures are similar to each other like that of single bound structures (Figure S7). Overall, the major interaction comes from a few groups around Gly27/Gly27’, Ala28/Ala28′, Asp29/Asp29’, Ile47/Ile47’, Gly49/Gly49′, Ile50/Ile50′ and Val82/Val82’ and Ile84/Ile84. These groups of interaction consist of 11 to 12 residues in total with the binding energy of more than 1.0 kcal/mol. However, the binding of the second ligand on one of the flap regions, induces more number of residues for the interaction. Residues like Pro44’, Lys55’, Arg57’ are primarily involved for the interaction in V32I-2T structures, and Trp42’, Pro44’, Lys55’, Val56’ and Arg57’ are involved for the M46L-2T structures. Figure 10 shows the decomposition of ΔG values on a per-residue basis into contributions from van der Waals (ΔEvdw), the sum of electrostatic interactions in the gas phase and polar solvation energy (ΔGpol = ΔEele + ΔGpb), and nonpolar solvation energy (ΔGnp) for residues with |ΔG | ≥ 1.0 kcal/mol for all the three HIV-1-pr/TMC114 complexes. Furthermore, Figure S10 highlights the decomposition of ΔG on a per-residue basis for the protein–inhibitor complex in the double bound TMC114 showing the contributions from the backbone and side-chains of individual residues.
3.4.2. Effects of mutations on the binding affinity
The mutation V32I-2T has moderate direct contributions to the binding affinity of TMC114 with HIV-1-pr. According to TGBTOT in Table S2 and Figure 10, the V32I mutant directly increases the binding affinity by approximately −0.19 (Val32 to Ile32) and −1.05 (Val32’ to Ile32’) kcal/mol, which only accounts for 2.11% of the ΔGtotal. The increased van der Waals energy for the Ile32’ in chain-B is due to the increase in van der Waals contact from the flap bound TMC114 and structurally transformed flap-B residues. Indirect effects on the binding affinity of other local residues also exist in the active site. The mutation V32I leads to the decrease in binding contributions from four of the active-site residues Leu23 (−0.19 vs −0.85 kcal/mol); Gly27’ (−0.23 vs −0.76 kcal/mol); Ala28’ (−1.26 vs −2.22 kcal/mol ); and Asp29’ (−0.34 vs −1.17 kcal/mol for WT) and one active-site wall residue Ile84 (−1.29 vs −1.95 kcal/mol) in total about 3.64 kcal/mol, which is approximately 6.19% of the ΔGtotal and approximate 37% of the total loss. (Figure 10)
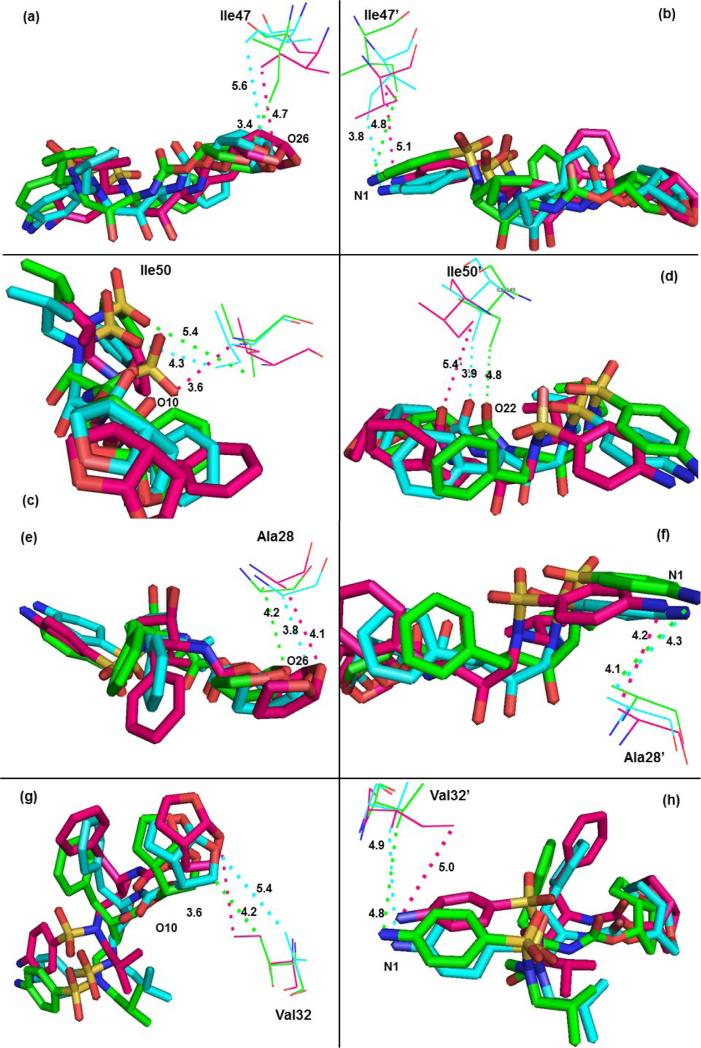
The mutation M46L-2T has little direct contributions to the binding affinity of TMC114 with HIV-1-pr in the current study. Table S2 further shows that the M46L-2T mutant indirectly decreases the binding affinity by approximately 3.80 kcal/mol, of which approximately 59% of the total loss (by −2.25 kcal) comes from three residues Arg08’, (−0.75); Asp25’,(−0.82) and Glu35’ (−0.68) kcal/mol, which is accompanied by a substantial increase in interaction from the residues like Gly27, Ala28, Asp29, Trp42’-Lys43’-Pro44’, Ile47’, Lys55’-Val56’-Arg57’. The mutation M46L leads to the decrease in binding contributions from one of the flap residues Ile47 also probably due to the loss in van der Waal's contact between the residue and inhibitor. The distance between the side-chains of residue Ile47 to the O26 atom of TMC114 suggest a smaller (3.4 Å) one for WT-1T as compared to the mutants V32I-2T (4.7 Å) and M46L-2T (5.6 Å) (Figure 11a). The C–H···O, C-H···N interactions between the TMC114 and the flap residues (Ile47, Ile47′ and Ile50, Ile50′), and active site residues (Ala28, Ala28’ and Val32, Val32’) are shown in Figure 11a-h.
Figure 11.
C–H···O and C-H···N interactions between the TMC114 and the flap residues (Ile47, Ile47′ and Ile50, Ile50′), active site residues (Ala28, Ala28’ and Val32, Val32’). TMC114 in sticks is colored by the atom type, and residues are shown as lines (green, WT-1T; pink, V32I-2T; cyan, M46L-2T).
3.4.3. Effects of flap bound TMC114 (TMC-flap) on the total binding affinity
It was observed that, with binding of the TMC114 (TMC-flap) at the flap region simultaneously with that of TMC114 (TMC-AS) bound at the active site of both the mutants (V32I-2T and M46L-2T), the overall binding energies from the contributing residues are increased (Figure S14). Basically the residues from the chain-B, namely Trp42’, Pro44’, Lys55’-Val56’-Arg57’ and Val82’ shows enhanced binding energies. Most of these residues directly interact with TMC-flap and thereby increase the binding energy through C-H···O or C-H···π interactions. Residues interacting with the TMC-flap and TMC-AS for both the mutants in their single and double bound form are shown in Figure S11 and S12. It was also observed that, binding of TMC-flap may also induce the binding of other residues, which essentially interact with the TMC-AS. Taking example of Ile32’ in the V32I-2T mutant, we found that the mutated residue (Val32’ to Ile32’) in chain-B has substantial contribution (−1.72 kcal/mol) to the ΔGtotal, but not from the residue (Ile32) in chain-A. This may be possibly due to conformation change upon the binding of TMC114 with chain-B flap. However, the possible contribution from the longer side-chain of Ile32’ as compared to Val32’, can't be ruled out.
It was also observed that, for V32I-2T, binding of the TMC-flap is mainly due to the van der Waals effect of Arg57’ and Lys55’, but the sum of electrostatic interactions and polar solvation energy (Ele + GB), from Arg57’ is the highest unfavorable contribution as shown in Figure S14 and Table S2. For M46L-2T, van der Waals effect dominates over the (Ele + GB) from residues Trp42’, Lys55’ and Arg57’ towards the contribution.
However, apart from the binding energy increase in individual residue contributions from the flap region, the mutant systems have significant unfavorable entropic contributions. For V32I-2T, the entropy contribution (−TΔS) reaches to 48.41 kcal/mol while as for V32I-1T it is only 27.85 kcal/mol. Similarly M46L-2T also has significantly higher unfavorable entropic contribution as compared to M46L-1T (45.63 kcal/mol vs. 27.40 kcal/mol). This reflects that, although the binding energy from the residues interacting to TMC-flap enhances individual contribution, the total gain in the binding free energy is negative and marred by the larger unfavorable entropies for both double bound TMC114/HIV-1-pr mutants.
4. Conclusions
We explored the effects of mutations (V32I and M46L) on the binding efficiency of the inhibitor TMC114 in its single bound form to the active site alone and double bound form to the cavity of active site in addition to one of the flap region. The primary intention was to differentiate the binding affinity of TMC114 for the single and double bounds. Secondary, we would check the effects of mutations on both single and double bound TMC114/HIV-1-pr complexes. A 20 ns long simulation was performed for each complexes and the free energy of binding of ligand to the protein was calculated with the MM-PBSA method. It was observed that, the binding free energies are unfavorable for M46L and V32I mutants in their single TMC114 and double TMC114 bound form as compared to WT. The mutants V32I has both direct and indirect effects on the binding affinity, however the mutant M46L elicits primarily indirect towards the resistance. For the single bound, the entropy penalty is mainly responsible for the decrease of binding affinity for both the mutant V32I and the mutant M46L. For the double TMC114 bound mutants (V32I-2T and M46L-2T), the resistance is mainly due to the higher entropic contributions. The binding Gibbs free energies for the binding of TMC114 with two mutants V32I and M46L at two sites (2T) are closer to the experimental results than those binding at only active site (1T), which provides a theoretical evidence for the binding of TMC114 with V32I and M46L-HIV-1-pr at both active and flap sites. It was also conclude that, binding of the inhibitor (TMC114) in the flap region doesn't help much in the total gain in binding affinity of the system, which agrees with experimental result. The current article also deals with the quantitative and mechanistic validation of mutational effect from a complete analysis of the structure-affinity relationship.
Supplementary Material
Highlights.
❖ Provide theoretical evidence for the binding of TMC114 on the flap region of the HIV-1-pr mutants ( M46L and V32I);
❖ Interpret drug resistance mechanism for the mutants M46L and V32I in spite of the second binding of TMC114 on the flap region;
❖ Compare the effect on the flap dynamics and binding affinity for the sole binding and two site binding of TMC114;
Acknowledgements
This work was supported by the National Institute of General Medical Science of the National Institute of Health (SC3GM105576 and SC3GM082324). The authors thank Pittsburgh Supercomputing Center, NCSA-Teragrid for providing the computational facilities to carry out the work in the form of a startup grant (CHE100117) to BRM.
Footnotes
Publisher's Disclaimer: This is a PDF file of an unedited manuscript that has been accepted for publication. As a service to our customers we are providing this early version of the manuscript. The manuscript will undergo copyediting, typesetting, and review of the resulting proof before it is published in its final citable form. Please note that during the production process errors may be discovered which could affect the content, and all legal disclaimers that apply to the journal pertain.
Supporting Information:
Tables S1and S2 summarizes the decomposition of ΔG on a per-residue basis for single and double TMC114 bound HIV-1-pr complexes, respectively. Figure S1 to S9 shows the different plots and diagrams related to the comparison of single TMC114 bound HIV-1-pr complexes. Figure S10 shows the decomposition of ΔG on a per-residue basis for double TMC114 bound HIV-1-pr complexes with contributions from backbone and side-chains. Figures S11 and S12 show the residues interacting with the TMC-flap and TMC-AS for both the mutants in their single and double TMC114 bound form. Figure S13 is a comparison for the Cα RMSD values of flap residues in both chains of HIV-1-pr. Figure S14 is a decomposition of ΔG on a per-residue basis into different contributions for double bound complexes.
References
- 1.Wlodawer A, Vondrasek J. Inhibitors of HIV-1 protease: a major success of structure-assisted drug design. Annu Rev Biophys Biomol Struct. 1998;27:249–84. doi: 10.1146/annurev.biophys.27.1.249. [DOI] [PubMed] [Google Scholar]
- 2.Tie Y, Boross PI, Wang YF, Gaddis L, Hussain AK, Leshchenko S, et al. High resolution crystal structures of HIV-1 protease with a potent non-peptide inhibitor (UIC-94017) active against multi-drug-resistant clinical strains. J Mol Biol. 2004;338:341–52. doi: 10.1016/j.jmb.2004.02.052. [DOI] [PubMed] [Google Scholar]
- 3.Kar P, Knecht V. Origin of decrease in potency of darunavir and two related antiviral inhibitors against HIV-2 compared to HIV-1 protease. The journal of physical chemistry. B. 2012;116:2605–14. doi: 10.1021/jp211768n. [DOI] [PubMed] [Google Scholar]
- 4.Kovalevsky AY, Tie Y, Liu F, Boross PI, Wang Y-F, Leshchenko S, et al. Effectiveness of Nonpeptide Clinical Inhibitor TMC-114 on HIV-1 Protease with Highly Drug Resistant Mutations D30N, I50V, and L90M. J. Med. Chem. 2006;49:1379–87. doi: 10.1021/jm050943c. [DOI] [PMC free article] [PubMed] [Google Scholar]
- 5.Tie Y, Kovalevsky AY, Boross P, Wang YF, Ghosh AK, Tozser J, et al. Atomic resolution crystal structures of HIV-1 protease and mutants V82A and I84V with saquinavir. Proteins. 2007;67:232–42. doi: 10.1002/prot.21304. [DOI] [PubMed] [Google Scholar]
- 6.Chen J, Zhang S, Liu X, Zhang Q. Insights into drug resistance of mutations D30N and I50V to HIV-1 protease inhibitor TMC-114: free energy calculation and molecular dynamic simulation. J Mol Model. 2010;16:459–68. doi: 10.1007/s00894-009-0553-7. [DOI] [PubMed] [Google Scholar]
- 7.Meher BR, Wang Y. Interaction of I50V Mutant and I50L/A71V Double Mutant HIVProtease with Inhibitor TMC114 (Darunavir): Molecular Dynamics Simulation and Binding Free Energy Studies. J Phys Chem B. 2012;116:1884–900. doi: 10.1021/jp2074804. [DOI] [PMC free article] [PubMed] [Google Scholar]
- 8.Kar P, Knecht V. Energetic basis for drug resistance of HIV-1 protease mutants against amprenavir. J Comput Aided Mol Des. 2012;26:215–32. doi: 10.1007/s10822-012-9550-5. [DOI] [PubMed] [Google Scholar]
- 9.Chen J, Yang M, Hu G, Shi S, Yi C, Zhang Q. Insights into the functional role of protonation states in the HIV-1 protease-BEA369 complex: molecular dynamics simulations and free energy calculations. Journal of molecular modeling. 2009;15:1245–52. doi: 10.1007/s00894-009-0452-y. [DOI] [PubMed] [Google Scholar]
- 10.Hu GD, Zhu T, Zhang SL, Wang D, Zhang QG. Some insights into mechanism for binding and drug resistance of wild type and I50V V82A and I84V mutations in HIV-1 protease with GRL-98065 inhibitor from molecular dynamic simulations. Eur J Med Chem. 2010;45:227–35. doi: 10.1016/j.ejmech.2009.09.048. [DOI] [PubMed] [Google Scholar]
- 11.Stoica I, Sadiq SK, Coveney PV. Rapid and accurate prediction of binding free energies for saquinavir-bound HIV-1 proteases. J Am Chem Soc. 2008;130:2639–48. doi: 10.1021/ja0779250. [DOI] [PubMed] [Google Scholar]
- 12.Hou T, Yu R. Molecular dynamics and free energy studies on the wild-type and double mutant HIV-1 protease complexed with amprenavir and two amprenavir-related inhibitors: mechanism for binding and drug resistance. J Med Chem. 2007;50:1177–88. doi: 10.1021/jm0609162. [DOI] [PubMed] [Google Scholar]
- 13.Ode H, Neya S, Hata M, Sugiura W, Hoshino T. Computational simulations of HIV-1 proteases--multi-drug resistance due to nonactive site mutation L90M. J Am Chem Soc. 2006;128:7887–95. doi: 10.1021/ja060682b. [DOI] [PubMed] [Google Scholar]
- 14.Ode H, Matsuyama S, Hata M, Hoshino T, Kakizawa J, Sugiura W. Mechanism of drug resistance due to N88S in CRF01_AE HIV-1 protease, analyzed by molecular dynamics simulations. J Med Chem. 2007;50:1768–77. doi: 10.1021/jm061158i. [DOI] [PubMed] [Google Scholar]
- 15.Wang W, Kollman PA. Computational study of protein specificity: the molecular basis of HIV-1 protease drug resistance. Proc Natl Acad Sci U S A. 2001;98:14937–42. doi: 10.1073/pnas.251265598. [DOI] [PMC free article] [PubMed] [Google Scholar]
- 16.Leonis G, Czyznikowska Z, Megariotis G, Reis H, Papadopoulos MG. Computational studies of darunavir into HIV-1 protease and DMPC bilayer: necessary conditions for effective binding and the role of the flaps. Journal of chemical information and modeling. 2012;52:1542–58. doi: 10.1021/ci300014z. [DOI] [PubMed] [Google Scholar]
- 17.Leonis G, Steinbrecher T, Papadopoulos MG. A Contribution to the Drug Resistance Mechanism of Darunavir, Amprenavir, Indinavir, and Saquinavir Complexes with HIV-1 Protease Due to Flap Mutation I50V: A Systematic MM-PBSA and Thermodynamic Integration Study. J Chem Inf Model. 2013;53:2141–53. doi: 10.1021/ci4002102. [DOI] [PubMed] [Google Scholar]
- 18.Srivastava HK, Sastry GN. Molecular dynamics investigation on a series of HIV protease inhibitors: assessing the performance of MM-PBSA and MM-GBSA approaches. Journal of chemical information and modeling. 2012;52:3088–98. doi: 10.1021/ci300385h. [DOI] [PubMed] [Google Scholar]
- 19.Meher BR, Wang Y. Binding of single walled carbon nanotube to WT and mutant HIV-1 proteases: analysis of flap dynamics and binding mechanism. J Mol Graph Model. 2012;38:430–45. doi: 10.1016/j.jmgm.2012.10.001. [DOI] [PMC free article] [PubMed] [Google Scholar]
- 20.Kar P, Lipowsky R, Knecht V. Importance of polar solvation and configurational entropy for design of antiretroviral drugs targeting HIV-1 protease. The journal of physical chemistry. B. 2013;117:5793–805. doi: 10.1021/jp3085292. [DOI] [PubMed] [Google Scholar]
- 21.Tzoupis H, Leonis G, Durdagi S, Mouchlis V, Mavromoustakos T, Papadopoulos MG. Binding of novel fullerene inhibitors to HIV-1 protease: insight through molecular dynamics and molecular mechanics Poisson-Boltzmann surface area calculations. J Comput Aided Mol Des. 2011;25:959–76. doi: 10.1007/s10822-011-9475-4. [DOI] [PubMed] [Google Scholar]
- 22.Johnson VA, Brun-Vezinet F, Clotet B, Gunthard HF, Kuritzkes DR, Pillay D, et al. Update of the drug resistance mutations in HIV-1: December 2010. Top HIV Med. 2010;18:156–63. [PubMed] [Google Scholar]
- 23.Bandyopadhyay P, Meher BR. Drug resistance of HIV-1 protease against JE-2147: I47V mutation investigated by molecular dynamics simulation. Chem Biol Drug Des. 2006;67:155–61. doi: 10.1111/j.1747-0285.2006.00348.x. [DOI] [PubMed] [Google Scholar]
- 24.Wu TD, Schiffer CA, Gonzales M, Taylor J, Kantor R, Chou S, et al. Mutation patterns and structural correlates in human immunodeficiency virus type 1 protease following different protease inhibitor treatments. Journal of Virology. 2003;77:4836–47. doi: 10.1128/JVI.77.8.4836-4847.2003. [DOI] [PMC free article] [PubMed] [Google Scholar]
- 25.Croteau G, Doyon L, Thibeault D, McKercher G, Pilote L, Lamarre D. Impaired fitness of human immunodeficiency virus type 1 variants with high-level resistance to protease inhibitors. J Virol. 1997;71:1089–96. doi: 10.1128/jvi.71.2.1089-1096.1997. [DOI] [PMC free article] [PubMed] [Google Scholar]
- 26.Tie Y, Boross PI, Wang YF, Gaddis L, Liu F, Chen X, et al. Molecular basis for substrate recognition and drug resistance from 1.1 to 1.6 angstroms resolution crystal structures of HIV-1 protease mutants with substrate analogs. The FEBS journal. 2005;272:5265–77. doi: 10.1111/j.1742-4658.2005.04923.x. [DOI] [PMC free article] [PubMed] [Google Scholar]
- 27.Kovalevsky AY, Liu F, Leshchenko S, Ghosh AK, Louis JM, Harrison RW, et al. Ultra-high resolution crystal structure of HIV-1 protease mutant reveals two binding sites for clinical inhibitor TMC114. J Mol Biol. 2006;363:161–73. doi: 10.1016/j.jmb.2006.08.007. [DOI] [PMC free article] [PubMed] [Google Scholar]
- 28.Surleraux DL, Tahri A, Verschueren WG, Pille GM, de Kock HA, Jonckers TH, et al. Discovery and selection of TMC114, a next generation HIV-1 protease inhibitor. J Med Chem. 2005;48:1813–22. doi: 10.1021/jm049560p. [DOI] [PubMed] [Google Scholar]
- 29.Hyland LJ, Tomaszek TA, Jr., Meek TD. Human immunodeficiency virus-1 protease. 2. Use of pH rate studies and solvent kinetic isotope effects to elucidate details of chemical mechanism. Biochemistry. 1991;30:8454–63. doi: 10.1021/bi00098a024. [DOI] [PubMed] [Google Scholar]
- 30.Wang YX, Freedberg DI, Yamazaki T, Wingfield PT, Stahl SJ, Kaufman JD, et al. Solution NMR evidence that the HIV-1 protease catalytic aspartyl groups have different ionization states in the complex formed with the asymmetric drug KNI-272. Biochemistry. 1996;35:9945–50. doi: 10.1021/bi961268z. [DOI] [PubMed] [Google Scholar]
- 31.Bayly CI, Cieplak P, Cornell W, Kollman PA. A well-behaved electrostatic potential based method using charge restraints for deriving atomic charges: the RESP model. J. Phys. Chem. 1993;97 [Google Scholar]
- 32.Dewar MJS, Zoebisch EG, Healy EF, Stewart JJP. Development and use of quantum mechanical molecular models. 76. AM1: a new general purpose quantum mechanical molecular model. J. Am. Chem. Soc. 1985;107 [Google Scholar]
- 33.Wang J, Wolf RM, Caldwell JW, Kollman PA, Case DA. Development and testing of a general amber force field. J Comput Chem. 2004;25:1157–74. doi: 10.1002/jcc.20035. [DOI] [PubMed] [Google Scholar]
- 34.Case DA, Darden TA, T.E. Cheatham I, Simmerling CL, Wang J, Duke RE, et al. AMBER 11. University of California; San Francisco: 2010. [Google Scholar]
- 35.Hornak V, Abel R, Okur A, Strockbine B, Roitberg A, Simmerling C. Comparison of multiple Amber force fields and development of improved protein backbone parameters. Proteins. 2006;65:712–25. doi: 10.1002/prot.21123. [DOI] [PMC free article] [PubMed] [Google Scholar]
- 36.Jorgensen WL, Chandrasekhar J, Madura JD, Impey Roger W., Klein ML. Comparison of simple potential functions for simulating liquid water. Journal of Chemical Physics. 1983;79:10. [Google Scholar]
- 37.Essmann U, Perera L, Berkowitz ML, Darden T, Lee H, Pedersen LG. A smooth particle mesh Ewald method. J. Chem. Phys. 1995;103:17. [Google Scholar]
- 38.Berendsen HJC, Postma JPM, Van Gunsteren WF, DiNola A, Haak JR. Molecular dynamics with coupling to an external bath. J. Chem. Phys. 1984;81:7. [Google Scholar]
- 39.Ryckaert J-P, Ciccotti G, Berendsen HJC. Numerical integration of the cartesian equations of motion of a system with constraints: molecular dynamics of n-alkanes. J. Comput. Phys. 1977;23:327–41. [Google Scholar]
- 40.Wang YF, Tie Y, Boross PI, Tozser J, Ghosh AK, Harrison RW, et al. Potent new antiviral compound shows similar inhibition and structural interactions with drug resistant mutants and wild type HIV-1 protease. J Med Chem. 2007;50:4509–15. doi: 10.1021/jm070482q. [DOI] [PMC free article] [PubMed] [Google Scholar]
- 41.Nalam MN, Ali A, Altman MD, Reddy GS, Chellappan S, Kairys V, et al. Evaluating the substrate-envelope hypothesis: structural analysis of novel HIV-1 protease inhibitors designed to be robust against drug resistance. J Virol. 2010;84:5368–78. doi: 10.1128/JVI.02531-09. [DOI] [PMC free article] [PubMed] [Google Scholar]
- 42.Gohlke H, Kiel C, Case DA. Insights into protein-protein binding by binding free energy calculation and free energy decomposition for the Ras-Raf and Ras-RalGDS complexes. J Mol Biol. 2003;330:891–913. doi: 10.1016/s0022-2836(03)00610-7. [DOI] [PubMed] [Google Scholar]
- 43.Onufriev A, Bashford D, Case DA. Modification of the Generalized Born model suitable for macromolecules. J. Phys. Chem. B. 2000;104:3712–20. [Google Scholar]
- 44.Freedberg DI, Wang YX, Stahl SJ, Kaufman JD, Wingfield PT, Kiso Y, et al. Flexibility and function in HIV protease: Dynamics of the HIV-1 protease bound to the asymmetric inhibitor Kynostatin 272 (KNI-272). J. Am. Chem. Soc. 1998;120:7916–23. [Google Scholar]
- 45.Zoete V, Michielin O, Karplus M. Relation between sequence and structure of HIV-1 protease inhibitor complexes: a model system for the analysis of protein flexibility. J Mol Biol. 2002;315:21–52. doi: 10.1006/jmbi.2001.5173. [DOI] [PubMed] [Google Scholar]
- 46.Scott WR, Schiffer CA. Curling of flap tips in HIV-1 protease as a mechanism for substrate entry and tolerance of drug resistance. Structure. 2000;8:1259–65. doi: 10.1016/s0969-2126(00)00537-2. [DOI] [PubMed] [Google Scholar]
- 47.Rick SW, Erickson JW, Burt SK. Reaction path and free energy calculations of the transition between alternate conformations of HIV-1 protease. Proteins. 1998;32:7–16. doi: 10.1002/(sici)1097-0134(19980701)32:1<7::aid-prot3>3.0.co;2-k. [DOI] [PubMed] [Google Scholar]
- 48.King NM, Prabu-Jeyabalan M, Nalivaika EA, Wigerinck P, de Bethune MP, Schiffer CA. Structural and thermodynamic basis for the binding of TMC114, a next-generation human immunodeficiency virus type 1 protease inhibitor. J Virol. 2004;78:12012–21. doi: 10.1128/JVI.78.21.12012-12021.2004. [DOI] [PMC free article] [PubMed] [Google Scholar]
Associated Data
This section collects any data citations, data availability statements, or supplementary materials included in this article.


