Abstract
Previous reports have suggested that the two mitogen-activated protein kinases (MAPKs) in Dictyostelium discoideum, ERK1 and ERK2, can be directly activated in response to external cAMP even though these MAPKs play different roles in the developmental life cycle. To better characterize MAPK regulation, the levels of phosphorylated MAPKs were analyzed in response to external signals. Only ERK2 was rapidly phosphorylated in response to the chemoattractants, cAMP and folate. In contrast, the phosphorylation of ERK1 occurred as a secondary or indirect response to these stimuli and this phosphorylation was enhanced by cell-cell interactions, suggesting that other external signals can activate ERK1. The phosphorylation of ERK1 or ERK2 did not require the function of the other MAPK in these responses. Folate stimulation of a chimeric population of erk1− and gα4− cells revealed that the phosphorylation of ERK1 could be mediated through an intercellular signal other than folate. Loss of ERK1 function suppressed the developmental delay and the deficiency in anterior cell localization associated with gα5− mutants suggesting that ERK1 function can be down regulated through Gα5 subunit-mediated signaling. However, no major changes in the phosphorylation of ERK1 were observed in gα5− cells suggesting that the Gα5 subunit signaling pathway does not regulate the phosphorylation of ERK1. These findings suggest that the activation of ERK1 occurs as a secondary response to chemoattractants and that other cell-cell signaling mechanisms contribute to this activation. Gα5 subunit signaling can down regulate ERK1 function to promote prestalk cell development but not through major changes to the level of phosphorylated ERK1.
Keywords: MAPK, G protein signaling, Dictyostelium, phosphorylation, development, chemotaxis
1. Introduction
Mitogen-activated protein kinases (MAPKs) are important regulatory proteins in many different signaling pathways [1–5]. MAPKs have been associated with the regulation of cell growth and differentiation and therefore play critical roles in the eukaryotic development [6–8]. Extracellular signal regulated protein kinases (ERKs) are the most evolutionary conserved subgroup of MAPKs and these proteins are activated by MAPK kinases (MAP2Ks) that phosphorylate a threonine and a tyrosine residue within a conserved motif (TXY) located within the catalytic region [1, 4, 5, 9]. Antibodies directed against this phosphorylated motif have been useful for detecting the activation of MAPKs in many different organisms and this characterization of MAPK regulation has led to many insights about MAPK function [10]. Some closely related MAPKs, such as mammalian ERK1 and ERK2 (86% primary sequence identity) are co-activated and appear to share redundant roles [9, 11]. However, ERKs with less sequence identity, such as the budding yeast FUS3 and KSS1 (54% primary sequence identity), can also be co-activated by a common MAP2K but yet have very different roles in cell fate [2]. In this latter case, MAPK interactions with scaffolding proteins can provide pathway specificity and the predominant activation of one of the MAPKs [12, 13]. The specificity of MAPK activation and function is of general interest because of the important roles MAPKs play in developmental signaling pathways in a wide range of eukaryotes.
The soil amoebae Dictyostelium discoideum has only two MAPKs, ERK1 and ERK2 (39% primary sequence identity), and both play important roles in the developmental life cycle that allows solitary cells to aggregate and develop into a fruiting body structure consisting of a stalk and a mass of spores [3]. During this multicellular development, intercellular signaling mediated through G protein coupled receptors regulates the differentiation and sorting of prespore and prestalk cells within the aggregate and some of these signaling pathways involve MAPK activity. ERK2 function is essential for the cell aggregation process in which cells respond to and produce an extracellular cAMP signal that allows cells to chemotax toward each other [14–16]. The stimulation of cell surface cAMP receptors leads to ERK2 activation but interestingly this activation does not require the Gα2 and Gβ subunits of the G protein that couples with cAMP receptors [17, 18]. Genetic analysis has indicated that ERK2 down regulates the cAMP-specific phosphodiesterase RegA and thereby allows the accumulation of cAMP for internal signaling and the relay of external cAMP signaling [19]. A loss in ERK2 function results in an aggregation defective developmental phenotype because insufficient cAMP accumulates to relay the cAMP signal to other cells [15]. This aggregation deficiency can be corrected by developing erk2− cells in chimeric populations with wild-type cells that produce sufficient extracellular cAMP signaling but erk2− cells do not sort properly within these chimeric aggregates [14, 20, 21]. The aggregation deficiency of erk2− cells can also be suppressed by disrupting the regA gene to reduce cAMP phosphodiesterase activity [15, 19]. ERK2 is also activated in response to extracellular folate, another chemoattractant, and this activation does require the Gα4 and Gβ subunit that couple to folate receptors [22, 23]. Dictyostelium use this Gα4-mediated signaling pathway to forage for new bacterial food sources [24].
The activation and function of ERK1 in Dictyostelium development has not been characterized as well as the developmental role of ERK2. Earlier reports have suggested that ERK1 can be activated in response to external cAMP signaling and that this activation can be mediated by MEK1, the only Dictyostelium MAP2K identified by sequence similarity to other eukaryotic MAP2Ks [25, 26]. Loss of MEK or ERK1 function results in small aggregate formation and accelerated development consistent with both kinases functioning in the same pathway. A major challenge in characterizing ERK1 function has been the inability to detect phosphorylated ERK1 using antibodies that recognize the phosphorylated TXY motif of other MAPKs, such as ERK2 [21]. While the analysis of ERK1 activation has been quite limited, the phenotypic analysis of erk1- mutants suggests that ERK1 plays an important role in determining aggregate size and the rate of development. Developmental signaling pathways mediated by the Gα5 subunit can also regulate aggregate size and rate of development suggesting a possible connection between Gα5 and ERK1 function [27].
The phenotypic analyses of erk1− and erk2− strains indicate the two Dictyostelium MAPKs have different roles in development but some studies have suggested these MAPKs are co-activated in response to cAMP. In this report we identified an antibody that can detect the phosphorylated ERK1 protein and demonstrate that the phosphorylation of ERK1 does not occur synchronously with the phosphorylation of ERK2 when cells are stimulated by cAMP. The phosphorylation of ERK1 in response to folate was also examined because MAP2K activity is present to activate ERK2. The phosphorylation of ERK1 or ERK2 was examined in cells deficient in the other MAPK to evaluate whether or not the activation of one MAPK was dependent on the other. Finally, the role of ERK1 function in Gα5 signaling pathways was examined through an epistasis analysis of erk1− and gα5− mutations and an analysis of phosphorylated ERK1 in gα5− mutants. The results of this study suggest different mechanisms exist for the regulation of ERK1 and ERK2 function and that these differences might reflect the different contributions these MAPKs provide in development.
2. Materials and methods
2.1. Strains and Media
All Dictyostelium strains were isogenic with the wild-type strain KAx-3 except for the noted mutations. The creation of the erk1−, erk2−, gα4−, and gα5− strains has been previously reported [21, 23, 28, 29]. New erk1− strains in KAx-3 and JH10 backgrounds were created, using the previously described gene disruption construct and strategy because the initial erk1− strain did not exhibit the accelerated development phenotype described in other reports [25], possibly the result of secondary mutations. The erk1 gene was also disrupted in a gα5− strain to give a gα5−erk1− double mutant. Verification of the erk1 gene disruptions was conducted by PCR analysis using the oligonucleotides (sense strand) 5′-cgcggatccctcgagAATTAATGCCACCACCACCAACAAGTG -3′ and (antisense strand) 5′-GTATGGTGCCTGTGGATCTTCAGGATG -3′ (lower case nucleotides differ from those in the template DNA) (Supplementary Figure 1). Electroporation of Dictyostelium was performed as previously described [30]. GFP labeling of strains was accomplished by using the pTX-GFP vector as previously described [31]. Cells were grown axenically in HL-5 medium [32].
2.2. Analysis of phosphorylated MAPKs
Cells were grown in shaking cultures to mid log phase (~3 × 10⁶ cells/ml) and then harvested by centrifugation. Cells were washed once in phosphate buffer (12 mM NaH2PO4 adjusted to pH 6.1 with KOH) and suspended at 1 × 10⁸ cells/ml. Starved cells were shaken in a conical tube for 3–5 hours with pulses of 100 nM cAMP every 15 min except for the 15 min prior to an assay. For analysis of cAMP stimulation, cells were stimulated with 10 μM (high dose) or 100 nM (low dose) cAMP with or without vortexing and cell samples were collected and lysed at the indicated time by mixing with SDS-PAGE loading buffer on ice. Cell extracts were subjected to immunoblot analysis using a rabbit monoclonal antibody phospho-p42/44 MAPK (#4370, Cell Signaling Technology). For folate stimulation cell suspensions were shaken for 1 h prior to stimulation. Starved cells were also plated on Whatman filters (No. 50) at a density of 6×10⁷ cells per filter (42.5 mm diameter) and then placed on nonnutrient plates (15% agar in phosphate buffer) for the analysis of MAPKs during development on a solid surface. The biotinylated mitochondrial 3-methylcrotonyl-CoA carboxylase α (MCCC1) was used as a gel loading control and this protein was detected using HRP-Streptavidin as previously described [33].
2.3. Developmental morphology analysis
Cells were grown to mid-log phase (~3×10⁶ cells/ml) in shaking cultures or collected from cultures grown on petri dishes that had a recent medium change (within past 24 hrs). Cells were pelleted by centrifugation and washed in phosphate buffer. Cells were plated on nonnutrient plates from suspensions of 1 x10⁸ or less. For chimeric development, clonal populations were mixed at indicated ratios prior to plating cells on nonnutrient plates. Fluorescent images were detected and recorded using fluorescence microscopy.
3. Results
3.1. ERK1 is phosphorylated during early development
Earlier attempts to detect phosphorylated ERK1 in Dictyostelium extracts with polyclonal antibodies directed against the conserved phosphorylated TXY motif have been unsuccessful even though these antibodies recognize phosphorylated ERK2 [21, 23, 34]. These observations led to speculation that the Dictyostelium ERK1 might not be activated in a canonical manner or that amino residue differences surrounding the conserved motif might prevent antibody binding. However, the use of a monoclonal antibody directed against the same phosphorylated motif did allow for the detection of a protein in cell extracts that has a size consistent with that predicted for the ERK1 protein (61 kDa) (Figure 1A). The absence of this band in erk1− strains indicated ERK1 specificity and this specificity was further supported by the presence of a higher MW species in erk1− cells that express a GFP:ERK1 fusion protein (predicted 88 kDa). The phosphorylation of the GFP:ERK1 fusion protein was expected because this protein can functionally complement erk1− mutations [21]. The phosphorylated ERK1 band was significantly larger than the phosphorylated ERK2 band that can also be detected in the same blots. The relative intensities of the ERK1 and ERK2 bands suggests that the basal level of phosphorylated ERK1 might be greater than that of ERK2, at least after 1 h of starvation with no exogenous stimulation.
Figure 1.
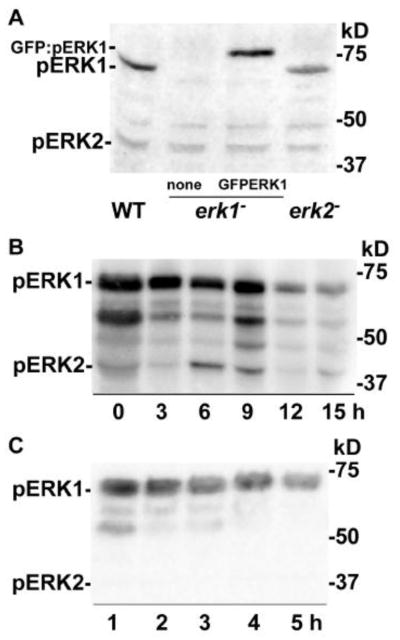
Detection of phosphorylated ERK1 protein. Dictyostelium strains were grown in shaking cultures and harvested as described in the Materials and methods. After starvation in shaking cultures or on filters cells were harvested and cell extracts were subjected to immunoblot analysis using the anti-phospho-MAPK antibody that detects phospho-ERK1 (pERK1, 61 kDa), GFP:phospho-ERK1 (GFP:pERK1, 88 kDa), and phospho-ERK2 (pERK2, 42 kDa). Extracts from approximately 1 × 10⁶ cells were loaded in each lane. (A) Cells shaken in phosphate buffer for 1 h before immunoblot analysis. Lanes correspond to extracts from wild-type cells (WT), erk1− cells, and erk1− cells expressing a GFP:ERK1 fusion protein (GFP:ERK1). Positions of protein molecular weight standards are indicated on the right side of the blot. (B) Cells were developed on filters as described in the Materials and methods and harvested at times indicated. (C) Cells were shaken in phosphate buffer without exogenous stimulation and collected at the times indicated.
3.2. Basal level of phosphorylated ERK1 during growth and early development
To determine if ERK1 is activated during early development the phosphorylation of ERK1 was examined in starved cells developing on nonnutrient agar plates. Phosphorylated ERK1 was detected throughout 15 h of development whereas phosphorylated ERK2 was detected primarily between the 6 and 9 h time points that correspond to the aggregation phase of development (Figure 1B). The phosphorylation of ERK1 was also examined in shaking cultures of starved cells that were pulsed with exogenous cAMP (100 nM) every 15 min after the 3 h time point to help facilitate early developmental progression under these conditions. In this analysis, basal levels of phosphorylated MAPKs were analyzed in cell extracts obtained 15 min after the last cAMP pulse. The levels of phosphorylated ERK1 were easily detected throughout the 5 h time course but phosphorylated ERK2 was not detected (Figure 1C). These results indicate different patterns of phosphorylation for ERK1 and ERK2 during early development and suggest that the phosphorylation of ERK1 is not as dependent on cAMP signaling as is the phosphorylation of ERK2. In some immunoblots phosphorylated ERK1 bands of lower size can be detected suggesting these bands might be possible degradation products. ERK1 contains an atypical amino terminal region with long runs of glutamine residues that are not found in other MAPKs and so this region might be subjected to unusual processing or degradation resulting in the smaller ERK1 species.
3.3. Phosphorylation of ERK1 is sensitive to disruption of cell-cell interactions
A previous study has suggested that ERK1 might be transiently activated in response to the stimulation of cell surface cAMP receptors [25]. Therefore, the level of phosphorylated ERK1 was analyzed immediately after exogenous cAMP stimulation. Cells stimulated with a high dose of exogenous cAMP (10 μM) with repeated vortexing displayed a slight rise in the level of phosphorylated ERK1 that peaked around 2 min. This pattern was different than the rapid rise in phosphorylated ERK2 that occurred within 1 min of cAMP stimulation. The rapid phosphorylation of ERK2 response was typical of that observed in earlier studies. The repeated vortexing during the cAMP stimulation disrupted the small aggregates that formed in the shaking suspension (data not shown) and this disruption might possibly affect endogenous signaling between cells. To determine if the mechanical disruption of cell aggregates affects the basal level of phosphorylated ERK1, cells were vortexed without exogenous cAMP stimulation. Under this condition the basal level of phosphorylated ERK1 gradually decreased over time suggesting that the phosphorylation of ERK1 might depend on cell-cell interactions (Figure 2B, C). These observations indicate that cell-cell interactions are important for maintaining levels of phosphorylated ERK1 during starvation and early development in the absence of exogenous cAMP signaling.
Figure 2.
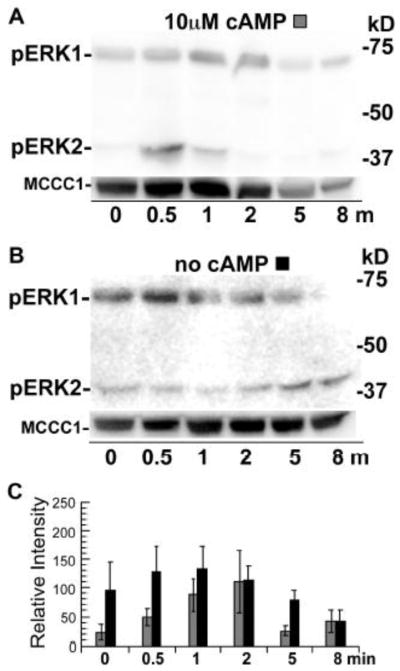
Phosphorylation of ERKs in wild-type cells treated with cAMP and vortexing. Cells were starved for 5 hours in shaking cultures and pulsed with cAMP for the last 2 hours to induce cAMP responsiveness as described in the Materials and methods section. Cells were harvested at times indicated after repeated vortexing with or without cAMP stimulation and then the resulting extracts were subjected to immunoblot analysis. Upper panels are immunoblots using the anti-phospho-MAPK antibody and lower panels are immunoblots that detect the loading control protein MCCC1. Each lane contained extracts from approximately 1 × 10⁶ cells. Exposure times varied for the chemiluminescent detection of different blots. (A) Cells were treated with 10 μM cAMP and repeated vortexing. (B) Cells were vortexed repeatedly without cAMP treatment. (C) Graph of the mean pixel intensity of the phosphorylated ERK1 bands of three immunoblots of multiple experiments. Gray and black shaded columns correspond to treatments (A) and (B), respectively. Error bars represent the standard deviation.
3.4. Phosphorylation of ERK1 is a secondary response to cAMP signaling
The stimulation of cell suspensions with cAMP but without the mechanical disruption of cell-cell interactions (i.e., no vortexing treatment) resulted in a rapid increase of phosphorylated ERK2 and then a robust increase in the level of phosphorylated ERK1 as the level of phosphorylated ERK2 decreased (Figure 3A, D). The late rise in phosphorylated ERK1 under these conditions suggests that the phosphorylation of ERK1 might be a secondary response to cAMP that requires cell-cell interactions. Interestingly, the level of phosphorylated ERK1 persisted for a much longer period than the level of phosphorylated ERK2 in response to the cAMP stimulation. An earlier study has shown a correlation in the duration of phosphorylated ERK2 levels and the levels of extracellular cAMP [17]. Therefore, phosphorylated ERK1 levels were also examined after cells were stimulated with a low dose of cAMP (100 nM) stimulation to determine if this treatment shortens the duration of the phosphorylated ERK1 response. Under these conditions the level of phosphorylated ERK1 decreased by the 8 min time point indicating the concentration of the exogenous cAMP impacts the duration of the phosphorylate ERK1 response (Figure 3B, D). The rise in phosphorylated ERK1 did not occur in a mock experiment that omitted the cAMP stimulation indicating that this response is dependent on the initial stimulation with exogenous cAMP (Figure 3C). These results suggest that cAMP stimulation of developing cells can induce the phosphorylation of ERK1 as a secondary or indirect response after an initial rise in phosphorylated ERK2 and that this response is dependent on cell-cell interactions and the dosage of the exogenous signal.
Figure 3.
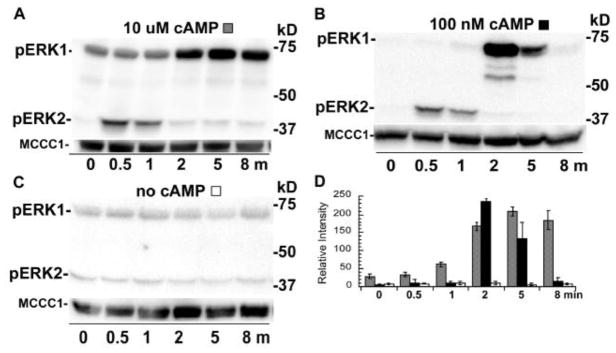
Phosphorylation of ERKs in wild-type cells stimulated with cAMP but without vortexing. Cells were prepared, treated, and analyzed as described in Figure 2 except that cAMP stimulation was conducted while cells were continuously shaken at 200 rpm in conical tubes (no vortexing). (A) Wild-type cells stimulated with 10 μM cAMP. (B) Wild-type cells stimulated with 100 nM cAMP. (C) Wild-type cells not stimulated with cAMP. (D) Graph of the mean pixel intensity of the phosphorylated ERK1 bands of three immunoblots from multiple experiments. Gray and black shaded and open columns correspond to treatments (A), (B), and (C), respectively. Error bars represent the standard deviation.
3.5. Phosphorylation of ERK1 does not require ERK2 function
The increase in the level of phosphorylated ERK1 as the level of phosphorylated ERK2 decreases suggests a possible coordination between these responses, such that ERK1 phosphorylation response might depend on ERK2 function. Therefore, the level of phosphorylated ERK1 was examined in an erk2− strain to explore a possible role of ERK2 function in this response. It is important to note that the erk2− strain used in this analysis, like the erk2− strains used in previous Dictyostelium studies, has reduced but not absent ERK2 expression due to an insertion mutation (a recapitulated REMI mutation) located near the erk2 gene [15]. Using erk2− cells with this allele, treatment with a high or low dose of cAMP resulted in a subtle rise in phosphorylated ERK2 but a robust secondary rise in phosphorylated ERK1 with approximately the same kinetics as previously observed with wild-type cells (Figure 4A, B, D). The variability of this response to the low dose of cAMP was greater than that observed at the high dose but the basis of this variability has not been determined (Figure 4D). The level of phosphorylated ERK1 after cell stimulation with the high dose of cAMP did not persist as long as that observed for wild-type cells suggesting that the duration of the phosphorylated ERK1 response might not be as extensive in the erk2− cells. The dependency of the phosphorylated ERK2 response on ERK1 function was also examined. The stimulation of erk1− cells with a low dose of cAMP resulted in an abundant level of phosphorylated ERK2 with no major changes in the temporal pattern of this response (Figure 4C). These results indicate that the phosphorylation of ERK1 or ERK2 does not require the function of the other MAPK.
Figure 4.
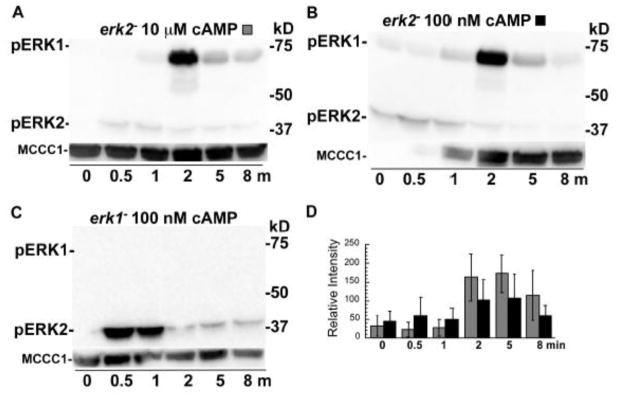
Phosphorylation of ERKs in erk2− cells stimulated with cAMP. Cells were prepared, treated, and analyzed as described in Figure 3. (A) erk2− cells stimulated with 10 μM cAMP. (B) erk2− cells stimulated with 100 nM cAMP. Uneven detection of MCCC1 is responsible for low band intensity in the early time points of the control blot (coomassie staining of blotted gel displayed equal loading) (C) erk1− cells stimulated with 100 nM cAMP. (D) Graph of the mean pixel intensity of the phosphorylated ERK1 bands of three immunoblots of multiple experiments. Gray and black shaded columns correspond to treatments (A) and (B), respectively. Error bars represent the standard deviation.
3.6. Folate signaling results in a secondary rise in phosphorylated ERK1
The stimulation of starved cells with folate leads to the rapid phosphorylation and activation of ERK2 and so the level of ERK1 phosphorylation was also examined under these conditions. Cells starved for 1 h and then treated with folate without mechanical disruption (i.e., without vortexing) displayed a rapid increase in phosphorylated ERK2, as expected from previous studies (Fig. 5A, C). This response was followed by a rise in phosphorylated ERK1 indicating that folate, like cAMP, can stimulate a secondary response that leads to the phosphorylation of ERK1. The phosphorylation of ERK1 was also observed after folate stimulation of erk2− cells indicating the phosphorylation of ERK1 was not dependent on ERK2 function under these conditions as well (Figure 5B, C). The abundance of the lower band of phosphorylated ERK1 was quite variable in the folate stimulated erk2− cells. These findings suggest that the phosphorylated ERK1 responses to folate are similar to the responses observed after cAMP stimulation.
Figure 5.
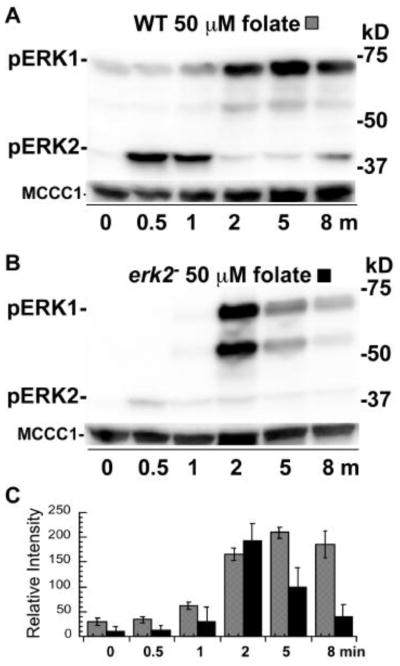
Phosphorylation of ERKs in wild-type and erk2− cells stimulated with folate. Cells were starved in phosphate buffer for 1 hour and folate stimulation was conducted while cells were continuously shaken at 200 rpm in conical tubes (no vortexing). (A) Wild-type cells stimulated with 50 μM folate. (B) erk2− cells stimulated with 50 μM folate. (C) Graph of the mean pixel intensity of the phosphorylated ERK1 bands of three immunoblots of multiple experiments. Gray and black shaded columns correspond to treatments (A) and (B), respectively. Error bars represent the standard deviation.
3.7. Phosphorylation of ERK1 can be mediated by intercellular signaling
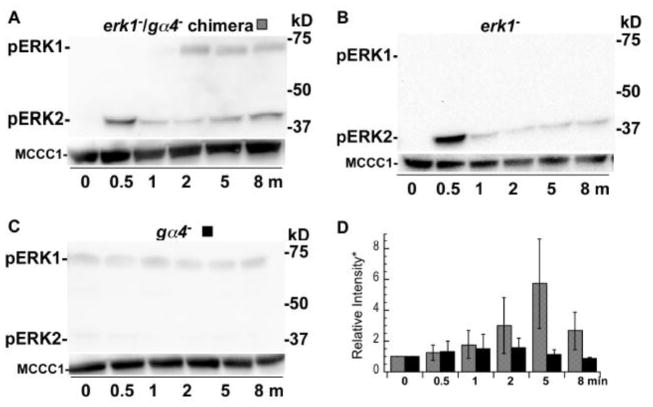
The late rise in phosphorylated ERK1 in response to cAMP and folate stimulation possibly indicates the existence of a secondary signaling mechanism that is triggered by some component of the initial response. Stimulated cells might produce other external signals that stimulate an ERK1-specific signaling pathway. To test this latter possibility, the phosphorylation of ERK1 was analyzed in a chimeric population of erk1− and gα4− cells stimulated by folate. Only the erk1− cells in this population can respond to folate because the Gα4 subunit is required for most, if not all, folate responses, including the activation of ERK2 [22, 23]. However, only the gα4− cells express ERK1 in this population and so the phosphorylation of ERK1 can only occur if the gα4− cells are stimulated by a signal originating from the folate-stimulated erk1− cells. An equal mixture of erk1− and gα4− cells was stimulated with folate and the expected rise in the phosphorylation of ERK2 was observed within the first 2 min (Figure 6A, D). A low but reproducible rise in phosphorylated ERK1 was observed soon after suggesting that the folate stimulated erk1− cells produce an intercellular signal that leads to the phosphorylation of ERK1 in gα4− cells. The low intensity of this secondary response suggests that mechanisms other than intercellular signaling contribute to the activation of ERK1. In control experiments, folate-stimulated clonal gα4− cells did not exhibit a rise in phosphorylated ERK1 and folate-stimulated erk1− cells did not display any phosphorylated ERK1 (Fig. 6B, C, D). However, ERK2 was phosphorylated in erk1− cells stimulated with folate providing additional evidence that the phosphorylation of ERK2 is not dependent on ERK1 function.
Figure 6.
Phosphorylation of ERKs in erk1−, gα4− chimeric and clonal cell populations stimulated with folate. Cells were prepared and stimulated with folate as described in figure 5. (A) Chimeric population of erk1− and gα4− cells mixed in a 1:1 ratio and stimulated with 50 μM folate. (B) erk1− cells only stimulated with 50 μM folate. (C) gα4− cell only stimulated with 50 μM folate. (D) Graph of the mean pixel intensity of the phosphorylated ERK1 bands of three or more immunoblots of multiple experiments (*values have been normalized to the 0 min time mean intensity). Gray and black shaded columns correspond to treatments (A) and (C), respectively. Error bars represent the standard deviation.
3.7. Loss of ERK1 accelerates the developmental delay of gα5− cells
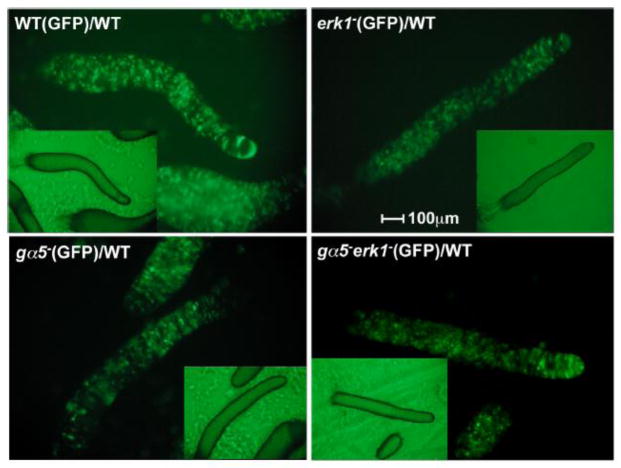
The loss of ERK1 or the overexpression of the Gα5 subunit both result in small aggregate formation and accelerated development whereas the over-expression of ERK1 or the loss of Gα5 subunit both result in delayed development. The similarity of these phenotypes suggests that the Gα5 signaling pathway might possibly include the regulation of ERK1 function. To examine the epistatic relationship between the gα5− and erk1− mutations, a double gα5−erk1− mutant was created and examined for developmental morphology. When starved, the double mutant formed small aggregates that progressed rapidly through development (Figure 7). Although slightly larger than the erk1− aggregates, gα5−erk1− aggregates were significantly smaller than gα5− and wild-type aggregates and the accelerated developmental progression of the double mutant was more closely matched to that of the erk1− aggregates. The gα5−erk1− phenotype indicates that the erk1− mutation is epistatic to the gα5− mutation with respect to temporal and morphological development. This finding suggests that the developmental defects associated with the loss of Gα5 function might result from the inability to down regulate ERK1 function.
Figure 7.
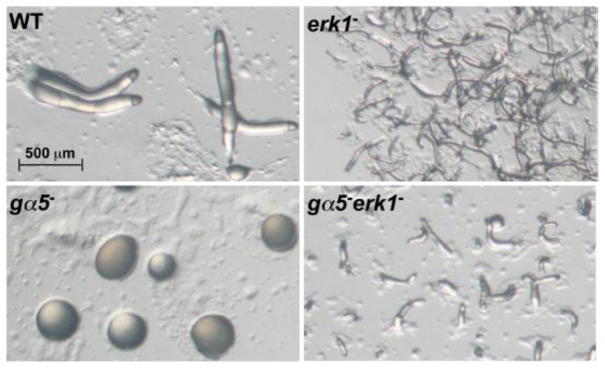
Developmental morphology of wild-type (WT), erk1−, gα5−, and gα5−erk1− aggregates. Strains were grown and plated for development on nonnutrient plates as described in the Materials and methods. Images of developmental morphology were recorded at 13 h post starvation. All images are shown at the same magnification.
3.8 Loss of ERK1 corrects the anterior localization defect of gα5− cells
When developed with an excess of wild-type cells, gα5− cells are abundant in most areas of the chimeric aggregate except in the extreme anterior region (Figure 8). This anterior region is referred to as the prestalk A (pst A) region and this region is populated by prestalk cells that express the ecmA gene. In contrast, erk1− cells are very abundant in the anterior and posterior regions of chimeric aggregates indicating that the localization of erk1− cells differs from that of the gα5− cells. The gα5−erk1− double mutant cells were found in all regions of chimeric aggregates, including the pstA region, suggesting that the erk1− mutation masks the cell localization defect associated with the gα5− mutation. The ability of the erk1− mutation to correct the cell localization defect associated with the gα5− mutation suggests that the defect in the ability of gα5− cells to develop as pst A prestalk cells might be attributed to unregulated ERK1 function. These results are consistent with the Gα5 subunit functioning in the development of prestalk cells through the down regulation of ERK1 function.
Figure 8.
Spatial distribution of erk1− and gα5− mutants in chimeras with wild-type cells. Wild-type (WT), erk1−, gα5−, and gα5−erk1− cells were labeled with a GFP expression vector and mixed with an excess of unlabeled wild-type cells (1:10 ratio) before plating for development. GFP fluorescence in migratory slugs was recorded at 16 h of development. Insets show brightfield images (2 fold size reduction). The central slug in each image is positioned with the anterior on the right side of the image.
3.9. Gα5 function does not affect the pattern of phosphorylated ERK1
A possible mechanism for Gα5 signaling to down regulate ERK1 function is to reduce the abundance of phosphorylated ERK1. The external signal that stimulates the Gα5-mediated signaling pathway remains to be determined but the loss of Gα5 function enhances folate chemotaxis and increases aggregate size during development suggesting Gα5 signaling indirectly affects folate and cAMP signaling. The stimulation of gα5− cells with cAMP or folate resulted in a typical secondary response of phosphorylated ERK1 as compared to that in wild-type cells (Figure 9). Interestingly, the folate-stimulated gα5− cells displayed a higher level of phosphorylated ERK2 than cells stimulated with cAMP. This difference might be attributed to the delayed development of gα5− cells that could possibly affect the onset of cAMP responsiveness. The similar patterns in the level of phosphorylated ERK1 in gα5− cells compared to wild-type cells suggest that Gα5 signaling pathway does not down regulate the function of ERK1 through reducing the level of phosphorylation of ERK1. These observations do not exclude the possibility that other signals, perhaps ones that specifically activate the Gα5 pathway, might down regulate the phosphorylation of ERK1.
Figure 9.
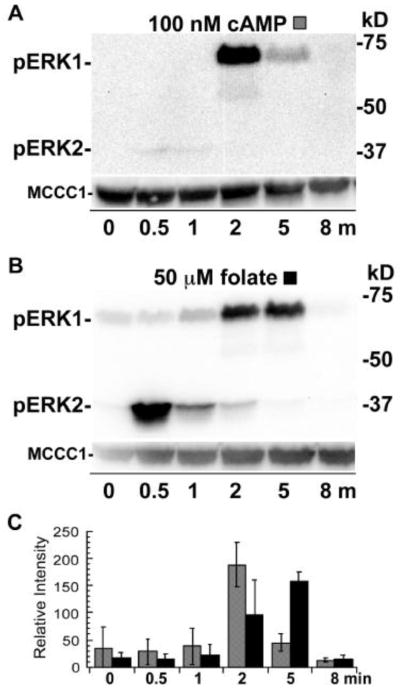
Phosphorylation of ERKs in gα5− cells stimulated with cAMP or folate. (A) gα5− cells were prepared and treated with 100 nM cAMP as described in Figure 3. (B) gα5− were prepared and treated with 50 μM folate as described in Figure 5. (C) Graph of the mean pixel intensity of the phosphoERK1 bands of three immunoblots of multiple experiments. Gray and black shaded and open columns correspond to treatments (A) and (B), respectively. Error bars represent the standard deviation.
4. Discussion
The increase in phosphorylated ERK1 after the level of phosphorylated ERK2 peaked in cAMP stimulated cells was unexpected because an earlier study had suggested that ERK1 activity peaked within 30 s after cAMP stimulation [25]. However, this earlier study had examined in vitro kinase activity associated with an immunoprecipitated complex of an epitope-tagged ERK1 and so the detected protein kinase activity might have been associated with other kinases present in that immune complex. The detection of phosphorylated ERK1 is expected to be a better determinant of ERK1 activation because of the strong correlation that exists between the phosphorylation of the TXY motif and MAPK activation in eukaryotic signaling pathways [9]. The temporal difference in the phosphorylation of ERK1 and ERK2 after chemoattractant stimulation and the different patterns in the basal levels of phosphorylated ERK1 and ERK2 are consistent with these MAPKs playing different roles in early Dictyostelium development. These different roles are also supported by the phenotypic differences observed for erk1− and erk2− cells as they progress through development.
The rise in phosphorylated ERK1 as a secondary response to external cAMP or folate stimulation could potentially contribute to the adaptation of cells to these signals. The endogenous cAMP signaling between aggregating cells occurs as a pulsatile signal approximately every 6 min and during this period cells chemotax, adapt, and re-sensitize so that they can respond to the next pulse of cAMP. Folate stimulation does not involve a pulsatile signal but the response is likely to require an adaptation process, typically found in other eukaryotic chemotactic responses [35]. Stimulation of Dictyostelium with either cAMP or folate results in a rapid accumulation of cGMP that peaks within 15 s and a slightly slower accumulation of cAMP that peaks about 2 min after stimulation [36–38]. The accumulation of cAMP is likely to be regulated in part by the down regulation of the cAMP-specific phosphodiesterase RegA by active ERK2 and the cessation of cAMP accumulation could possibly be attributed to the loss of ERK2 activity and a gain of RegA activity [19]. However, the rise in phosphorylated ERK1 at this time opens the possibility that ERK1 function might be in part responsible for reducing the accumulation of cAMP through the regulation of phosphodiesterase or adenylyl cyclase activity. The presence of multiple putative MAPK phosphorylation sites on RegA offers the possibility of differential regulation by the two MAPKs. The accelerated development of erk1− cells is similar to the phenotypes observed for mutants that have elevated cAMP signaling. For example, the loss of RegA phosphodiesterase activity or the overexpression of the PKA catalytic subunit, PKA-C, both result in precocious development. [25, 39–41]. This correlation between the rate of development and cAMP signaling suggest that ERK1 function might prevent precocious development through the limitation of cAMP signaling.
The contribution of cell-cell interactions to the phosphorylation of ERK1 suggests that signals other than cAMP and folate can regulate this response as illustrated in our model of ERK1 regulation (Figure 10). Dictyostelium has over fifty G protein-coupled receptors and possibly other types of receptors that might function in the pathway leading to the phosphorylation of ERK1 [42, 43]. Several external stimulants of Dictyostelium besides cAMP and folate have been identified but none have been examined for possible roles in ERK1 activation [44, 45]. Intercellular signaling presumably becomes more efficient and important as cells begin to adhere to each other during the aggregation stage of development. The onset of cell-cell adhesion occurs as cells become responsive to cAMP and this adhesion allows cells form streams as they aggregate into mounds [46]. Chemotactic responses to folate do not facilitate cell-cell adhesion but groups of cells can chemotax to folate while in contact with each other (unpublished results). The relatively weak phosphorylation of ERK1 in gα4− cells stimulated by an external signal other than folate suggests that cell autonomous signaling also contributes a significant role in ERK1 activation. The mechanism by which this cell autonomous signaling occurs remains to be identified.
Figure 10.
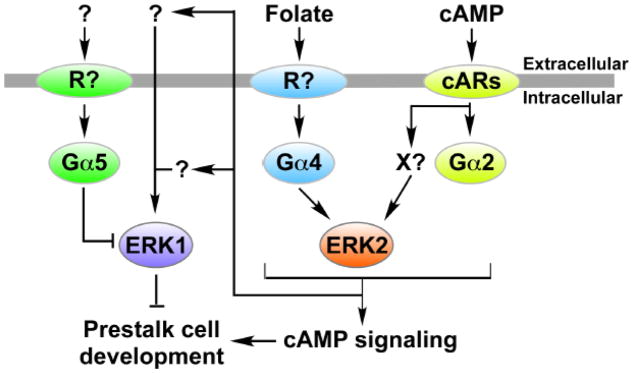
Model of ERK1 activation with respect to G protein signaling pathways. Signals mediated by G protein signaling pathways in response to cAMP and folate activate ERK2 but then later lead to the activation of ERK1 in a secondary response. ERK1 can also be activated through intercellular signaling. The Gα5-mediated signaling pathway can down regulate ERK1 function but not through changing the phosphorylated state of ERK1.
The function of ERK1 to increase aggregate size and prevent precocious cell differentiation acts in opposition to the Gα5 subunit-mediated signaling pathway that promotes rapid development and small aggregate size. The Gα5 subunit promotes the development of the anterior prestalk region as indicated by Gα5 dependent changes in anterior tip formation and prestalk gene (i.e., ecmA) expression. The suppression of gα5− developmental phenotypes through the loss of ERK1 argues that Gα5 subunit-mediated signaling pathways down regulate ERK1 function. Based on the analysis of phosphorylated ERK1 in gα5− mutants this down regulation does not appear to affect levels of activated ERK1. However, ERK1 function could be regulated through other mechanisms such as sequestering active ERK1 from target substrates. MAPK binding sites (D-motifs) such as those found on Gα5 subunit or other proteins could potentially regulate ERK1 function through limiting the cellular distribution of ERK1. In yeast, a D-motif in the mating response Gα subunit has been proposed to down regulate MAPK function through altering the cytoplasmic/nuclear localization of the MAPK [47, 48]. The D-motif of the Dictyostelium Gα5 subunit is required for the precocious development of small aggregates associated with Gα5 subunit overexpression suggesting that Gα5 function might be mediated through MAPK interactions [27].
5. Conclusion
The temporal differences in the phosphorylation of ERK1 and ERK2 are consistent with these MAPKs providing different functions in developmental and chemotactic signaling. Previous studies have indicated that ERK2 function is important for increased cAMP signaling. The timing of ERK1 activation suggests this MAPK might contribute to a decrease in cAMP signaling, perhaps as part of an adaptation process. The limited sequence similarity between these MAPKs also supports the idea that each MAPK has a different role in development but does not rule out the possibility of competitive interactions with other signaling components in their signaling pathways. Results of the genetic analysis suggest that the Gα5 subunit signaling pathway down regulates ERK1 function but the specific mechanism does not appear to involve a reduction in activated ERK1. The ability to detect both phosphorylated ERK1 and ERK2 is an important tool for characterizing the specificity of MAPK signaling in Dictyostelium and further analysis of ERK1 and ERK2 regulation will likely provide important insight into the interactions of these MAPKs with other signaling components during chemotaxis and development.
Supplementary Material
Highlights.
ERK1 is phosphorylated as a secondary response to cAMP and folate.
Cell-cell interactions contribute to the phosphoryation of ERK1.
Loss of ERK1 suppresses the developmental delays of gα5− mutants.
Acknowledgments
The authors thank N. Kuburich and N. Adhikari for critical reading and discussion and J. Miller for technical assistance. This work was supported by the grants NIGMS R15 GM097717-01 and OCAST HR13-36 provided to JAH.
Abbreviations
- MAPK
mitogen activated protein kinase
- ERK
extracellular-signal regulate kinase
- cAMP
cyclic adenosine monophosphate
- Pst A
prestalk A
- MCCC1
mitochondrial 3-methylcrotonyl-CoA carboxylase α
Footnotes
Publisher's Disclaimer: This is a PDF file of an unedited manuscript that has been accepted for publication. As a service to our customers we are providing this early version of the manuscript. The manuscript will undergo copyediting, typesetting, and review of the resulting proof before it is published in its final citable form. Please note that during the production process errors may be discovered which could affect the content, and all legal disclaimers that apply to the journal pertain.
References
- 1.Bogoyevitch MA, Court NW. Cell Signal. 2004;16:1345–1354. doi: 10.1016/j.cellsig.2004.05.004. [DOI] [PubMed] [Google Scholar]
- 2.Chen RE, Thorner J. Biochim Biophys Acta. 2007;1773:1311–1340. doi: 10.1016/j.bbamcr.2007.05.003. [DOI] [PMC free article] [PubMed] [Google Scholar]
- 3.Hadwiger JA, Nguyen HN. Biomol Concepts. 2011;2:39–46. doi: 10.1515/BMC.2011.004. [DOI] [PMC free article] [PubMed] [Google Scholar]
- 4.Pimienta G, Pascual J. Cell Cycle. 2007;6:2628–2632. doi: 10.4161/cc.6.21.4930. [DOI] [PubMed] [Google Scholar]
- 5.Raman M, Chen W, Cobb MH. Oncogene. 2007;26:3100–3112. doi: 10.1038/sj.onc.1210392. [DOI] [PubMed] [Google Scholar]
- 6.Bessard A, Fremin C, Ezan F, Fautrel A, Gailhouste L, Baffet G. Oncogene. 2008;27:5315–5325. doi: 10.1038/onc.2008.163. [DOI] [PubMed] [Google Scholar]
- 7.Krens SF, Corredor-Adamez M, He S, Snaar-Jagalska BE, Spaink HP. BMC Genomics. 2008;9:196. doi: 10.1186/1471-2164-9-196. [DOI] [PMC free article] [PubMed] [Google Scholar]
- 8.Pages G, Pouyssegur J. Methods Mol Biol. 2004;250:155–166. doi: 10.1385/1-59259-671-1:155. [DOI] [PubMed] [Google Scholar]
- 9.Cargnello M, Roux PP. Microbiol Mol Biol Rev. 2011;75:50–83. doi: 10.1128/MMBR.00031-10. [DOI] [PMC free article] [PubMed] [Google Scholar]
- 10.Bardwell L, Shah K. Methods. 2006;40:213–223. doi: 10.1016/j.ymeth.2006.06.008. [DOI] [PMC free article] [PubMed] [Google Scholar]
- 11.Lloyd AC. J Biol. 2006;5:13. doi: 10.1186/jbiol46. [DOI] [PMC free article] [PubMed] [Google Scholar]
- 12.Flatauer LJ, Zadeh SF, Bardwell L. Mol Cell Biol. 2005;25:1793–1803. doi: 10.1128/MCB.25.5.1793-1803.2005. [DOI] [PMC free article] [PubMed] [Google Scholar]
- 13.Good M, Tang G, Singleton J, Remenyi A, Lim WA. Cell. 2009;136:1085–1097. doi: 10.1016/j.cell.2009.01.049. [DOI] [PMC free article] [PubMed] [Google Scholar]
- 14.Gaskins C, Clark AM, Aubry L, Segall JE, Firtel RA. Genes Dev. 1996;10:118–128. doi: 10.1101/gad.10.1.118. [DOI] [PubMed] [Google Scholar]
- 15.Segall JE, Kuspa A, Shaulsky G, Ecke M, Maeda M, Gaskins C, Firtel RA, Loomis WF. J Cell Biol. 1995;128:405–413. doi: 10.1083/jcb.128.3.405. [DOI] [PMC free article] [PubMed] [Google Scholar]
- 16.Aubry L, Maeda M, Insall R, Devreotes PN, Firtel RA. J Biol Chem. 1997;272:3883–3886. doi: 10.1074/jbc.272.7.3883. [DOI] [PubMed] [Google Scholar]
- 17.Brzostowski JA, Kimmel AR. Mol Biol Cell. 2006;17:4220–4227. doi: 10.1091/mbc.E06-05-0376. [DOI] [PMC free article] [PubMed] [Google Scholar]
- 18.Maeda M, Aubry L, Insall R, Gaskins C, Devreotes PN, Firtel RA. J Biol Chem. 1996;271:3351–3354. doi: 10.1074/jbc.271.7.3351. [DOI] [PubMed] [Google Scholar]
- 19.Maeda M, Lu S, Shaulsky G, Miyazaki Y, Kuwayama H, Tanaka Y, Kuspa A, Loomis WF. Science. 2004;304:875–878. doi: 10.1126/science.1094647. [DOI] [PubMed] [Google Scholar]
- 20.Wang Y, Liu J, Segall JE. J Cell Sci. 1998;111:373–383. doi: 10.1242/jcs.111.3.373. [DOI] [PubMed] [Google Scholar]
- 21.Nguyen HN, Raisley B, Hadwiger JA. Cell Signal. 2010;22:836–847. doi: 10.1016/j.cellsig.2010.01.008. [DOI] [PMC free article] [PubMed] [Google Scholar]
- 22.Maeda M, Firtel RA. J Biol Chem. 1997;272:23690–23695. doi: 10.1074/jbc.272.38.23690. [DOI] [PubMed] [Google Scholar]
- 23.Nguyen HN, Hadwiger JA. Developmental Biology. 2009;335:385–395. doi: 10.1016/j.ydbio.2009.09.011. [DOI] [PMC free article] [PubMed] [Google Scholar]
- 24.Pan P, Hall EM, Bonner JT. Nature (London) New Biol. 1972;237:181–182. doi: 10.1038/newbio237181a0. [DOI] [PubMed] [Google Scholar]
- 25.Sobko A, Ma H, Firtel RA. Dev Cell. 2002;2:745–756. doi: 10.1016/s1534-5807(02)00186-7. [DOI] [PubMed] [Google Scholar]
- 26.Ma H, Gamper M, Parent C, Firtel RA. Embo J. 1997;16:4317–4332. doi: 10.1093/emboj/16.14.4317. [DOI] [PMC free article] [PubMed] [Google Scholar]
- 27.Raisley B, Nguyen HN, Hadwiger JA. Microbiology. 2010;156:789–797. doi: 10.1099/mic.0.036541-0. [DOI] [PMC free article] [PubMed] [Google Scholar]
- 28.Hadwiger JA, Firtel RA. Genes Dev. 1992;6:38–49. doi: 10.1101/gad.6.1.38. [DOI] [PubMed] [Google Scholar]
- 29.Hadwiger JH, Natarajan K, Firtel RA. Development. 1996;122:1215–1224. doi: 10.1242/dev.122.4.1215. [DOI] [PubMed] [Google Scholar]
- 30.Hadwiger JA. Developmental Biology. 2007;312:1–12. doi: 10.1016/j.ydbio.2007.08.017. [DOI] [PMC free article] [PubMed] [Google Scholar]
- 31.Levi S, Polyakov M, Egelhoff TT. Plasmid. 2000;44:231–238. doi: 10.1006/plas.2000.1487. [DOI] [PubMed] [Google Scholar]
- 32.Watts DJ, Ashworth JM. Biochem J. 1970;119:171–174. doi: 10.1042/bj1190171. [DOI] [PMC free article] [PubMed] [Google Scholar]
- 33.Davidson AJ, King JS, Insall RH. Biotechniques. 2013;55:39–41. doi: 10.2144/000114054. [DOI] [PubMed] [Google Scholar]
- 34.Schenk PW, Epskamp SJ, Knetsch ML, Harten V, Lagendijk EL, van Duijn B, Snaar-Jagalska BE. Biochemical and biophysical research communications. 2001;282:765–772. doi: 10.1006/bbrc.2001.4649. [DOI] [PubMed] [Google Scholar]
- 35.Foxman EF, Kunkel EJ, Butcher EC. J Cell Biol. 1999;147:577–588. doi: 10.1083/jcb.147.3.577. [DOI] [PMC free article] [PubMed] [Google Scholar]
- 36.Sun TJ, Van Haastert PJ, Devreotes PN. J Cell Biol. 1990;110:1549–1554. doi: 10.1083/jcb.110.5.1549. [DOI] [PMC free article] [PubMed] [Google Scholar]
- 37.van Haastert PJ. Biochim Biophys Acta. 1985;846:324–333. doi: 10.1016/0167-4889(85)90002-3. [DOI] [PubMed] [Google Scholar]
- 38.Srinivasan J, Gundersen RE, Hadwiger JA. Dev Biol. 1999;215:443–452. doi: 10.1006/dbio.1999.9474. Record as supplied by publisher. [DOI] [PubMed] [Google Scholar]
- 39.Loomis WF. Microbiol Mol Biol Rev. 1998;62:684–694. doi: 10.1128/mmbr.62.3.684-694.1998. [DOI] [PMC free article] [PubMed] [Google Scholar]
- 40.Shaulsky G, Escalante R, Loomis WF. Proc Natl Acad Sci U S A. 1996;93:15260–15265. doi: 10.1073/pnas.93.26.15260. [DOI] [PMC free article] [PubMed] [Google Scholar]
- 41.Shaulsky G, Fuller D, Loomis WF. Development. 1998;125:691–699. doi: 10.1242/dev.125.4.691. [DOI] [PubMed] [Google Scholar]
- 42.Insall R. Genome Biol. 2005;6:222. doi: 10.1186/gb-2005-6-6-222. [DOI] [PMC free article] [PubMed] [Google Scholar]
- 43.Prabhu Y, Eichinger L. Eur J Cell Biol. 2006;85:937–946. doi: 10.1016/j.ejcb.2006.04.003. [DOI] [PubMed] [Google Scholar]
- 44.Gomer RH, Jang W, Brazill D. Dev Growth Differ. 2011;53:482–494. doi: 10.1111/j.1440-169X.2010.01248.x. [DOI] [PMC free article] [PubMed] [Google Scholar]
- 45.Saito T, Taylor GW, Yang JC, Neuhaus D, Stetsenko D, Kato A, Kay RR. Biochim Biophys Acta. 2006;1760:754–761. doi: 10.1016/j.bbagen.2005.12.006. [DOI] [PubMed] [Google Scholar]
- 46.Siu CH, Sriskanthadevan S, Wang J, Hou L, Chen G, Xu X, Thomson A, Yang C. Dev Growth Differ. 2011;53:518–527. doi: 10.1111/j.1440-169X.2011.01267.x. [DOI] [PubMed] [Google Scholar]
- 47.Blackwell E, Halatek IM, Kim HJ, Ellicott AT, Obukhov AA, Stone DE. Mol Cell Biol. 2003;23:1135–1150. doi: 10.1128/MCB.23.4.1135-1150.2003. [DOI] [PMC free article] [PubMed] [Google Scholar]
- 48.Metodiev MV, Matheos D, Rose MD, Stone DE. Science. 2002;296:1483–1486. doi: 10.1126/science.1070540. [DOI] [PubMed] [Google Scholar]
Associated Data
This section collects any data citations, data availability statements, or supplementary materials included in this article.


