Abstract
In this study, we formulated polyplexes with different compositions for co-delivery of DNA and small-interfering RNA (siRNA). Since DNA and siRNA have distinctive and complementary morphological characteristics (DNA is long and winding and siRNA is short and rigid), we hypothesized that their co-delivery using polyplex would enhance each other's transfection. To test this hypothesis, cationic polymer branched polyethylenimine (bPEI) as a standard transfecting agent and its derivative arginine-rich oligopeptide-grafted bPEI modified with polyethylene glycol (P(SiDAAr)5P3), synthesized in our laboratory, were used as carriers for transfection. Polyplexes at different nucleic acid to polymer weight ratios were characterized for transfection in breast cancer sensitive (MCF-7) and resistant (MCF-7/Adr) cell lines. Gene silencing effect of polyplexes was determined in MDA-MB-231-luc-D3H2LN cell line. The results demonstrated that the polyplexes formed with derivative P(SiDAAr)5P3 show significantly lower toxicity compared to polyplexes formed using bPEI. Further, co-delivery resulted in 20-fold higher DNA transfection and 2-fold higher siRNA transfection as compared to the respective single nucleotide delivery. DNA transfection was ∼100 fold lower in resistant MCF-7/Adr cells than in sensitive MCF-7 cells. Confocal imaging and flow cytometry data demonstrated that enhanced transfection does not solely depend on DNA's cellular uptake, suggesting that other mechanisms contribute to increased transfection. DNA-co-siRNA delivery could be a promising therapeutic approach to achieve synergistic effects, because it can simultaneously target and interfere with multiple regulatory levels in a cell to halt and reverse disease progression.
Keywords: combination therapy, non-viral gene delivery, cancer therapy, cationic polymers, cellular uptake
1. Introduction
The discovery of siRNA has drawn much attention to gene therapy in the last few years, particularly for its usefulness in targeting a number of genetic diseases.1-4 However, challenges remain in gene therapies, including low transfection efficiencies, particularly with non-viral vectors, as well as in achieving therapeutic effects at a tolerable dose. Many diseases are the result of single gene mutations. Yet, single gene disorders are not common in the population. Therefore, simultaneously targeting multiple genetic components and regulatory pathways pose the possibility of reaching a greater therapeutic potential for a number of diseases, including cancer.5 In addition, DNA and siRNA's different physical characteristics (size, morphology, rigidity and charge) could cause them to have different electrostatic interaction strength with cationic polymers like PEI, thus changing the binding affinity of the polyplexes.6
Polyethylenimine (PEI) is a commonly used nucleic acid delivery vehicle.7 It condenses nucleotides through electrostatic interactions, protects them from nuclease degradation and facilitates endosomal escape.8, 9 The cationic charges on the polyplex surface also promote cellular uptake through adsorptive endocytosis.10, 11 Despite its promising features, a number of drawbacks hinder it from achieving its therapeutic potential. For example, interaction of the high cationic charge of PEI with the anionic cell surface can destabilize the plasma-membrane and induce toxicity.12, 13 PEI could also interact with negatively charged serum proteins (such as albumin) and red blood cells, causing protein precipitation or red blood cell aggregation and lysis.14 Therefore, chemical modifications are usually made to mitigate the effect of high cationic charge of PEI.15
In this study, to attenuate toxicity, enhance biocompatibility and improve cellular uptake, we modified PEI with 5 molar equivalents of L-arginine modified oligo (alkylaminosiloxane) graft and 3 molar equivalents of PEG, forming P(SiDAAr)5P3. The previous study has shown better transfection with P(SiDAAr)5 than with PEI in vitro due to L-arginine residues that assist in adsorptive endocytosis, enhancing membrane permeability, and facilitating nuclear localization.16 P(SiDAAr)5's siloxane derivative is biodegradable and is excreted by urine.17 Further, P(SiDAAr)5 following PEG and folic acid conjugation showed greater tumor accumulation than unconjugated polymer.18
DNA and siRNA delivery systems have many similar criteria, such as facilitating efficient cellular uptake and rapid endosomal escape. However, their distinctive structural and chemical characteristics determined their different complex formation properties. DNA is usually several kilobase pairs long while siRNA is only 21-23 base pairs. Topologically, siRNA forms A-form helixes, while DNA forms B-form helixes.19 The A-form has a larger diameter and a smaller rise per base pair, and thus is stiffer than the B-form.19 Therefore, the structural differences between DNA and siRNA may result in DNA-co-siRNA polyplexes to have different structural properties than DNA- or siRNA-only polyplexes.20 This study shows that DNA-siRNA co-delivery significantly enhances gene transfection levels of both the nucleotides (DNA and siRNA) compare to that of a single-nucleotide (DNA or siRNA). Further, comparing polyplexes, P(SiDAAr)5P3 polyplexes have significantly better cytocompatibility than PEI polyplexes with the same nucleotide composition.
2. Materials and Methods
2.1. Materials
3-(2-aminoethylamino) propyl-methyl-dimethoxysilane, 25-kDa branched PEI, L-arginine, O-(2-aminoethyl)-O′-(2-carboxyethyl), PEG-3kDa hydrochloride, 1-Ethyl-3-(3-dimethylaminopropyl) carbodiimide hydrochloride (EDC), dicyclohexylcarbodiimide (DCC), N-hydroxysuccinimide (NHS) and 3-(4,5-dimethylthiazol-2-yl)-2,5-diphenyltetrazolium bromide (MTT) were purchased from Sigma-Aldrich (St. Louis, MO). Fetal bovine serum (FBS) and Trypsin/EDTA were obtained from Gibco (Grand Island, NY). The luciferase assay system and reporter lysis buffer were purchased from Promega (Madison, WI). Scrambled siRNA (s-siRNA) and YOYO-1 DNA intercalating dye were purchased from Life Technologies (Carlsbad, CA). The 1% Gold Agarose Reliant Gel System was purchased from Lonza (Allendale, NJ). Anti-luciferase siRNA (luc-siRNA) was purchased from Dharmacon, Inc. (Lafayette, CO). The BCA Protein Assay Kit was purchased from Thermo Scientific (Rockford, lL). Cell culture media Dulbecco's Modified Eagle's Medium (DMEM), DPBS, penicillin and streptomycin were purchased from our Cell Services' Media Preparation Core.
2.2. pDNA Amplification and Purification
The pGL3 (luciferase reporter vector) and control (noncoding) plasmid DNA from Promega (Madison, WI) were cloned via E. coli (JM109, Promega) according to the manufacture's technical manual. pDNA was purified using Qiagen EndoFree Plasmid Mega Kit (Qiagen, Valencia, CA) according to the manufacture's instructions and re-suspended in DNase-free dH2O. pDNA concentration was measured with a Nanodrop 1000 (Thermo Scientific, Waltham, MA).
2.3. Polymer Synthesis
Arginine modified oligo-(alkylaminosiloxane)-graft-PEI (P(SiDAAr)5) (5:1 graft: PEI molar ratio) was synthesized as previously described.16 Briefly, the free acid group of NH2-PEG-COOH was activated using EDC as a coupling agent and NHS as a catalyst in pH 6 MES buffer at 40 °C for 3.5 hr. Three molar equivalents of activated PEG were then reacted with 1 molar equivalent of P(SiDAAr)5 overnight in PBS (pH=7.5) via carbodiimide chemistry. The synthesized polymer was dialyzed for 2 days using 12K MWCO dialysis membrane (Spectrum Labs, Rancho Dominguez, CA) to remove un-reacted elements.
2.4. Polymer/Nucleotide Complexation
Polymers were dissolved in MilliQ water (dH2O) and filtered through a 0.22 μm sterile polyethersulfone filter (Millipore, Darmstadt, Germany). SiRNA was dissolved at 1 mg/mL in RNase-free dH2O. For characterization studies, DNA and polymers were dissolved separately at 1 mg/mL in DNase- and RNase-free dH2O. For cell culture experiments, DNA and polymer were dissolved separately at 1 mg/mL in serum-free Dulbecco's Modified Eagle Medium (DMEM). Polyplexes were formed by combining DNA, siRNA and polymer solutions, pipetting to mix thoroughly, and self-assembling for 30 min. PEI was used in parallel with P(SiDAAr)5P3 for comparison purposes.
2.5. Size/Zeta Potential Measurements
Polymers PEI and P(SiDAAr)5P3, and the corresponding polyplexes with different DNA/siRNA/polymer (D/S/P) ratios, were measured for mean hydrodynamic diameters and zeta potentials in dH2O via dynamic light scattering (DLS) using the NICOMP 380 ZLS Particle Sizing System (Santa Barbara, CA). All polymer and polyplex measurements were done in 3 replicates. Average and standard deviation were calculated for each polyplex composition.
2.6. Gel Retardation Assay
Agarose gel electrophoresis was used to determine if there was complete nucleotide complexation in each polyplex formulation. The polyplex solutions were prepared at varying polymer/nucleotide (P/N) weight/weight ratios. Free non-coding plasmid DNA (Ø-pDNA), luc-siRNA and Ø-pDNA-co-luc-siRNA P(SiDAAr)5P3 polyplex solutions were loaded in a 1% Gold Agarose gel (Lonza, Allendale, NJ) in TrisAcetate-EDTA buffer at pH 8.0. For free nucleotide wells, 2 μL of DNA or siRNA was used per well. For other wells, 2 μL of DNA was used per well, and the quantities of the siRNA and the polymer were adjusted accordingly. The free nucleotides and polyplexes were run on an electrophoresis system (Bio-Rad, Hercules, CA). The gel was stained using SYBR Green (Thermo Scientific) and visualized under a Carestream Molecular Imaging Gel Logic 112 Imaging System (Carestream Health, Inc., Rochester, NY).
2.7. Transmission Electron Microscopy (TEM)
1/1/4 D/S/P polyplexes were prepared in dH2O by vigorous pipetting and incubating for 30 min for polyplex self-assembly. Thereafter, 10 μL of the polyplex solution was dropped on TEM grids coated with silicon monoxide stabilized formvar films (Ted Pella Inc., Redding, CA). After drying, the samples were stained with 2% uranyl acetate for 7 minutes and imaged using a Tecnai G2 TEM microscope (FEI, Hillsboro, Oregon).
2.8. Polyanion Competition Assay
The relative stability of 1/1/4 D/S/P(SiDAAr)5P3 polyplexes was investigated using a heparin polyanion competition assay, where the nucleotides released from polyplexes were measured using gel electrophoresis. Polyplex solutions were first prepared by mixing 5 μg of DNA, 5 μg of siRNA and 20 μg of polymer and incubating in dH2O for 30 min. After that, polyplexes were exposed to heparin sodium (Sigma-Aldrich, St. Louis, MO) solution (10 μL) of varying concentrations for 15 min. Then the samples were run on a 1% Gold Agarose gel (Lonza, Allendale, NJ) in TrisAcetate-EDTA buffer, and the gel stained and visualized by the same method described in section 2.6.
2.9. Cell Culture
Cell line MCF-7 was purchased from American Type Culture Collection (Manassas, VA). Luciferase-expressing breast cancer metastatic cell line MDA-MB-231-luc-D3H2LN was purchased from Caliper Life Sciences (Hopkinton, MA). MCF-7/Adr was developed in our laboratory and maintained by culturing in media with 100 ng/mL doxorubicin. MCF-7/Adr was incubated in drug-free medium for two passages before being used in experiments. All cell lines were cultured at 37 °C in humidified air containing 5% CO2. DMEM with 15% FBS and 1% penicillin-streptomycin was used in all cell-culture related studies, including MTT, in vitro transfections, flow cytometry and confocal microscopic studies. Cell detachment was done using trypsin/EDTA at 37 °C.
2.10. In Vitro Cytotoxicity Assay
MTT assay was used to evaluate polymer and polyplex toxicities in vitro in MCF-7 and MCF-7/Adr cell lines. For the 72-hr polymer toxicity assay, 5×10⁴ cells were seeded per well in a 24-well plate (BD Biosciences, San Jose, CA). For the 24-hr polyplex toxicity assay, 5×10⁵ cells were seeded per well in a 24-well plate and 1 μg of DNA was used per well. The 72-hr polymer MTT was designed to assess the differential growth inhibition effects of the polymers, while the 24-hr polyplex MTT was designed to assess the toxicity of the polyplexes under transfection conditions. After 24 hr of cell attachment, all media was removed, and each well received fresh media containing polymers or polyplexes. After a designated incubation time, media was removed again and replaced with 150 μL of MTT (2 mg/mL in DMEM). Plates were incubated at room temperature overnight according to the standard MTT protocol. On the next day, MTT was removed, wells received 500 μL DMSO, and plates were incubated for 3.5 hr at 37 °C to allow the substrate to dissolve. One hundred and fifty μL of the dissolved solution was then taken out and absorbance (abs) measured at 575 nm using a clear 96-well plate. Cell viability (as a %) was calculated as (abs of sample-background)/(abs of control-background) ×100%.
2.11. In Vitro Luciferase Transfection Assay
Luciferase-DNA (luc-DNA)'s transfection levels in luc-DNA or luc-DNA/s-siRNA polyplexes were measured in MCF-7 and MCF-7/Adr cells. Luc-siRNA's transfection levels in luc-siRNA or luc-siRNA/Ø-pDNA polyplexes were measured in MDA-MB-231-luc-D3H2LN cells. One μg of luc-DNA/well was used for MCF-7, 2 μg of luc-DNA/well for MCF-7/Adr, and 2 μg of luc-siRNA/well for MDA-MB-231-luc-D3H2LN. MCF-7 and MCF-7/Adr cells were seeded at 5×10⁵ cells/well and MDA-MB-231-luc-D3H2LN cells at 2×10⁵ cells/well in 24 well plates. After 24 hr, media was replaced and polyplex suspensions prepared in DMEM were added drop-wise to each well. After 1 day of transfection, the cells were washed twice with PBS and lysed with 100 μL of Reporter Lysis Buffer (Promega). Twenty-five μL of lysate and 50 μL of Luciferase Assay Reagent was combined, and luciferase activity in relative luminescence units (RLU) was measured in an opaque 96-well plate (Sigma-Aldrich) using a micro plate reader (FLUOstar OPTIMA (BMG Labtech, Durham, NC).
Protein levels were determined using BCA protein assay (Thermo Scientific). Ten μL of each lysate and 150 μL of BCA reagent were combined in clear 96-well plates and incubated at 37 °C for 30 minutes. Absorbance was measured at a wavelength of 562 nm using an Absorbance Microplate Reader (Molecular Devices, Sunnyvale, CA).
2.12. DNA Cellular Uptake/Flow Cytometry
YOYO-pDNA intercalation was carried out by adding 30 μL of 10 μM YOYO-1 to 1 μg of 1 mg/mL DNA and incubating for 30 minutes at room temperature in the dark. MCF-7 and MCF-7/Adr cells were seeded in 6-well plates and allowed to grow to 70% confluence. Polyplex solutions were added to each well and flow cytometry was carried out after 24 hr. One μg of DNA per well was used for MCF-7 cells and 2.5 μg of DNA per well were used for MCF-7/Adr cells. Cells were washed twice with PBS, trypsinized and collected for flow cytometry (LSR II System, BD Biosciences). Fluorescence detector 530 ± 15 nm was used for YOYO-1 detection. A population of 10,000 freshly collected cells was used per condition.
2.13. DNA Intracellular Visualization
MCF-7 and MCF-7/Adr cells were seeded on coverslips placed in 6 well plates and allowed to reach 60% confluence. At 60% confluence, polyplexes formed with YOYO-1 stained DNA were added to each well in FBS enriched media. One μg of DNA per well was used for MCF-7 cells and 2.5 μg of DNA for MCF-7/Adr cells. After 24 hr incubation, cells were rinsed with DPBS and fixed with 4% paraformaldehyde (Sigma-Aldrich). Afterward, coverslips were mounted on clean glass slides using DAPI ProLong Gold Anti-fade Mounting Media (Invitrogen, Eugene, OR). The cells were then evaluated with a laser scanning confocal microscope (Leica TCS-SP II Spectral Laser Scanning Confocal Microscope, Leica Microsystems GmbH, Wetzlar, Germany).
2.14. Statistical Analysis
Data are presented as mean ± standard deviation. Statistical analysis of the differences between two mean values was performed by equal variance 1-sided Student's t-test using the t-test calculator from Graphpad Software. Variance and t-values were calculated, and p-values generated between two groups in comparison. Confidence level was set to 95%. Statistical significance was defined at p≤0.05; and highly significant at p≤0.01 and p≤0.001.
3. Results
Polymer Characterization
1H NMR (D2O) confirmed the presence of PEI, arginine, siloxane and PEG groups on the synthesized P(SiDAAr)5P3 (Fig 1). On the spectrum, the presence of PEG (-CH2CH2O-) was shown by peaks at 3.2-3.5 ppm. The proton signals of PEI, siloxane and arginine were identified by peaks at 2.3-2.8 ppm: 2.24 for arginine (-HCCH2CH2CH2NH-), 2.86 for arginine (-HCCH2CH2CH2NH-), and 2.4-2.8 for the ethylene groups of PEI (-NHCH2CH2-). The average hydrodynamic diameter (Dh) of polymers PEI, P(SiDAAr)5 and P(SiDAAr)5P3 measured by DLS increased after each step of modification, from PEI to P(SiDAAr)5 to P(SiDAAr)5P3 (Table 1). PEI and P(SiDAAr)5 have similar polydispersity indices (PDI) (0.3-0.4), whereas P(SiDAAr)5P3 has a greater PDI (0.62). Zeta potential increased slightly from PEI to P(SiDAAr)5 as a result of the amine groups present on arginine. Compared to P(SiDAAr)5, PEG-conjugation reduced P(SiDAAr)5P3's zeta potential.
Figure 1. Spectral characterization of P(SiDAAr)5P3.
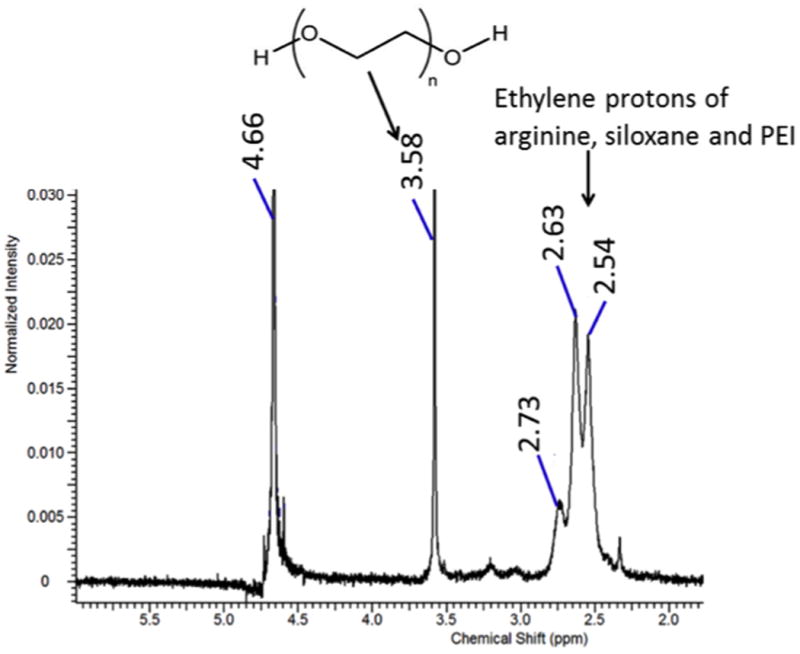
1H NMR spectra showed the polymer's PEG (-CH2-CH2-O-) groups, as well as arginine, siloxane and PEI's ethylene protons (-CH2-).
Table 1. Mean hydrodynamic diameter (Dh) (nm) and zeta potential (mV) of polymer solutions in dH2O.
| Polymer | Size, mean (SD) | PDI, mean (SD) | Zeta, mean (SD) |
|---|---|---|---|
| PEI | 8.67 (0.78) | 0.40 (0.10) | 8.11 (6.29) |
| P(SiDAAr)5 | 10.47 (1.05) | 0.38 (0.11) | 12.11 (3.67) |
| P(SiDAAr)5P3 | 41.43 (11.30) | 0.62 (0.38) | 10.43 (5.72) |
PDI: polydispersity index.
Polyplex Characterization
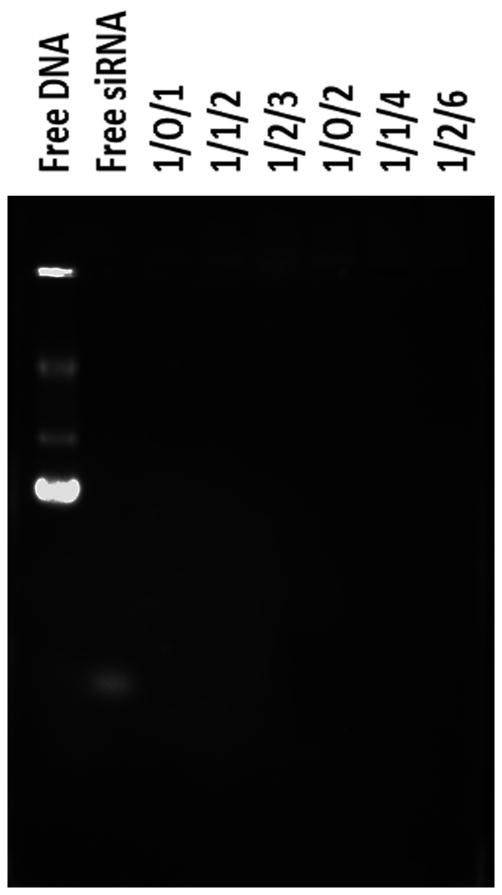
A gel retardation assay showed P(SiDAAr)5P3's nucleotide-binding capacity with different DNA and siRNA weight ratios based on the nucleotides' electrophoretic mobility (Fig 2). Compared to the controls (free luc-DNA and s-siRNA), the nucleotides showed no band on the gel, dim band in the wells with low P/N polyplexes and no band in the wells with high P/N polyplexes. No DNA migration signifies complete DNA-polymer complexation. No visible DNA in the wells signifies complete DNA masking by the polymer, therefore giving no exposure to the staining dye (Fig 2).
Figure 2. Polyplex agarose gel electrophoresis identifies the un-complexed nucleotides.
Complete nucleotide (Ø-pDNA and anti-luc siRNA) and polymer (P(SiDAAr)5P3) complexation was shown in all D/S/P w/w ratios.
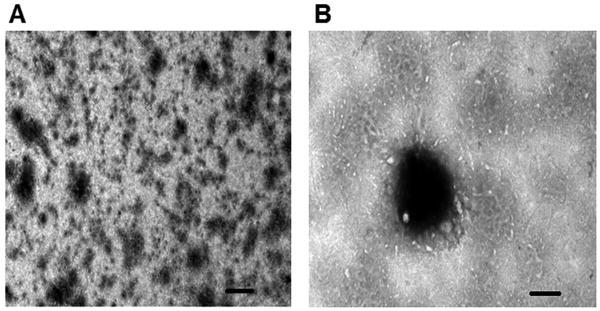
Polyplex morphologies were visualized under TEM in both high and low magnifications (Fig 3). The polyplexes have an almost spherical shape. Furthermore, polyplex hydrodynamic sizes and zeta potentials were measured via dynamic light scattering. Both nucleotide to polymer ratio and the polymeric material play a role in the size and surface charge of the polyplexes. On average, P(SiDAAr)5P3 polyplexes are smaller and have a smaller size range compared to PEI polyplexes (Table 2). Regarding polydispersity, most polyplexes have a PDI ranging from 0.2-0.5. Comparing average zeta potentials, P(SiDAAr)5P3 polyplexes have on average lower zeta potentials than PEI polyplexes. For both PEI and P(SiDAAr)5P3 polyplexes, surface charges increase as the polymer ratio increases in the polyplexes. P(SiDAAr)5P3 polyplexes have both positive and negative surface charges, whereas all PEI polyplexes have positive charges (Table 2). Finally, both siRNA polyplexes and siRNA-co-DNA polyplexes made from P(SiDAAr)5P3 have similar hydrodynamic sizes.
Figure 3. Transmission electron microscopic (TEM) images of polyplex.
Representative image shown is that of 1/1/4 DNA/siRNA/P(SiDAAr)5P3 polyplexes in low (A, ×13000, bar=1 μm) and high (B, ×30000, bar=0.5 μm) magnifications.
Table 2. Average hydrodynamic diameter (Dh) (nm) and zeta potential (mV) of PEI and P(SiDAAr)5P3 polyplexes at different weight ratios.
| DNA/siRNA/PEI | Size, mean (SD) | PDI, mean (SD) | Zeta, mean (SD) |
|---|---|---|---|
| 1/O/1 | 276.33 (156.16) | 0.44 (0.21) | 40.58 (5.99) |
| 1/1/2002 | 301.33 (148.34) | 0.34 (0.25) | 39.05 (8.72) |
| 1/0.5/1.5 | 454.2 (159.56) | 0.29 (0.10) | 38.3 (8.95) |
| 1/2/2003 | 385.77 (142.15) | 0.34 (0.21) | 38.83 (3.20) |
| 1/O/2 | 313.4 (80.77) | 0.37 (0.17) | 48.19 (9.39) |
| 1/1/2004 | 438.57 (127.17) | 0.23 (0.18) | 36.93 (10.10) |
| 1/0.5/3 | 312.83 (6.34) | 0.28 (0.05) | 53.56 (23.09) |
| 1/2/2006 | 355.5 (84.76) | 0.29 (0.15) | 67.15 (18.04) |
| DNA/siRNA/ P(SiDAAr)5P3 | Size, mean (SD) | PDI, mean (SD) | Zeta, mean (SD) |
| 1/O/1 | 289.1 (22.89) | 0.24 (0.04) | 3.90 (2.50) |
| 1/1/2002 | 386.3 (47.34) | 0.37 (0.15) | -2.44 (18.09) |
| 1/0.5/1.5 | 307.17 (65.69) | 0.24 (0.14) | 14.30 (15.80) |
| 1/2/2003 | 302.07 (55.46) | 0.29 (0.35) | 20.17 (7.25) |
| 1/O/2 | 280.47 (17.12) | 0.28 (0.04) | 21.17 (14.51) |
| 1/1/2004 | 283.93 (29.41) | 0.26 (0.10) | 22.69 (19.38) |
| 1/0.5/3 | 306.5 (14.35) | 0.29 (0.06) | 22.59 (5.95) |
| 1/2/2006 | 318.5 (44.29) | 0.31 (0.07) | 17.87 (8.83) |
| siRNA/DNA/ P(SiDAAr)5P3 | Size, mean (SD) | PDI, mean (SD) | Zeta, mean (SD) |
| 1/O/2 | 233.43 (17.96) | 0.25 (0.07) | 20.44 (15.04) |
| 1/0.5/3 | 228.13 (10.86) | 0.19 (0.06) | 10.96 (1.03) |
| 1/1/2004 | 271.97 (86.71) | 0.31 (0.23) | 29.08 (15.92) |
| 1/2/2006 | 296.67 (85.45) | 0.30 (0.14) | 18.25 (7.54) |
PDI: Polydispersity Index, D/S/P: DNA/siRNA/polymer, S/D/P: siRNA/DNA/polymer.
Polyplexes Stability in the Presence of Competing Polyanions
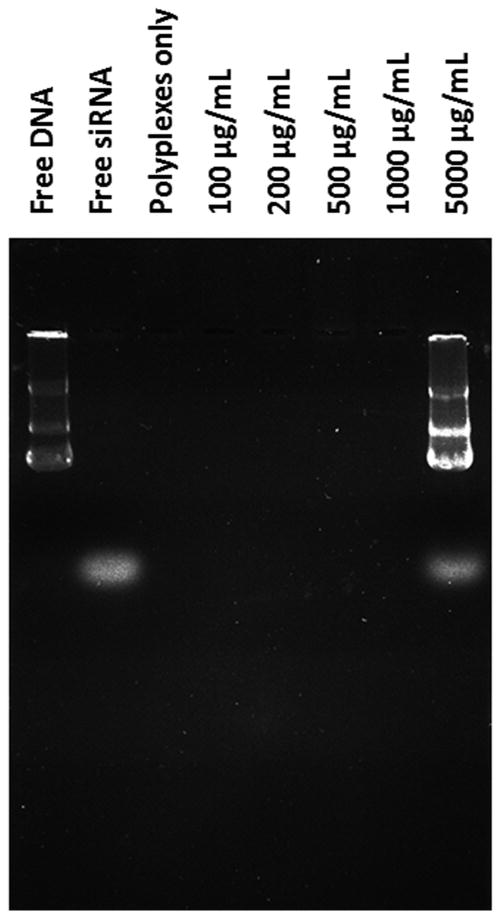
A heparin displacement assay was used to examine the integrity and stability of DNA/siRNA/ P(SiDAAr)5P3 polyplexes in the presence of heparin sodium (Fig 4). Different concentrations of heparin sodium solutions were used to gradually induce DNA and siRNA decomplexation within the polyplex. When no heparin was added, neither DNA or siRNA was released from the polyplexes. This is an indication of the polyplexes' stability in the absence of competing polyanions. With increasing heparin concentration, polyplexes were sufficiently stable, until reaching 5 mg/mL heparin concentration. At 5 mg/mL, polyplex decomplexation took place, where both DNA and siRNA were replaced by competing polyanions and were released out of the polyplexes.
Figure 4. Stability of polyplexes in the presence of polyanions.
The stability of polyplex-nucleotides was measured using the polyanion competition assay. 1/1/4 P(SiDAAr)5P3 polyplexes were incubated with heparin solution of varying concentrations, then separated using gel electrophoresis. Polyplexes incubated in 5 mg/mL of heparin released their nucleotides.
Cytotoxicity Evaluation
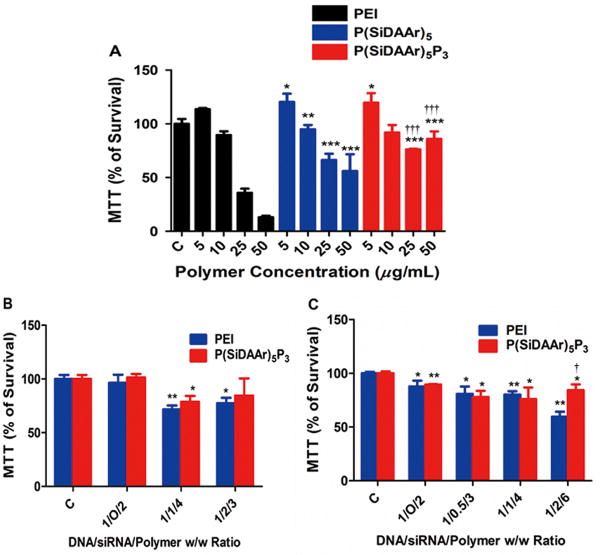
In the 72-hr dose-dependent polymer toxicity assay of MDA-MB-231-luc-D3H2LN cells, both P(SiDAAr)5 and P(SiDAAr)5P3 had significantly reduced toxicity compared to PEI [(p≤0.05) at 25 and 50 μg/mL] (Fig 5A). Compared to P(SiDAAr)5, P(SiDAAr)5P3 showed further cytotoxicity reduction. Cytotoxicity evaluation following 24 hr of PEI and P(SiDAAr)5P3 polyplex exposure showed that in both MCF-7 and MCF-7/Adr at high polymer concentrations (1/1/4 and 1/2/6 polyplexes), growth inhibition was observed (Fig 5B, C). However, P(SiDAAr)5P3 achieved significantly higher cell viability compared to PEI in MCF-7/Adr in a 1/2/6 D/S/P ratio.
Figure 5. Polymer and polyplex cytotoxicity assays in drug-sensitive and resistant cell lines.
(A) Polymer solution MTT assay after 72 hr of polymer incubation in MDA-MB-231-luc-D3H2LN cells. *: statistically significant compared to PEI polymer at the same concentration. †: statistically significant compared to P(SiDAAr)5 polymer at the same concentration. (B) Polyplex cytotoxicity in MCF-7 after 24 hr polyplex incubation. (C) Polyplex cytotoxicity in MCF-7/Adr after 24 hr of polyplex incubation. All data are represented as mean ± standard deviation (n=2). *: statistically significant compared to the control group; †: statistically significant compared to PEI polyplexes of the same composition. *, † p≤0.05; **, †† p≤0.01; ***, ††† p≤0.001. Data as mean ± standard deviation.
Luciferase DNA Transfection
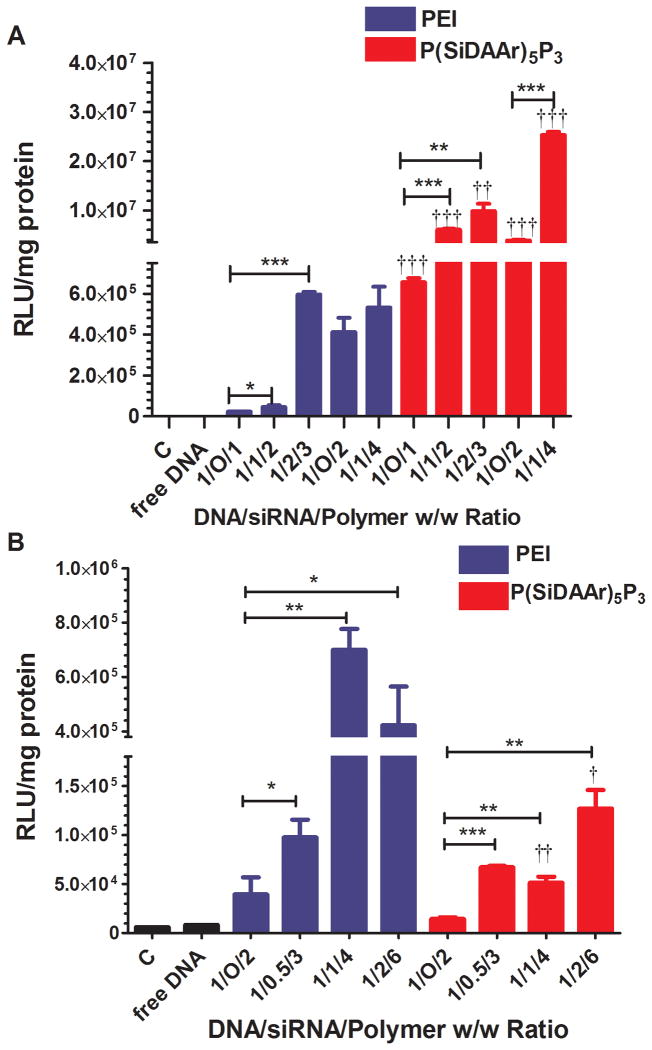
Luciferase DNA transfection using luc-DNA-co-s-siRNA polyplexes in MCF-7 and MCF-7/Adr cell lines showed that MCF-7 was more prone to DNA transfection than MCF-7/Adr (Fig 6A, B). With a 2 fold lower dose of DNA, MCF-7 still had higher transfection levels (from 10 to 100-fold) than MCF-7/Adr. In MCF-7, where both P/N ratios of 1 and 2 were used, polyplexes with P/N of 2 showed a greater transfection level than P/N of 1. In polyplexes with both polymers in both cell lines, s-siRNA incorporation resulted in enhanced transfection expressions. In MCF-7, 1/2/3 (D/S/P ratio) PEI polyplexes achieved 26-fold higher transfections than 1/O/1 PEI polyplexes. In P(SiDAAr)5P3 polyplexes, both 1/1/2 and 1/2/3 polyplexes expressed an over 10 fold higher transfection level compared to 1/O/1 polyplexes. Also, the 2 polymers affected different cell lines differently. In MCF-7, P(SiDAAr)5P3 polyplexes showed significantly higher transfections, whereas in MCF-7/Adr, higher transfections were observed with PEI polyplexes.
Figure 6. DNA transfection levels of both PEI and P(SiDAAr)5P3 luc-DNA-co-s-siRNA polyplexes in MCF-7 and MCF-7/Adr cells.
(A) In MCF-7 cell line, P(SiDAAr)5P3 polyplexes achieved a significantly higher transfection level than PEI polyplexes with the same composition. (B) In MCF-7/Adr cell line, PEI polyplexes achieved significantly higher transfection levels than P(SiDAAr)5P3 polyplexes with the same composition. siRNA incorporation significantly enhanced DNA transfection levels in both cell lines. †: statistically significant compared to PEI polyplexes of the same composition. Data as mean ± standard deviation (n=2). *, † p≤0.05; **, †† p≤0.01; ***, ††† p≤0.001.
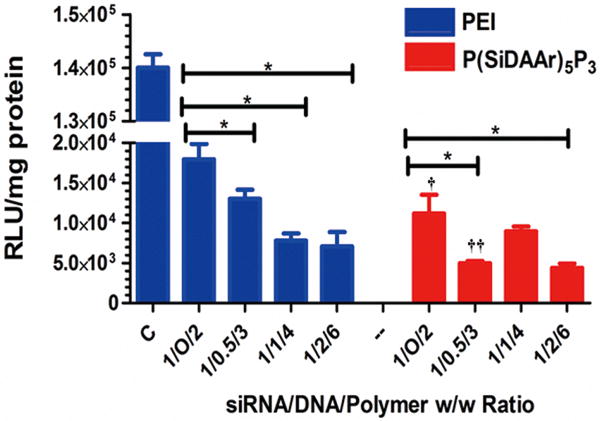
Luciferase expression knock-down in MDA-MB-231-luc-D3H2LN cells using luc-siRNA and Ø-pDNA polyplexes showed that ØDNA significantly enhanced siRNA's transfection levels (Fig 7). Consistent with MCF-7, P(SiDAAr)5P3 showed greater transfections than PEI. The maximum transfection level (97% luciferase expression knock-down) was achieved with 1/2/6 D/S/P polyplexes.
Figure 7. Transfection of siRNA-polyplex in MDA-MB-231-luc-D3H2LN cell line.
In siRNA/DNA/polymer (PEI or P(SiDAAr)5P3) polyplexes, Ø-pDNA significantly enhanced luc-siRNA's transfection levels in MDA-MB-231-luc-D3H2LN cell line. In this condition, P(SiDAAr)5P3 is a more effective transfection agent compared to PEI. Data as mean ± standard deviation (n=2). †: statistically significant compared to PEI polyplexes of the same weight ratio. *, † p≤0.05; **, †† p≤0.01; ***, ††† p≤0.001.
DNA Intracellular Uptake in MCF-7 and MCF-7/Adr Cell Lines
DNA's intracellular uptake examined in MCF-7 by flow cytometry showed that 1/1/4 polyplexes had a greater DNA uptake level than 1/O/2 polyplexes (Fig 8A). Confocal microscopy showed higher DNA cellular internalization in 1/2/3 polyplexes than in 1/1/2 polyplexes, and both expressed higher DNA cellular internalization than 1/O/1 polyplexes (Fig 8B).
Figure 8. Quantification of DNA uptake in MCF-7 cell line.
(A) Flow cytometry showed that DNA-siRNA polyplexes have a greater DNA cellular uptake than DNA polyplexes. (B) Intracellular DNA was visualized by confocal microscopy showed polyplexes with siRNA (1/2/3 and 1/1/4) have a stronger DNA internalization than those without siRNA (1/O/1 and 1/O/2). Images were captured using a 40× objective lens. Bar = 100 μm.
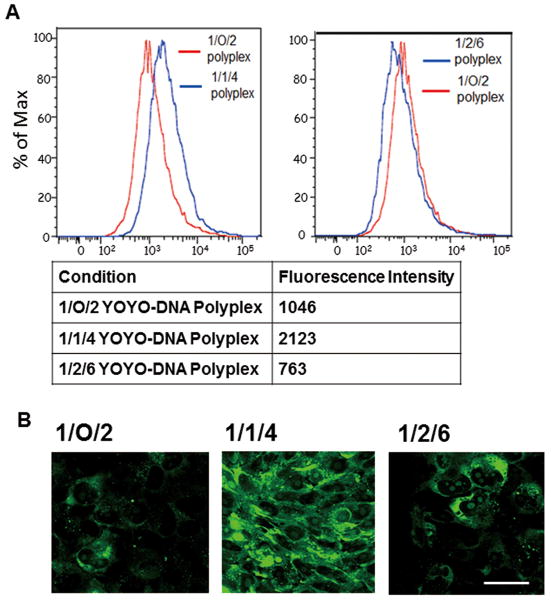
In MCF-7/Adr, both flow cytometry and confocal microscopy showed a higher DNA uptake in 1/1/4 polyplexes compared to 1/O/2 polyplexes. However, 1/2/6 polyplexes showed a reduced DNA uptake, confirmed by both flow cytometry and confocal imaging (Fig 9). In all studies, DNA uptake level is affected by polyplex compositions and the presence of siRNA in the polyplex.
Figure 9. Quantification of DNA uptake in MCF-7/Adr cell line.
(A) Flow cytometry quantified P(SiDAAr)5P3 polyplexes' DNA uptake levels in MCF-7/Adr cell line. 1/1/4 polyplexes showed over 2-fold higher DNA uptake than 1/O/2 polyplexes. The level dropped in 1/2/6 polyplexes due to polymer masking. (B) Confocal microscopy visualized YOYO-1-DNA's cellular internalization. 1/1/4 polyplexes showed a stronger DNA internalization than 1/O/2 polyplexes. Fluorescence intensity dropped in 1/2/6 polyplexes, confirming the flow cytometry results. Images were captured using 80× objective lens. Bar=50 μm.
4. Discussion
This study showed that DNA and siRNA enhances each other's transfection levels in PEI-based delivery systems. Luc-DNA was combined with s-siRNA, and luc-siRNA combined with Ø-pDNA. S-siRNA and Ø-pDNA had no genetic interferences with functional nucleotides.
Polymer characterization demonstrated that polymer size increased significantly from P(SiDAAr)5 to P(SiDAAr)5P3, partly due to the hydrodynamic size of the long linear PEG chains (Table 1). The reduction in zeta potential from P(SiDAAr)5 to P(SiDAAr)5P3 indicated the PEG's ability to neutralize polymeric charges. PEI and P(SiDAAr)5P3's polyplex demonstrated different characteristics as carrier materials (Table 2). Compare to PEI polyplexes, P(SiDAAr)5P3's PEG groups has charge shielding effects. Further, PEI has more positive charges per weight unit compare to P(SiDAAr)5P3. Both factors resulted in PEI polyplexes having a higher average zeta potential than P(SiDAAr)5P3 polyplexes. Since polyplex formation is a self-assembly process, the nucleotide exposure to the exterior cationic charge results in negative polyplex surface charge due to nucleic acids' anionic nature.
In all complexation ratios, complete nucleotide conjugation was observed, indicated by no nucleotide migration on the electrophoresis gel (Fig 2). Upon complete nucleotide masking by the polymer, SYBR Green dye has no binding with the nucleotide, thus showing no fluorescent band in the well. The 1/1/4 polyplex visualized by TEM showed individual almost spherical shape (Fig 3).
Heparin, a large polyanion, is a glycosaminoglycan, linear and negatively charged with sulfonate groups. It can be found inside cells and on the surface of the cell membrane.21 Heparin is also a major component of the extracellular matrix of some tissues, including connective tissues.21 Therefore, we choose heparin as a competition anion to evaluate the polyplex stabilities. 1/1/4 D/S/P polyplexes showed no disintegration at concentrations of up to 5 mg/mL heparin solution (Fig 4), demonstrating the polyplex stability in an anionic environment. The data thus suggest the polyplex would remain stable in the presence of serum or plasma proteins, which is critical for its in vivo application. Premature release of the cargo in the presence of serum protein or in circulation could make the polyplex ineffective as a transfecting agent.
Polymer toxicities were determined after 3 days of polymer incubation because 3 days incubation allows a more precise examination of the polymer effect on cell proliferations (Fig 5A). On the other hand, polyplex toxicities were examined in transfection conditions (1 day incubation) to more clearly reflect the polyplexes' growth inhibitory effects during the transfection period (Fig 5B, C). Although they contain equal amounts of DNA, 1/1/4 polyplexes weigh twice as much as 1/O/2 polyplexes, and showed higher toxicity. Although it appears that polyplexes have similar toxic effect in MCF-7 and MCF/7/Adr, the doses of polyplexes used in MCF-7/Adr was twice as much of each polyplex as MCF-7. Therefore MCF-7/Adr is in reality more resistant to polyplex toxicity than MCF-7. Most polyplexes here have a mild growth-inhibitory effect. However, P(SiDAAr)5P3 polyplexes showed less toxicity than PEI polyplexes at higher polyplex concentrations (ex. 1/2/6).
Concerning DNA transfections, PEI and P(SiDAAr)5P3 polyplexes show cell line dependent differential transfection levels. For example, P(SiDAAr)5P3 shows higher transfection in MCF-7 and PEI in MCF-7/Adr (Fig 6, 7). In the process of acquiring drug resistance, MCF-7/Adr's membrane lipid composition undergoes changes, forming more compact and rigid cell membranes and increased lysosomes compared to MCF-7. This change affects its cellular endocytosis, membrane trafficking and intracellular processing/transport, which contribute to decreased DNA transfection.22,23 Thus MCF-7/Adr could require a highly cationic delivery vehicle for interaction with cell membrane to trigger cellular uptake process. On the other hand, drug sensitive cell lines (MCF-7 and MDA-MB-231-luc-D3H2LN) have relatively easy membrane transport of polyplexes due to fluid nature of the membrane to cause endocytosis. In drug sensitive cells, P(SiDAAr)5P3 may better facilitate intracellular nucleotide release and nuclear localization due to arginine and siloxane's aforementioned properties.
Significantly enhanced luciferase protein knock-down was observed in siRNA-pDNA polyplexes compare to siRNA polyplexes (Fig 7), yet their average sizes and zeta potentials do not differ significantly from the siRNA polyplexes. Therefore, there may be other mechanisms that assist in the transfections, such as the polyplexes' endosomal escape and intracellular trafficking. DNA uptake studies confirmed that high nucleic acid internalization and nuclear localization rates are not the only influences on transfection rates. For example, free YOYO-DNA's cellular uptake was significantly higher than that of 1/O/2 polyplexes in MCF-7 (Fig 8), yet free DNA showed insignificant transfections compared to polyplexes (Fig 6A). Also, 1/1/4 P(SiDAAr)5P3 polyplexes have approximately 2-fold higher DNA uptake than 1/O/2 polyplexes, yet showed over 6-fold DNA transfection (Fig 6A). All these data indicate that the polymers not only play a role in DNA's intracellular uptake, they also affect other parameters that influence gene transfections. In all gene therapies, transfection level is heavily dependent upon the carrier's ability to overcome extracellular and intracellular barriers, including (1) cellular uptake, (2) endosomal escape and protection from lysosomal degradation, and (3) intracellular polyplex de-complexation for effective gene functioning.24 Therefore, further studies are needed to understand their intracellular trafficking and sorting into different intracellular compartments that could impact transfection.
One observation to note is that 1/2/6 polyplexes showed a lower intracellular DNA uptake compare to both 1/O/2 and 1/1/4 polyplexes, as detected by both flow cytometry and confocal microscopy (Fig 9). This may due to YOYO-1-DNA's fluorescence quenching as a result of polymer and siRNA masking. When the overall ratio of (siRNA and polymer) to DNA increases, DNA masking is likely to result, thus lowering the detected DNA signal.
One possibility for co-delivery to enhance DNA and siRNA's transfection levels is by alterations in polyplex structures. DNA, which has long and winding strands, and siRNA, which has short and rigid strands, have different PEI binding behaviors. Study has shown DNA-PEI and siRNA-PEI polyplexes to have different hierarchical mechanism of formation.25 Further, in siRNA polyplexes, siRNA undergoes biphasic binding with the polycations and molecular reorganization at low N/P ratios, which is not present with DNA polyplexes.25 When combined, they may result in different polyplex properties from those formed by single nucleotides, thus potentially affecting the nucleotides' intracellular release, localization, and interaction with intracellular molecules.
Co-delivery is a promising yet challenging field. siRNA and paclitaxel co-delivery has been achieved by cationic core-shell nanoparticles with enhanced transfection efficiencies.26 Poly(2-ethyl-2-oxazoline)-PLA-g-PEI,27 multifunctional chitosan nanoparticles28 and PEI-functionalized lipid nanocapsules29 have all been used to explore nucleotide and drug co-delivery to enhance transfection outcomes. In this study, DNA and siRNA have been co-delivered in PEI-based polyplexes as helper polyanions to enhance each other's transfection levels. Mechanistically, both DNA and siRNA are complementary to one other. For example, when siRNA targets one gene and pDNA targets its suppressor gene, the combination may elongate the silencing effects.
5. Conclusions
This study demonstrated that long, supercoiled pDNA and short, rigid siRNA enhances each other's gene transfection levels in a cell. We found that the 1/1/4 D/S/P polyplex is a better composition for co-delivery of DNA and siRNA as it resulted in higher DNA and siRNA transfection with reduced toxicity than other polyplex compositions tested. Co-delivery of siRNA and pDNA using PEI-based carrier is a promising approach to maximize gene transfection efficiency. Such an approach has the potential to achieve synergistic therapeutic effects by simultaneously targeting multiple genetic levels. This study showed that certain synergistic effects observed in co-delivery are due to the presence of a helper polyanion (DNA or siRNA). The study also gives incentive for future explorations in designing and implementing multi-nucleic acid delivery strategies. A better understanding of co-delivery's physicochemical, biological and therapeutic characteristics will be essential to future implementation of co-delivery strategies in clinical settings.
Acknowledgments
This study was partially supported by the grant from the National Cancer Institute of the National Institutes of Health [Grant 1R01CA149359 (to V.L.)]. Confocal microscopy studies were performed at the Cleveland Clinic Imaging Core with guidance from Dr. John Peterson. TEM was conducted at the Cleveland Clinic Imaging Core with assistance of Mei Yin.
Abbreviations
- abs
absorbance
- bPEI
branched polyethylenimine
- Dh
hydrodynamic diameters
- DLS
dynamic light scattering
- DMEM
Dulbecco' s Modified Eagle's Medium
- D/S/P ratio
DNA/siRNA/polymer weight/weight ratio
- luc-DNA
luciferase-DNA
- luc-siRNA
Anti-luciferase siRNA
- Ø-pDNA
non-coding plasmid DNA
- PAMAM
poly(amidoamine)
- PDI
polydispersity Index
- PLGA
poly(lactide co-glycolic acid)
- PEG
polyethylene glycol
- PLL
poly (L-lysine)
- P/N
polymer/nucleotide weight/weight ratio
- P(SiDAAr)5P3
3 PEG-conjugated 5 siloxane-arginine modified bPEI polymer
- siRNA
small-interfering RNA
- s-siRNA
scramble siRNA
- TEM
transmission electron microscopy
References
- 1.Wolfram JA, Donahue JK. Gene therapy to treat cardiovascular disease. J Am Heart Assoc. 2013;2(4):e000119. doi: 10.1161/JAHA.113.000119. [DOI] [PMC free article] [PubMed] [Google Scholar]
- 2.van der Marel S, Majowicz A, van Deventer S, Petry H, Hommes DW, Ferreira V. Gene and cell therapy based treatment strategies for inflammatory bowel diseases. World J Gastrointest Pathophysiol. 2011;2(6):114–22. doi: 10.4291/wjgp.v2.i6.114. [DOI] [PMC free article] [PubMed] [Google Scholar]
- 3.Yacyshyn BR, Bowen-Yacyshyn MB, Jewell L, Tami JA, Bennett CF, Kisner DL, Shanahan WR., Jr A placebo-controlled trial of icam-1 antisense oligonucleotide in the treatment of crohn's disease. Gastroenterology. 1998;114(6):1133–42. doi: 10.1016/s0016-5085(98)70418-4. [DOI] [PubMed] [Google Scholar]
- 4.Merdan T, Kopecek J, Kissel T. Prospects for cationic polymers in gene and oligonucleotide therapy against cancer. Adv Drug Deliv Rev. 2002;54(5):715–58. doi: 10.1016/s0169-409x(02)00046-7. [DOI] [PubMed] [Google Scholar]
- 5.Chen SH, Chen XH, Wang Y, Kosai K, Finegold MJ, Rich SS, Woo SL. Combination gene therapy for liver metastasis of colon carcinoma in vivo. Proc Natl Acad Sci U S A. 1995;92(7):2577–81. doi: 10.1073/pnas.92.7.2577. [DOI] [PMC free article] [PubMed] [Google Scholar]
- 6.Deleavey GF, Watts JK, Alain T, Robert F, Kalota A, Aishwarya V, Pelletier J, Gewirtz AM, Sonenberg N, Damha MJ. Synergistic effects between analogs of DNA and rna improve the potency of sirna-mediated gene silencing. Nucleic Acids Res. 2010;38(13):4547–57. doi: 10.1093/nar/gkq181. [DOI] [PMC free article] [PubMed] [Google Scholar]
- 7.Read ML, Singh S, Ahmed Z, Stevenson M, Briggs SS, Oupicky D, Barrett LB, Spice R, Kendall M, Berry M, Preece JA, Logan A, Seymour LW. A versatile reducible polycation-based system for efficient delivery of a broad range of nucleic acids. Nucleic Acids Res. 2005;33(9):e86. doi: 10.1093/nar/gni085. [DOI] [PMC free article] [PubMed] [Google Scholar]
- 8.Tripathi SK, Goyal R, Kumar P, Gupta KC. Linear polyethylenimine-graft-chitosan copolymers as efficient DNA/sirna delivery vectors in vitro and in vivo. Nanomedicine-Nanotechnology Biology and Medicine. 2012;8(3):337–345. doi: 10.1016/j.nano.2011.06.022. [DOI] [PubMed] [Google Scholar]
- 9.Lungwitz U, Breunig M, Blunk T, Gopferich A. Polyethylenimine-based non-viral gene delivery systems. Eur J Pharm Biopharm. 2005;60(2):247–66. doi: 10.1016/j.ejpb.2004.11.011. [DOI] [PubMed] [Google Scholar]
- 10.LabatMoleur F, Steffan AM, Brisson C, Perron H, Feugeas O, Furstenberger P, Oberling F, Brambilla E, Behr JP. An electron microscopy study into the mechanism of gene transfer with lipopolyamines. Gene Ther. 1996;3(11):1010–1017. [PubMed] [Google Scholar]
- 11.Godbey WT, Wu KK, Mikos AG. Tracking the intracellular path of poly(ethylenimine)/DNA complexes for gene delivery. Proc Natl Acad Sci U S A. 1999;96(9):5177–81. doi: 10.1073/pnas.96.9.5177. [DOI] [PMC free article] [PubMed] [Google Scholar]
- 12.Tiera MJ, Shi Q, Winnik FM, Fernandes JC. Polycation-based gene therapy: Current knowledge and new perspectives. Curr Gene Ther. 2011;11(4):288–306. doi: 10.2174/156652311796150408. [DOI] [PubMed] [Google Scholar]
- 13.Rekha MR, Sharma CP. Polymers for gene delivery: Current status and future perspectives. Recent Pat DNA Gene Seq. 2012;6(2):98–107. doi: 10.2174/187221512801327389. [DOI] [PubMed] [Google Scholar]
- 14.Fischer D, Bieber T, Li Y, Elsasser HP, Kissel T. A novel non-viral vector for DNA delivery based on low molecular weight, branched polyethylenimine: Effect of molecular weight on transfection efficiency and cytotoxicity. Pharm Res. 1999;16(8):1273–9. doi: 10.1023/a:1014861900478. [DOI] [PubMed] [Google Scholar]
- 15.Peng YS, Lai PL, Peng S, Wu HC, Yu S, Tseng TY, Wang LF, Chu IM. Glial cell line-derived neurotrophic factor gene delivery via a polyethylene imine grafted chitosan carrier. Int J Nanomedicine. 2014;9:3163–74. doi: 10.2147/IJN.S60465. [DOI] [PMC free article] [PubMed] [Google Scholar]
- 16.Morris VB, Sharma CP. Enhanced in-vitro transfection and biocompatibility of l-arginine modified oligo (-alkylaminosiloxanes)-graft-polyethylenimine. Biomaterials. 2010;31(33):8759–8769. doi: 10.1016/j.biomaterials.2010.07.073. [DOI] [PubMed] [Google Scholar]
- 17.Rosenholm JM, Meinander A, Peuhu E, Niemi R, Eriksson JE, Sahlgren C, Linden M. Targeting of porous hybrid silica nanoparticles to cancer cells. ACS Nano. 2009;3(1):197–206. doi: 10.1021/nn800781r. [DOI] [PubMed] [Google Scholar]
- 18.Morris VB, Sharma CP. Folate mediated l-arginine modified oligo (alkylaminosiloxane) graft poly (ethyleneimine) for tumor targeted gene delivery. Biomaterials. 2011;32(11):3030–3041. doi: 10.1016/j.biomaterials.2010.11.048. [DOI] [PubMed] [Google Scholar]
- 19.Kwok A. A comparison of the properties of plasmid DNA and sirna. In: Volker A, Erdmann JB, editors. DNA and rna nanobiotechnologies in medicine: Diagnosis and treatment of diseases. viii ed. Heidelberg: Springer; Berlin, Germany: 2013. pp. 215–216. [Google Scholar]
- 20.Wong LS. Elucidation of design criteria for sirna delivery in mammalian cells using polyethylenimine. University of Illinois at Urbana-Champaign; Urbana-Champaign: 2009. [Google Scholar]
- 21.Ruponen M, Ronkko S, Honkakoski P, Pelkonen J, Tammi M, Urtti A. Extracellular glycosaminoglycans modify cellular trafficking of lipoplexes and polyplexes. J Biol Chem. 2001;276(36):33875–80. doi: 10.1074/jbc.M011553200. [DOI] [PubMed] [Google Scholar]
- 22.Kang HC, Samsonova O, Bae YH. Trafficking microenvironmental phs of polycationic gene vectors in drug-sensitive and multidrug-resistant mcf7 breast cancer cells. Biomaterials. 2010;31(11):3071–8. doi: 10.1016/j.biomaterials.2010.01.001. [DOI] [PMC free article] [PubMed] [Google Scholar]
- 23.Peetla C, Vijayaraghavalu S, Labhasetwar V. Biophysics of cell membrane lipids in cancer drug resistance: Implications for drug transport and drug delivery with nanoparticles. Adv Drug Deliv Rev. 2013;65(13-14):1686–98. doi: 10.1016/j.addr.2013.09.004. [DOI] [PMC free article] [PubMed] [Google Scholar]
- 24.Kim WJ, Kim SW. Efficient sirna delivery with non-viral polymeric vehicles. Pharm Res. 2009;26(3):657–66. doi: 10.1007/s11095-008-9774-1. [DOI] [PubMed] [Google Scholar]
- 25.Zheng M, Pavan GM, Neeb M, Schaper AK, Danani A, Klebe G, Merkel OM, Kissel T. Targeting the blind spot of polycationic nanocarrier-based sirna delivery. ACS Nano. 2012;6(11):9447–54. doi: 10.1021/nn301966r. [DOI] [PMC free article] [PubMed] [Google Scholar]
- 26.Wang Y, Gao S, Ye WH, Yoon HS, Yang YY. Co-delivery of drugs and DNA from cationic core-shell nanoparticles self-assembled from a biodegradable copolymer. Nat Mater. 2006;5(10):791–6. doi: 10.1038/nmat1737. [DOI] [PubMed] [Google Scholar]
- 27.Gaspar VM, Goncalves C, de Melo-Diogo D, Costa EC, Queiroz JA, Pichon C, Sousa F, Correia IJ. Poly(2-ethyl-2-oxazoline)-pla-g-pei amphiphilic triblock micelles for co-delivery of minicircle DNA and chemotherapeutics. J Control Release. 2014;189:90–104. doi: 10.1016/j.jconrel.2014.06.040. [DOI] [PubMed] [Google Scholar]
- 28.Wang C, Ravi S, Garapati US, Das M, Howell M, MallelaMallela J, Alwarapan S, Mohapatra SS, Mohapatra S. Multifunctional chitosan magnetic-graphene (cmg) nanoparticles: A theranostic platform for tumor-targeted co-delivery of drugs, genes and mri contrast agents. J Mater Chem B Mater Biol Med. 2013;1(35):4396–4405. doi: 10.1039/C3TB20452A. [DOI] [PMC free article] [PubMed] [Google Scholar]
- 29.Skandrani N, Barras A, Legrand D, Gharbi T, Boulahdour H, Boukherroub R. Lipid nanocapsules functionalized with polyethyleneimine for plasmid DNA and drug co-delivery and cell imaging. Nanoscale. 2014;6(13):7379–90. doi: 10.1039/c4nr01110d. [DOI] [PubMed] [Google Scholar]


