

Abstract
Objective
Excess lipid intake has been implicated in the pathophysiology of hepatosteatosis and hepatic insulin resistance. Lipids constitute approximately 50% of the cell membrane mass, define membrane properties, and create microenvironments for membrane-proteins. In this study we aimed to resolve temporal alterations in membrane metabolite and protein signatures during high-fat diet (HF)-mediated development of hepatic insulin resistance.
Methods
We induced hepatosteatosis by feeding C3HeB/FeJ male mice an HF enriched with long-chain polyunsaturated C18:2n6 fatty acids for 7, 14, or 21 days. Longitudinal changes in hepatic insulin sensitivity were assessed via the euglycemic-hyperinsulinemic clamp, in membrane lipids via t-metabolomics- and membrane proteins via quantitative proteomics-analyses, and in hepatocyte morphology via electron microscopy. Data were compared to those of age- and litter-matched controls maintained on a low-fat diet.
Results
Excess long-chain polyunsaturated C18:2n6 intake for 7 days did not compromise hepatic insulin sensitivity, however, induced hepatosteatosis and modified major membrane lipid constituent signatures in liver, e.g. increased total unsaturated, long-chain fatty acid-containing acyl-carnitine or membrane-associated diacylglycerol moieties and decreased total short-chain acyl-carnitines, glycerophosphocholines, lysophosphatidylcholines, or sphingolipids. Hepatic insulin sensitivity tended to decrease within 14 days HF-exposure. Overt hepatic insulin resistance developed until day 21 of HF-intervention and was accompanied by morphological mitochondrial abnormalities and indications for oxidative stress in liver. HF-feeding progressively decreased the abundance of protein-components of all mitochondrial respiratory chain complexes, inner and outer mitochondrial membrane substrate transporters independent from the hepatocellular mitochondrial volume in liver.
Conclusions
We assume HF-induced modifications in membrane lipid- and protein-signatures prior to and during changes in hepatic insulin action in liver alter membrane properties – in particular those of mitochondria which are highly abundant in hepatocytes. In turn, a progressive decrease in the abundance of mitochondrial membrane proteins throughout HF-exposure likely impacts on mitochondrial energy metabolism, substrate exchange across mitochondrial membranes, contributes to oxidative stress, mitochondrial damage, and the development of insulin resistance in liver.
Keywords: Hepatosteatosis, Proteomics, Metabolomics, Diabetes, Clamp, Mitochondria
Abbreviations: 2-[14C]DG, 2-[1-14C]deoxyglucose; GIR, glucose infusion rate; Rd, rate of disappearance; Ra, rate of appearance; EGP, endogenous (hepatic) glucose production; AUC, area under the curve; HF, high-fat diet; LF, low-fat diet; WAT, white adipose tissue; ROS, reactive oxygen species; DAG, diacylglycerol; TAG, triacylglycerol; WAT, white adipose tissue; NEFA, non-esterified fatty acids; ALT, alanine aminotransferase; Basal, 17 h fasting; Rg, glucose metabolic index; PCaa, diacylglycerophosphocholine; PCae, glycerophosphocholine; lysoPC, lysophosphatidylcholines; SM, sphingolipid; B, basal; IS, insulin-stimulated
1. Introduction
Type 2 diabetes is a growing global phenomenon and considered a major complication in most overweight patients with non-alcoholic fatty liver disease (NAFLD); vice versa, type 2 diabetes is frequently complicated by NAFLD [1]. Excessive short-term or chronic fat intake expands hepatic lipid stores and impairs hepatic insulin action. In turn, insulin resistance in liver is thought to act as a driving force in both, the pathogenesis of type 2 diabetes and NAFLD [2–4].
Various bioactive lipid classes – such as fatty acids, acyl-carnitines, diacylglycerols, phospholipids, or ceramides – have been implicated in the pathophysiology of hepatic insulin resistance in animal models and humans [2,5–9]. Fatty acids are central regulators of hepatic lipid metabolism as they modulate the activity of several transcription factors, e.g. peroxisome proliferator-activated receptors, hepatic nuclear factors, sterol regulatory element binding protein-1c, retinoid X receptor, or liver X receptor [10]. Diacylglycerols, their break-down products and ceramides act as first and second messengers and interfere with insulin signaling in liver [2,6,11,12]. In addition, lipids constitute approximately half of the mass of most animal cell membranes, the latter dividing the extra- and intracellular environment thereby restricting biological reactions, their educts and products [13,14]. Phospholipids, such as phosphatidylcholines and phosphatidylethanolamines, are the most abundant eukaryotic membrane lipids. They consist of a polar head group and two hydrophobic hydrocarbon tails, the latter usually fatty acids. Due to their amphipathic nature and geometry, polar lipids spontaneously align side-by-side thereby aggregating into semipermeable membranes. Diacylglycerols transiently accumulate in membranes and facilitate membrane fusion.
The lipid composition of the diet modulates lipid signatures of membranes and contributes to the creation of microenvironments in membranes that account for protein enrichment or dispersion. Membrane properties are substantially modulated by both, the chain lengths and the number of double bonds of the incorporated fatty acids [15]. For example, phosphatidylcholine containing a C18:0 acyl-chain in the sn-1 and sn-2 position has a melting point of approximately 55 °C. At mammalian body temperatures it therefore exists in a solid aggregation state. If the C18:0 acyl-chain in the sn-2 position is replaced by 18:2n-6, it maintains a liquid crystalline state until approximately 15 °C [16]. Sphingolipids aggregate in microdomains or rafts that float within the membrane. As the saturated hydrocarbon tails of sphingolipids are usually longer and straighter than those of other membrane lipids, they accommodate the largest membrane proteins [13].
Recent advances have been made to more closely investigate the role of various bioactive lipid classes in the pathogenesis of type 2 diabetes and hepatosteatosis. Given the structural and functional importance of membranes, modifications in membrane lipid and protein signatures might play a role in the development of high fat diet (HF)-induced hepatic insulin resistance. However, whether early qualitative and quantitative changes in membrane-associated lipid species and proteins precede, accompany or result in HF-induced hepatic insulin resistance is not clear.
Therefore, we assessed comprehensive, longitudinal alterations in major membrane lipid components with targeted-metabolomics and membrane-associated proteins using discovery proteomics in livers of mice during developing HF-mediated hepatic insulin resistance.
2. Material and methods
Mice and study design. C3HeB/FeJ (C3H) mice were housed under standard vivarium conditions (12:12 light-dark-cycle) and maintained on low-fat diet (LF, 13% fat-derived calories, 17 kJ/g, Diet#1310, Altromin, Germany). At an age of 14 weeks, male mice were matched for body mass and litter, and single-housed in cages including a domehouse and nestlet. For 7, 14, or 21 days, mice had free access to a previously published high-fat diet (HF, 58% fat-derived calories, 25 kJ/g, Ssniff, Germany) containing ∼78% C18:2n-6 fatty acid [17]. The HF was exchanged every third day. One group of mice (REC) was treated with HF for 14 days and switched back to LF for 7 days. Initial body mass-, age-, and litter-matched control groups were continued on LF for 7, 14, or 21 days. Body mass and composition (MiniSpec LF50, Bruker Optics, Germany) were measured one day prior to the experiment start and end. If not stated otherwise, at the study end mice were killed with isoflurane between 9 and 11 a.m. in the random-fed state. V. cava blood was obtained, immediately centrifuged at 4 °C, and plasma aliquots were frozen in liquid nitrogen. Liver, Musculus gastrocnemius, epididymal and mesenteric white adipose tissue pads were dissected. Some organs were weighed, and immediately freeze-clamped in liquid nitrogen. Livers were ground in liquid nitrogen, and homogenates stored at −80 °C for further analyzes. All animals received humane care according to criteria outlined in the National Academy of Sciences Guide for the Care and Use of Laboratory Animals. All animal experiments were approved by the Upper-Bavarian district government (Regierung von Oberbayern Gz.55.2-1-54-2532-4-11).
Plasma and liver biochemical analyses. Plasma immunoreactive insulin was determined with a Mouse Insulin ELISA (Mercodia, Sweden) and all other plasma parameters with an AU400 autoanalyzer (Olympus, Germany) using adapted reagents from Beckman Coulter, Wako Chemicals, or Randox Laboratories. Plasma triacylglycerol (Sigma Diagnostics, USA), and non-esterified fatty acids (NEFA-C, Wako Pure Chemicals, Japan) were measured with reagent kits. For liver triacylglycerol quantification approximately 50 mg ground liver aliquots were homogenized (TissueLyserII Qiagen, Germany) with 1 ml 5% Triton-X100. Triacylglycerol concentrations were quantified enzymatically with a commercial kit according to the manufacturer's instructions (Biovision, USA).
Euglycemic-hyperinsulinemic clamps. A cohort of mice was equipped with permanent jugular vein-catheters (i.p. ketamine/xylazine 80/10 mg/kg). After 6–7 days recovery ∼17-h fasting, conscious mice were subjected to euglycemic-hyperinsulinemic clamps. Blood samples were obtained after single initial tail biopsy by gently massaging tails and taping tips between sampling. For determination of fasting (basal) whole-body glucose turnover rates (EndoRa) a primed-continuous [3-3H]glucose infusion (1.85 kBq/min) was applied for 120 min and a blood sample for basal plasma glucose, [3-3H]glucose, and insulin measurements was withdrawn in the final 10 min. Clamps were started with a continuous [3-3H]glucose (3.7 kBq/min) and insulin infusion (24 pmol/kg*min−1; HumulinR, Lilly, USA). Blood glucose was measured every 10 min (Bayer Contour, Germany) and blood glucose fluctuations were adjusted by varying the rate of a 20%-glucose solution (GIR). Between min 90 and 120, four blood samples were collected to estimate insulin-mediated suppression of endogenous glucose appearance (EndoRa), whole-body glucose disappearance rates (Rd) and plasma insulin concentrations. Between minute 0 of the end of the clamp blood loss was compensated by infusing donor blood cells at a rate of 3 μl/min. Blood was obtained from male, LF-fed littermates. To prepare the infusion solution, the donor blood was gently centrifuged, the supernatant discarded, blood cells were re-suspended in sterile 0.9% NaCl-solution and all steps were repeated once more. All infusions were performed with CMA402-pumps (Axel Semrau, Germany) and radioisotopes were purchased from Perkin Elmer (Boston, USA). At the end of experiments animals were killed with i.v. ketamine/xylazine. Liver, M. gastrocnemius, heart, and epididymal white adipose tissue were immediately dissected, freeze-clamped, and stored at −80 °C. Plasma analyses and glucose flux calculations were performed as previously described in Ref. [18]. Phospho-AKT (Ser473) and total AKT protein were assessed in liver homogenates with a multiarray-assay and a SECTOR Imager6000 according to the manufacturer's protocol (K15100D-1, MesoScaleDiscovery, USA).
Targeted-metabolomics. Measurements in plasma and liver homogenates were conducted with the AbsoluteIDQ™ p180 kit (Biocrates Life Sciences, Austria) according to the manufacturer's manual UM-P180 and as previously described in Ref. [19]. Sample handling was performed by a Microlab STAR™ robot (Hamilton, Switzerland) and Ultravap nitrogen evaporator (Porvair Sciences, UK). Mass spectrometric (MS) analyses were performed with API4000 LC/MS/MS System (AB Sciex, Germany) equipped with 1200 Series HPLC (Agilent, Germany) and HTC-PAL autosampler (CTC Analytics, Switzerland) software-controlled by Analyst1.5.1. Internal standards served as reference for calculation of metabolite concentrations. Data evaluation for metabolite concentration quantification and quality assessment was performed with MetIDQ™ software. Several biomarkers in this manuscript are referred to in the Biocrates MetaDisIDQ™ Kit product information 2010-10-06 and application note BB-MD-1. Due to the instability of effector molecules and their products oxidative stress is difficult to measure. Among amino acids, methionine ranks among the most sensitive to oxidation. According to a clinical study sulfoxidation of methionine markedly correlated with chronic kidney disease stages and the methionine sulfoxide/methionine (Met-SO/Met) ratio was suggested to represent a stable endpoint of oxidative stress [20].
Liver diacylglycerol measurement. At the study end, a separate cohort of 6-h fasting mice was killed with isoflurane between 9 and 11 a.m. Diacylglycerol was extracted from liver homogenates by homogenization in a buffer containing 20 mM Tris–HCl, 1 mM EDTA, 0.25 mM EGTA, 250 mM sucrose, 2 mM phenylmethylsulfonyl fluoride, and a protease inhibitor mixture (Roche). Diacylglycerol species were measured by LC/MS/MS [21].
Proteomics. Proteins from frozen liver homogenates were extracted by mechanical homogenization (Precellys24, Bertin Technologies). Membrane vesicles were harvested at 100,000 g 4 °C for 30 min and a carbonate extraction of membrane proteins was performed as described earlier in Refs. [22,23]. Protein pellets were resuspended in 50 mM Tris pH 8.5 0.2% Rapigest (Waters) and subjected to tryptic digestion. Cysteines were reduced using DTT and alkylated using iodoacetamide. Proteins were digested with 5 μg trypsin for 18 h at 37 °C. Peptides were separated by reversed-phase chromatography (PepMap, 0.075 × 150 mm, 3 μm 100 Å pore size, LC Packings) with a 170-min gradient using 2% acetonitrile in 0.1% formic acid in water (A) and 0.1% formic acid in 98% acetonitrile (B) at 250 nl/min flow rate. The gradient settings were subsequently: 0–140 min: 5–31% B. 140–145 min: 31–99% B. 145–150 min: 99% B and equilibrate for 10 min at starting conditions. The nano-LC was connected to an LTQ ion trap-Orbitrap XL mass spectrometer (Thermo Fisher, Germany) and MS spectra (m/z 300–1500) were acquired. Up to ten peptide precursors were selected for collision induced dissociation fragmentation. Runs were, aligned in Progenesis LC-MS (Non-Linear Dynamics V3.0) and peptides were quantified by MS intensity. MS/MS spectra were searched against the Ensembl Mouse-database using Mascot (Matrix Science V2.3.02, precursor mass tolerance 7 ppm, fragment tolerance 0.7 Da, enzyme trypsin, fixed modifications: carbamidomethylation (C), dynamic modifications: oxidation (M) deamidation (N.Q)). Peptide false discory rate was set to 2% by adjusting cut-off values for Mascot-score and p-value using the decoy database approach.
Transmission electron microscopy (TEM). Liver blocks (∼1 mm3) were fixed in 2.5% glutaraldehyde in 0.1 M sodium-cacodylate buffer pH 7.4 (Science Services, Germany), postfixed in 2% aqueous osmium-tetraoxide, dehydrated in gradual ethanol (30–100%) and propylene oxide, embedded in Epon (Merck, Germany) and cured 24 h at 60 °C. Semi-thin sections were cut and stained with toluidine blue. Ultrathin 50 nm sections were collected onto 200 mesh copper grids, stained with uranyl acetate and lead citrate before TEM examination (Zeiss Libra 120Plus, Carl Zeiss NTS, Germany). Pictures were acquired using a slow-scan CCD-camera and iTEM software (Olympus Soft Imaging Solutions, Germany). In each individual liver ten periportal and ten perivenous images from different hepatocyte areas were morphometrically analyzed by hand using AxioVision Software (Carl Zeiss Microscopy, Germany). In each image we calculated the number of mitochondria and the mitochondrial volume occupying the predefined hepatocyte volume. The mean of each parameter obtained from the same liver was considered an n = 1 and used to calculate the mean of each intervention group. Mitochondria <0.02 μm3 were considered small, 0.02–0.07 μm3 medium, and >0.07 μm3 large.
Statistical analysis and data visualisation. We performed ANOVA's (Bonferroni post-hoc test) or t-tests and compared data from 7, 14, and 21 days HF-fed with pooled data from LF-fed, litter-matched controls. Exclusively for proteomics, individual LF control groups were compared with the respective age-matched HF groups, a Benjamini–Hochberg multiple testing correction was performed and a false discovery rate (FDR) < 20% (HFd7, REC) or <10% (HFd14, HFd21) was considered significant. Assessment of longitudinal alterations in protein signatures (except SLC25A12 and SLC25A3 in Figure 4B) was based on a set of 378 proteins, presenting the protein overlap between all groups. Enrichment analyzes, based on a custom liver-specific background dataset comprising 6212 proteins (Supplemental Table 3), and protein networks were generated with STRING [24]. VENN diagrams were generated on the VENNY website [25] and heatmaps with MeV [26].
Figure 4.

Liver inner and outer mitochondria-membrane protein profiles during developing HF-mediated hepatic insulin resistance. Via quantitative proteomics liver membrane protein profiles were assessed in random-fed male mice following exposure to HF or LF for 7, 14, or 21 days or following 7 days recovery on LF after 14 d HF-exposure (REC) compared to LF-fed littermates. Heatmaps depict the fold-change in the abundance of inner mitochondrial membrane-associated (A) respiratory chain complexes I-V and (B) solute carrier proteins, and outer mitochondrial membrane-associated (C) VDAC proteins. n = 6–7/group. * Significantly regulated proteins in HF, REC vs. LF group. HFd7: FDR < 20%, HFd14 and HFd21: FDR < 10%. Abbreviations: RC I–V, respiratory chain complexes I–V; SLC, solute carrier family 25 member, N.d. not detected.
3. Results
Development of HF-induced hepatosteatosis and hepatic insulin resistance. During a 21-day HF-challenge, mice progressively increased whole body fat content and visceral adipose mass (Table 1). Compared to the LF group, 7 days HF-exposure increased liver TAG concentrations ∼8-fold (Figure 1A), liver mass ∼1.2-fold (Figure 1B), and plasma alanine transaminase concentrations ∼1.4-fold (Table 1), the latter suggesting modest hepatocellular injury. Extending HF-intervention from 7 to 21 days paradoxically reduced the degree of hepatosteatosis, however the marked increase in the liver's Met-SO/Met ratio compared to LF mice indicated oxidative stress (Figure 1C). Male C3HeB/FeJ mice maintained normoglycemia during HF-exposure (Table 1) but at the same time displayed ∼2.9-fold higher plasma insulin concentrations on day 21 than LF mice suggesting insulin resistance (Table 1). To characterize HF-mediated alterations in insulin sensitivity in vivo we performed euglycemic–hyperinsulinemic clamps. Infusion of insulin raised plasma insulin concentrations from baseline levels on a comparable scale in all groups (Figure 1D). Furthermore, comparable blood glucose concentrations (Figure 1E) and plasma specific activities (Figure 1F) were achieved in all groups of mice during the final 30 min of the glucose-clamp. Mice treated with HF for 7 days maintained whole-body insulin sensitivity, whereas mice fed an HF for 14 days developed insulin resistance outlined by markedly reduced GIRs compared to LF mice (Figure 1G). Whole-body insulin resistance was further aggravated by extending HF-exposure to 21 days (Figure 1G). Basal endogenous glucose production rates (EndoRa, Figure 1H) were similar in all groups, however insulin's ability to suppress the EndoRa tended to be decreased after 14 days and was significantly reduced after 21 days of HF feeding compared to LF mice (Figure 1H). Compared to basal, insulin administration markedly increased pAKT protein relative to total AKT protein in LF and 7 days HF-treated mice, whereas this response was attenuated in 21 days HF treated mice (Figure 1I).
Table 1.
Phenotypic parameters during developing HF-induced hepatic insulin resistance. Measurements were conducted in random-fed mice between 9 and 11 am. Prior to the start of the experiment animals in the LF (n = 28; pooled from 7, 14, or 21 days LF-fed mice) and HF groups (n = 10 each) were litter- and body mass-matched. Group sizes for mesenteric WAT mass (n = 18, 9, 5, and 5 for LF, HFd7, HFd14, and Hfd21, respectively), for plasma alanine aminotransferase and creatine kinase (n = 24, 6, 8, and 10 for LF, HFd7, HFd14, and Hfd21, respectively) and for plasma insulin (n = 8 for HFd7) were lower as not all parameters could be measured in each mouse. The table depicts the Rate of glucose disappearance (Rd) during the final 30 min of the glucose clamp (n = 9, 8, 9, and 9 for LF, HFd7, HFd14, and Hfd21, respectively). All data are given as means ± SEM (ANOVA, Bonferroni). ∗p < 0.05, p < 0.01∗∗, p < 0.001∗∗∗, p < 0.0001∗∗∗∗.
| Physiological parameters (random-fed) | LF | HF d7 | HF d14 | HF d21 |
|---|---|---|---|---|
| Terminal body mass (g) | 34.14 ± 0.45 | 38.15 ± 0.76∗∗∗ | 38.46 ± 1.06∗∗∗ | 40.90 ± 0.81∗∗∗∗ |
| Body mass gain (terminal–initial. g) | −0.08 ± 0.24 | 2.98 ± 0.39∗∗∗∗ | 4.84 ± 0.40∗∗∗∗ | 6.88 ± 0.67∗∗∗∗ |
| Terminal whole body fat mass (g) | 9.30 ± 0.26 | 11.94 ± 0.49∗∗∗ | 12.12 ± 0.73∗∗∗∗ | 13.08 ± 0.46∗∗∗∗ |
| Body fat mass gain (terminal–initial. g) | 0.15 ± 0.19 | 1.62 ± 0.25∗∗∗ | 3.12 ± 0.41∗∗∗∗ | 3.63 ± 0.27∗∗∗∗ |
| Epididymal white adipose tissue mass (g) | 0.93 ± 0.04 | 1.50 ± 0.07∗∗∗∗ | 1.51 ± 0.10∗∗∗∗ | 1.66 ± 0.06∗∗∗∗ |
| Mesenteric white adipose tissue mass (g) | 0.57 ± 0.03 | 0.95 ± 0.04∗∗∗∗ | 0.97 ± 0.07∗∗∗∗ | 1.14 ± 0.06∗∗∗∗ |
| Plasma alanine aminotransferase (U/l) | 21.94 ± 1.65 | 31.45 ± 2.13* | 26.36 ± 1.88 | 28.92 ± 3.09 |
| Plasma creatine kinase (U/l) | 42.50 ± 2.50 | 29.00 ± 2.67∗ | 33.00 ± 2.51 | 36.20 ± 3.39 |
| Plasma glucose (mmol/l) | 11.49 ± 0.49 | 12.35 ± 0.59 | 14.52 ± 1.42 | 10.93 ± 0.60 |
| Plasma insulin (pmol/l) | 339.50 ± 76.47 | 867.60 ± 161.30 | 642.00 ± 167.1 | 976.90 ± 313.60∗ |
| Plasma triacylglycerol (mmol/l) | 4.07 ± 0.27 | 1.96 ± 0.13∗∗∗ | 2.62 ± 0.33∗ | 2.76 ± 0.35∗ |
| Plasma non-esterified fatty acids (mmol/l) | 0.71 ± 0.05 | 0.51 ± 0.05 | 0.60 ± 0.08 | 0.58 ± 0.06 |
| Euglycemic-hyperinsulinemic clamps (∼17-h fasting) | ||||
| Rd t90 [mmol/kg*min] | 1.92 ± 0.14 | 1.75 ± 0.04 | 1.47 ± 0.11∗ | 1.38 ± 0.08∗∗ |
| Rd t100 [mmol/kg*min] | 1.86 ± 0.09 | 1.74 ± 0.07 | 1.52 ± 0.10 | 1.37 ± 0.08∗∗ |
| Rd t110 [mmol/kg*min] | 1.83 ± 0.10 | 1.75 ± 0.09 | 1.50 ± 0.10 | 1.35 ± 0.09∗∗ |
| Rd t120 [mmol/kg*min] | 1.86 ± 0.07 | 1.76 ± 0.16 | 1.53 ± 0.10 | 1.40 ± 0.09∗ |
Figure 1.

Induction of HF-mediated hepatic steatosis and insulin resistance. Male mice were exposed to HF or LF (pooled) for 7, 14, or 21 days. The liver parameters (A) liver triacylglycerol concentrations, (B) terminal liver mass, and (C) liver ratio of methionine-SO and methionine (oxidative stress indicator) were assessed in random-fed mice (n = 6–24). Euglycemic–hyperinsulinemic clamps were performed in conscious, 17-h fasting (=basal condition, B) mice. (D) Plasma insulin concentrations in the B condition and in the clamp 'steady state' during insulin-stimulation (IS). The following parameters were calculated for 10 min periods in the clamp ‘steady state’. (E) Blood glucose concentration. (F) Plasma specific activity. (G) Glucose infusion rate. (H) Endogenous glucose appearance rates (EndoRa, B and IS), (I) Liver ratio of pAKT and total AKT protein (t-test comparing B and IS in each group, n = 4–15/group). Data are means ± SEM. n = 8–15/group. *p < 0.05; **p < 0.01; ***p < 0.001; ****p < 0.0001 vs. LF or vs. B (ANOVA, Bonferroni).
HF-induced alterations in lipid membrane constituents in liver during developing hepatic insulin resistance. Next we assessed HF-mediated alterations of membrane-associated lipid metabolites in liver during developing hepatic insulin resistance. Seven days HF-intervention resulted in comprehensive lipid profile adaptations in insulin-sensitive livers (Figure 2 A, B first column). Seven, 14, and 21 days exposure to an HF diet rich in polyunsaturated fatty acids caused a marked ∼3.0-, ∼6.1-, and ∼3.0-fold increase of polyunsaturated (Figure 2C left panel) and ∼2.0-, ∼2.5-, and ∼1.6-fold increase of monounsaturated acyl-carnitines (Figure 2C middle panel). A pronounced ∼1.4-fold increase in total hepatic diacylglycerol species containing at least one unsaturated fatty acid was already evident after 7 days HF exposure compared to LF animals (Figure 2D, left and middle panel). In addition, the abundance of total saturated acyl-carnitine species, total monounsaturated and saturated diacylglycerophosphocholines (Figure 2E, middle and left panel), total polyunsaturated and saturated glycerophosphocholines (Figure 2F, left and right panel), total saturated lysophosphatidylcholines (Figure 2G, right panel) and total hydroxylated or non-hydroxylated sphingolipids (Figure 2H, right panel) decreased significantly in livers after 7 days HF-exposure compared to the LF group. The transition stage between normal and marked hepatic insulin resistance at HF day 14, was associated with the most pronounced alterations in hepatic acyl-carnitines compared to 7 days HF mice (Figure 2C all panels). Fully developed hepatic insulin resistance induced by 21 days HF exposure, was paralleled by a relative drop in total poly- and monounsaturated acyl-carnitines (Figure 2B left and middle panel), but a relative increase in total monounsaturated diacylglycerophosphocholines (Figure 2E middle panel) and lysophosphatidylcholines (Figure 2G middle panel) in liver when compared to livers of modestly insulin resistant, 14 days HF treated mice. The data for all individual lipid species are provided in Supplemental Tables 1 and 2.
Figure 2.
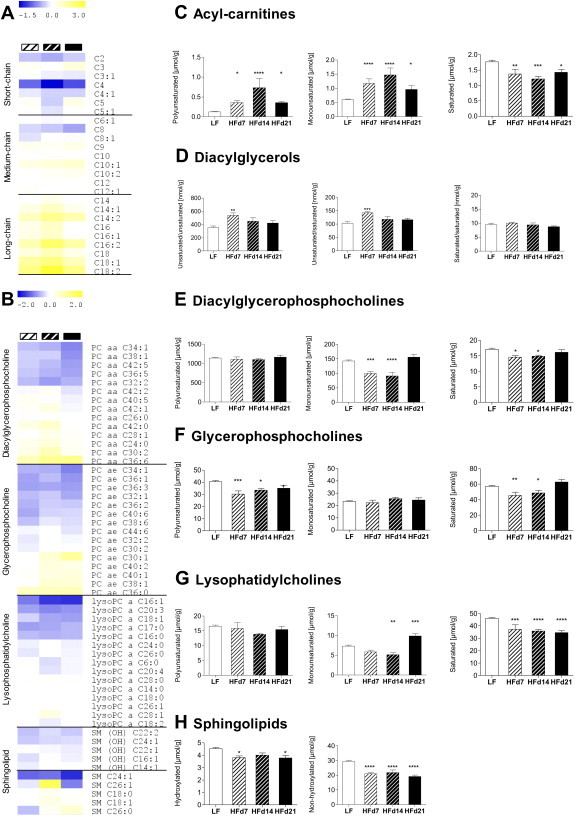
Liver lipid profiles during developing HF-mediated hepatic insulin resistance. Via t-metabolomics liver lipid profiles were assessed in random-fed male mice following exposure to HF or LF (pooled) for 7, 14, or 21 days. Heatmaps depict fold-change (log 2) of individual (A) short-, medium- and long-chain acyl-carnitine species or (B) selected phospholipid species in each HF-group. Compared to the LF-group, an increase in the HF-fed groups is indicated in yellow and a decrease in blue. (C) Total polyunsaturated (left, four species), monounsaturated (middle, 10 species) and saturated (right, 11 species) acyl-carnitine species. (D) Total membrane-associated diacylglycerols with two (left, four species) or one (middle, six species) incorporated unsaturated fatty acid or two incorporated saturated fatty acids (right, three species). (E) Total polyunsaturated (left, 31 species), monounsaturated (middle, seven species) and saturated (right, seven species) diacylglycerophosphocholines, (F) Total polyunsaturated (left, 19 species), monounsaturated (middle, seven species) and saturated (right, six species) glycerophosphocholines, and (G) Total polyunsaturated (left, three species), monounsaturated (middle, four species) and saturated (right, eight species) lysophosphatidylcholines. (H) Total hydroxylated (left, five species) or non-hydroxylated (right, seven species) sphingomyelins. Data are means ± SEM. n = 6–24/group, except diacylglycerols n = 6–9/group. *p < 0.05; **p < 0.01; ***p < 0.001; ****p < 0.0001 vs. LF (ANOVA, Bonferroni). Abbreviations: PC aa diacylglycerophosphocholine (lecitine); PC ae, glycerophosphocholine (plasmalogen); lysoPC, lysophosphatidylcholine (lysolecithine); SM, sphingolipid.
HF-induced alterations in signatures of membrane-associated proteins in liver during developing hepatic insulin resistance. We determined whether changes in membrane lipids were paralleled by alterations of membrane-associated protein signatures during developing insulin resistance in liver. Among the 378 proteins identified in all experimental groups, 62 were significantly altered in abundance in liver after 7 days HF-exposure compared to LF animals. We detected the highest number of significantly differentially regulated membrane-associated proteins (159) in the transition stage from normal to impaired hepatic insulin sensitivity (HF day 14) and this number only modestly declined to 125 proteins once pronounced hepatic insulin resistance established (HF day 21; Figure 3A). Membrane fractions obtained from pre-insulin resistant livers (HF day 7) expressed the highest proportion of significantly upregulated membrane-associated proteins (71% of 62, Figure 3B) compared to the LF group. In contrast, the onset of mild (57% of 159) and marked (77% of 125) HF-induced hepatic insulin resistance was paralleled by an increase in the proportion of markedly less abundant proteins (Figure 3B).
Figure 3.

Liver membrane protein profiles during developing HF-mediated hepatic insulin resistance. Via quantitative proteomics liver membrane protein profiles were assessed in random-fed male mice following exposure to HF or LF for 7, 14, or 21 days. (A) VENNY diagram depicts the overlap of significantly regulated membrane-associated proteins comparing an HF versus the respective LF group. (B) Number of significantly up- and downregulated proteins. (C) Up- and (D) downregulated mitochondria-associated proteins were identified in an HF vs. the respective LF group and used to generate networks. n = 6–7/group. HFd7: FDR<20%, HFd14 and HFd21: FDR<10%.
Compared to other cell types, liver cells are rich in mitochondria. To minimize an organ-specific bias we performed protein enrichment analyses based on a customized 6212 protein-background set constructed from the most comprehensive published mouse liver proteome-dataset [27] and our collected liver proteins (Supplemental Table 3). GO term analysis – based on the significantly differentially regulated proteins in HF- versus LF-treated mice – indicated a pronounced enrichment of e.g. the terms mitochondrial membrane, respiratory chain, or oxidative phosphorylation during developing hepatic insulin resistance (14 and 21 days HF; Supplemental Table 3). We visualized longitudinal changes in the network structures of down- (Figure 3C) and upregulated (Figure 3D) mitochondria-associated proteins during HF-intervention (see Supplemental Table 3 for higher resolution images). Even though modest prior to the onset of hepatic insulin resistance (HF day 7), the abundance of approximately two thirds of the detected complex I, II, III, IV, and V respiratory chain proteins – integral components of the inner mitochondrial membrane – tended to decrease (Figure 4A). Similar changes were observed for the majority of solute carrier family 25 members (Figure 4B), involved in the mitochondrial shuttling of adenine nucleotides (SLC25A13, SLC25A5), citrate (SLC25A1), oxoglutarate (SLC25A11), dicarboxylate (SLC25A10), ornithine (SLC25A15), carnitine/acyl-carnitine (SLC25A20), aspartate/glutamate (SLC25A12), or phosphate (SLC25A23). First signs of hepatic insulin resistance (HF day 14) were paralleled by a significantly lower abundance of most inner mitochondrial membrane constituents compared to LF-fed controls (Figure 4A and B). The expression of three voltage-dependent anion-selective channel (VDAC) family members (Figure 4C), associated with the outer mitochondrial membrane, tended to decrease within 14 days HF-intervention but significantly decreased when the HF-intervention was continued until day 21. Finally, the pronounced HF-induced alterations in hepatic mitochondria-related protein signatures, evident after 14 days HF-exposure, were completely reversible by switching mice back to an LF for 7 days (Figure 4A–C).
Ultrastructural changes in mitochondria during HF-mediated insulin resistance in liver. We performed quantitative morphological analyzes to determine whether changes in the abundance of mitochondrial proteins during developing hepatic insulin resistance were attributable to changes in mitochondrial volume. Mitochondria of LF mice appeared as typical liver mitochondria, round or elongated in shape, with tubular cristae and a few electron dense granules in the mitochondrial matrix (Figure 5A, left panel). However, they strongly varied in size and a great amount had a size <0.01 μm³. Mitochondria of mice exposed to HF for 7 days exhibited almost no pathological alterations. Only single mitochondria showed modest alterations such as fractures of the outer mitochondrial membrane (Figure 5A, arrow in middle panel). However, after 21 days HF exposure, numerous mitochondria appeared with an atypical electron-light mitochondrial matrix containing coiled membrane structures (Figure 5A, asterisk in right panel), partially broken outer membranes and an exvaginated inner mitochondrial membrane (Figure 5A, arrow in right panel). Besides ultrastructural features, neither the mitochondrial number nor the mitochondrial volume (Figure 5B) in periportal and perivenous hepatocytes was altered by HF feeding. Confirming visual observations, a tendency towards a decrease in the area occupied by small mitochondria related to total mitochondrial area was observed in HF- compared to LF-fed mice (Figure 5C).
Figure 5.

Ultrastructural and morphometric mitochondrial features in liver during development of HF-induced hepatic insulin resistance. EM-analyses were performed in liver sections obtained from random-fed male mice following exposure to LF or HF for 7 or 21 days. (A) Mitochondria in hepatocytes of the HFd7 group depicted minor ultrastructural changes (arrow middle panel, third row) whereas those of animals in the HFd21 group contained numerous atypical mitochondria with 'onion-like' structures (* right panel second and third row). Morphometric analyses of EM liver sections outline the (B) Percentages of periportal and perivenous hepatocyte volumina occupied by mitochondria and relative volumina of (C) small-sized mitochondria (defined as <0.02 μm3) related to total mitochondrial volume. Data are means ± SEM. n = 3–4/group (n = 1 represents mean of 10 analyzed electron micrographs/area and animal, ANOVA, Bonferroni).
4. Discussion
Insulin resistance is a growing global phenomenon predisposing to cardiovascular disease and type 2 diabetes mellitus. To comprehensively assess longitudinal alterations in liver membrane components during HF-induced hepatic insulin resistance we combined t-metabolomics and proteomics analyses with state-of-the-art phenotyping technologies of glucose metabolism.
Hepatosteatosis correlates with impaired hepatic insulin action; nevertheless it is debated whether insulin resistance or excess hepatic TAG concentrations develop first [28]. In our mouse model the hepatocellular TAG content increased more than eight-fold within 7 days HF exposure, however, hepatic insulin sensitivity remained normal. Hepatic insulin resistance developed, but was paralleled by a relative decline in the hepatocellular lipid content. In support of earlier findings in mice [7] we conclude that excess hepatic TAG accumulation per se does not abrogate hepatic insulin action. Based on the temporal fluctuations in hepatic TAG concentrations under HF-exposure it would be of particular value to investigate the secretory capacity of the liver regarding lipoproteins in more detail in the future.
The composition, overall intracellular availability, and subcellular distribution of glycerophospholipids, sphingolipids, diacylglycerols, and ceramides has been implicated in lipotoxicity-associated liver damage [29] and the pathogenesis of hepatic insulin resistance [6,12,28,30,31]. Prior to and throughout development of HF-mediated hepatic insulin resistance we observed comprehensive changes in membrane lipid signatures, which – besides affecting signal transduction cascades – likely modulate the physical properties and the topology of cellular membranes. For example the fluidity of synthetic lipid bilayers is determined by the composition of membrane lipids [13] what has been involved in the pathophysiology of metabolic disorders. A close correlation between the relative proportion of long-chain omega-3 polyunsaturated fatty acids in phospholipid and insulin action in red quadriceps muscle has been outlined earlier in Ref. [32]. Based on our data we propose a similar hypothesis in liver and in the following discuss both, evidence and potential mechanisms of how HF-induced alterations in membrane lipid signatures might contribute to the development of insulin resistance.
Acyl-carnitines link fatty acid and glucose metabolism, are crucial for cell function and survival, for mitochondrial fatty acyl-CoA thioester import, or acyl-group export from mitochondria and peroxisomes [33]. In addition, carnitine O-acyl derivatives modulate membrane fluidity via direct interactions with cell membranes, influence ion channel functions as well as membrane stability in cardiac tissue [34]. When we exposed mice to a diet rich in long-chain fatty acids they initially accumulated long-chain poly- and monounsaturated acyl-carnitines in liver followed by a relative decline. Due to their multiple functions and as long-chain acyl-carnitines bind to phospholipid bilayers and appear to almost completely reside in the membrane phase [35], such modifications might alter physical membrane properties and contribute to the development of insulin resistance in liver.
The outer and inner monolayer of lipid bilayers is thought to present a striking lipid asymmetry; whereas the outer membrane monolayer of e.g. human erythrocytes predominantly contains phosphatidylcholines and sphingomyelins, the inner monolayer is rather enriched in phosphatidylserines and phosphatidylethanolamines [13]. Lipid asymmetry is functionally important as many cytosolic proteins only bind to specific lipid head groups presented by the cytosolic face of the lipid monolayer, e.g. protein kinase C to regions rich in negatively charged phosphatidylserine [13]. A relationship between the composition of membrane structural phospholipids and insulin sensitivity was outlined in skeletal muscle of animal models and humans [32,36,37]. In skeletal muscle, diet-induced alterations in phospholipid moiety were speculated to influence insulin action in part by altering membrane fluidity [32]. In rat adipocytes, dietary fat-mediated modifications in the membrane phospholipid composition increased the fluidity of the plasma membrane lipid bilayer with the degree of phospholipid-incorporated polyunsaturated fatty acids [38].
Noteworthy, phospholipid signatures in this study do not accurately reflect membrane lipids as they were measured in whole liver homogenates. We chose to extract lipids from immediately freeze-clamped livers rather than from membrane extracts following an additional enrichment procedure as thereby we likely conserved low-abundant, rapidly metabolized, and degradation susceptible phospholipid signatures more efficiently. Presumably the analyzed phospholipids predominantly reside in cellular membranes rather than in extra-membranous compartments as according to their amphipatic nature they preferentially assemble into bilayers in aquatic (e.g. cytosolic) environments.
Taken together, our data outline comprehensive changes in unsaturated and saturated moieties of predominantly membrane-associated phospholipids, DAGs, and acyl-carnitines in mouse liver in response to HF-exposure. Given that the spontaneous curvature of a lipid depends on both, length and saturation of its incorporated fatty acids [39], HF-induced temporal changes in the degree of saturation and chain length of structural membrane lipids suggest dynamic alterations in physical membrane bilayer properties in liver. These might impact on the physiology of cells and those of cell organelles, on cellular energy metabolism, and thereby contribute to hepatic insulin resistance. Thus it will be an important future asset for the development of effective prevention and treatment strategies for type 2 diabetes and NAFLD to further elucidate initial mechanisms by which bioactive lipid metabolites interfere with hepatic insulin action.
In humans and animal models mitochondrial adaptations, such as epigenetic modifications of mitochondrial DNA, alterations in mitochondrial DNA content, respiratory chain complex activity, or mitochondrial beta-oxidation capacity in liver, have been linked to the development of hepatosteatosis, hepatic insulin resistance, and type 2 diabetes [40–44]. Also ultrastructural mitochondrial changes, their superior organisation, and plasticity seem to play pivotal roles in the development of insulin resistance [45–47]. Hepatocytes contain numerous, double membrane-bounded mitochondria and the organelles occupied approximately 18% of the cell volume in our mouse model (Figure 5B). The outer and inner mitochondrial membranes perform different functions and are characterized by distinct lipid and protein compositions [48]. In mice, HF-induced development of hepatic insulin resistance was accompanied by a gradual decrease in the abundance of many mitochondrial inner and outer membrane proteins involved in oxidative phosphorylation or substrate shuttling, what was not attributable to a decrease in the mitochondrial area in hepatocytes. Mitochondrial energetics significantly depends on the organelles complex internal architecture. Cristae, inner mitochondrial membrane invaginations, are sites of oxidative phosphorylation and ATP synthesis catalyzed by the mitochondrial ATP synthase. The enzyme is composed of two linked complexes. One is termed the soluble catalytic core F1, the second is the membrane-spanning, proton channel comprising Fo complex which is composed of nine subunits (A, B, C, D, E, F, G, F6, and 8). ATP synthase seems crucial for proper cristae morphogenesis [49,50] and assembles into dimers in cristae regions with a high membrane curvature [50–52]. In our study HF-exposure markedly decreased the abundance of the mitochondrial ATP synthase Fo complex subunits ATP5L (subunit G), ATP5K (subunit E), ATP5J (subunit F6), and ATP5H (subunit D) in liver. In mutant yeast cells the disruption in the ATP synthase Fo subunit e or g genes altered ATP synthase dimerization and caused defects in cristae architecture and so called ‘onion’-like structures [53,54]. Thus, the decrease in the abundance of ATP synthase subunit E or G proteins in our model may impact dimerization and be connected to the ultrastructural changes in the inner mitochondrial membrane architecture.
The volume-constraining outer mitochondrial membrane serves as an interface between the cytosol and mitochondria and establishes contact sites to cristae. VDACs are master regulators of the metabolite flux between the cytosol and the outer mitochondrial membrane [55]. In mice, VDAC1 deficiency leads to defects in respiratory complex activities in striated muscles and VDAC3-deficiency to alterations in complex IV in heart paralleled by mitochondrial structural abnormalities [56]. VDAC1 seems capable of interacting with hexokinase [57], the latter implicated in reducing mitochondrial ROS generation through an ADP-recycling mechanism. Outlining a role for VDAC1 in the development of HF-mediated hepatic insulin resistance in mice, deterioration of hepatic insulin action was paralleled by a significant reduction in the abundance of VDAC1 protein, an increase in oxidative stress and changes in mitochondrial architecture in liver.
Finally, HF-induced alterations in mitochondrial proteins of the inner and outer membrane were almost completely reversible within 7 days upon treatment with a low fat diet. This suggests that diet and life-style interventions contribute to a rapid restoration of insulin sensitivity in liver, at least at an early stage of hepatic insulin resistance. It will be of significance to further explore whether a longer HF-exposure extends the recovery of mitochondrial membrane proteins back to baseline or results in irreversible alterations and how it affects membrane associated lipid profiles.
The KEGG pathway of human NAFLD (hsa04932) implicates alterations in mitochondrial oxidative phosphorylation in the pathophysiology of the disease. However, it will be important to translate the alterations in mitochondrial inner and outer membranes in mice to humans with clinical manifestation of hepatosteatosis, as to our knowledge no studies specifically explored the human liver membrane proteome yet.
5. Conclusions
Diet-derived lipids modified signatures of membrane-constituting lipid classes such as the proportions of saturated and unsaturated long-chain acyl-carnitines, membrane-associated diacylglycerols, glycerophosphocholines, and glycerophospholipids in livers of mice. We assume this affects mitochondrial membrane topology and organelle physiology in liver. Therefore, it will be valuable to examine whether changes in the membrane lipid composition indeed interfere with the distribution of proteins in mitochondrial membranes or alter mitochondrial cristae formation, which would explain the observed decrease in the abundance of inner and outer mitochondrial membrane-associated proteins. It is tempting to speculate that persistent and comprehensive reductions of inner- and outer mitochondrial membrane-associated respiratory chain and substrate carrier proteins impede mitochondrial bioenergetics, substrate exchange with extramitochondrial compartments, provoke oxidative stress, induce mitochondrial damage, and thereby play a role in the development of hepatic insulin resistance.
Acknowledgment
We thank E. Holupirek, A.E. Schwarz, V. Gailus-Durner, H. Fuchs, and all animal caretakers in the GMC who contributed expert technical and organisational help with mouse phenotyping and care. We greatly appreciate the valuable scientific contributions of M. Horsch, A. Franko, and P. Huypens. The authors are very grateful to G.I. Shulman, M. Kahn, and G.W. Cline who measured DAGs, K. Suhre for providing expertise with metabolomics and biomathematical analyses, C. Prehn, W. Römisch-Margl, J. Scarpa, and K. Sckell for metabolomics measurements, the latter performed at the Helmholtz Zentrum München, Genome Analysis Center, Metabolomics Core Facility.
This work was funded by grants from the German Federal Ministry of Education and Research (BMBF) to the German Center for Diabetes Research (DZD e.V.), from the BMBF (SysMBo 0315494A) and from the National Institutes of Health (U24 DK-059635).
Conflict of interest
No potential conflict of interest relevant to this article was declared.
Appendix A. Supplementary data
The following are the supplementary data related to this article:
GO-term analysis of significantly regulated liver proteins during developing HF-induced hepatic insulin resistance and 6212 protein background dataset.
Via quantitative proteomics liver membrane protein profiles were assessed in random-fed male mice. The tables depict results from GO-term analyses performed with proteins significantly differentially expressed in livers obtained from 7 (no enrichment), 14, or 21 days HF- versus LF-treated mice and to avoid an organ-specific bias based on a custom-made 6212 liver protein background dataset (provided). n = 6–7/group. HFd7: FDR<20%, HFd14 and HFd21: FDR<10%.
References
- 1.Pappachan J.M., Antonio F.A., Edavalath M., Mukherjee A. Non-alcoholic fatty liver disease: a diabetologist's perspective. Endocrine. 2014;45:344–353. doi: 10.1007/s12020-013-0087-8. [DOI] [PubMed] [Google Scholar]
- 2.Samuel V.T., Shulman G.I. Mechanisms for insulin resistance: common threads and missing links. Cell. 2012;148:852–871. doi: 10.1016/j.cell.2012.02.017. [DOI] [PMC free article] [PubMed] [Google Scholar]
- 3.Ikai E., Ishizaki M., Suzuki Y., Ishida M., Noborizaka Y., Yamada Y. Association between hepatic steatosis, insulin resistance and hyperinsulinaemia as related to hypertension in alcohol consumers and obese people. Journal of Human Hypertension. 1995;9:101–105. [PubMed] [Google Scholar]
- 4.Perry R.J., Samuel V.T., Petersen K.F., Shulman G.I. The role of hepatic lipids in hepatic insulin resistance and type 2 diabetes. Nature. 2014;510:84–91. doi: 10.1038/nature13478. [DOI] [PMC free article] [PubMed] [Google Scholar]
- 5.Holland W.L., Knotts T.A., Chavez J.A., Wang L.P., Hoehn K.L., Summers S.A. Lipid mediators of insulin resistance. Nutrition Reviews. 2007;65:S39–S46. doi: 10.1111/j.1753-4887.2007.tb00327.x. [DOI] [PubMed] [Google Scholar]
- 6.Larsen P.J., Tennagels N. On ceramides, other sphingolipids and impaired glucose homeostasis. Molecular Metabolism. 2014;3:252–260. doi: 10.1016/j.molmet.2014.01.011. [DOI] [PMC free article] [PubMed] [Google Scholar]
- 7.Neschen S., Morino K., Dong J., Wang-Fischer Y., Cline G.W., Romanelli A.J. n-3 Fatty acids preserve insulin sensitivity in vivo in a peroxisome proliferator-activated receptor-alpha-dependent manner. Diabetes. 2007;56:1034–1041. doi: 10.2337/db06-1206. [DOI] [PubMed] [Google Scholar]
- 8.Neschen S., Morino K., Hammond L.E., Zhang D., Liu Z.-X., Romanelli A.J. Prevention of hepatic steatosis and hepatic insulin resistance in mitochondrial acyl-CoA:glycerol-sn-3-phosphate acyltransferase 1 knockout mice. Cell Metabolism. 2005;2:55–65. doi: 10.1016/j.cmet.2005.06.006. [DOI] [PubMed] [Google Scholar]
- 9.Samuel V.T., Liu Z.-X., Qu X., Elder B.D., Bilz S., Befroy D. Mechanism of hepatic insulin resistance in non-alcoholic fatty liver disease. Journal of Biological Chemistry. 2004;279:32345–32353. doi: 10.1074/jbc.M313478200. [DOI] [PubMed] [Google Scholar]
- 10.Jump D.B., Botolin D., Wang Y., Xu J., Christian B., Demeure O. Fatty acid regulation of hepatic gene transcription. Journal of Nutrition. 2005;135:2503–2506. doi: 10.1093/jn/135.11.2503. [DOI] [PubMed] [Google Scholar]
- 11.Fayyaz S., Japtok L., Kleuser B. Divergent role of sphingosine 1-phosphate on insulin resistance. Cellular Physiology and Biochemistry. 2014;34:134–147. doi: 10.1159/000362990. [DOI] [PubMed] [Google Scholar]
- 12.Kumashiro N., Erion D.M., Zhang D., Kahn M., Beddow S.A., Chu X. Cellular mechanism of insulin resistance in nonalcoholic fatty liver disease. Proceedings of the National Academy of Sciences of the United States of America. 2011;108:16381–16385. doi: 10.1073/pnas.1113359108. [DOI] [PMC free article] [PubMed] [Google Scholar]
- 13.Alberts B.J.A., Johnson A., Lewis J., Raff M., Roberts K., Walter P. 4th ed. Garland Science; New York: 2002. The lipid bilayer. Molecular biology of the cell.http://www.ncbi.nlm.nih.gov/books/NBK26871/ Available from: [Google Scholar]
- 14.Haag M., Dippenaar N.G. Dietary fats, fatty acids and insulin resistance: short review of a multifaceted connection. Medical Science Monitor. 2005;11:Ra359–Ra367. [PubMed] [Google Scholar]
- 15.Hulbert A.J., Turner N., Storlien L.H., Else P.L. Dietary fats and membrane function: implications for metabolism and disease. Biological Reviews of the Cambridge Philosophical Society. 2005;80:155–169. doi: 10.1017/s1464793104006578. [DOI] [PubMed] [Google Scholar]
- 16.Lee A.G. Lipids and their effects on membrane proteins: evidence against a role for fluidity. Progress in Lipid Research. 1991;30:323–348. doi: 10.1016/0163-7827(91)90002-m. [DOI] [PubMed] [Google Scholar]
- 17.Kahle M., Horsch M., Fridrich B., Seelig A., Schultheiss J., Leonhardt J. Phenotypic comparison of common mouse strains developing high-fat diet-induced hepatosteatosis. Molecular Metabolism. 2013;2:435–446. doi: 10.1016/j.molmet.2013.07.009. [DOI] [PMC free article] [PubMed] [Google Scholar]
- 18.Neschen S., Scheerer M., Seelig A., Huypens P., Schultheiss J., Wu M. Metformin supports the antidiabetic effect of a sodium glucose cotransporter 2 (SGLT2) inhibitor by suppressing endogenous glucose production in diabetic mice. Diabetes. 2014 doi: 10.2337/db14-0393. [Epub ahead of print] [DOI] [PubMed] [Google Scholar]
- 19.Zukunft S., Sorgenfrei M., Prehn C., Möller G., Adamski J. Targeted metabolomics of dried blood spot extracts. Chromatographia. 2013;76:1295–1305. [Google Scholar]
- 20.Bauer C., Melamed M.L., Hostetter T.H. Staging of chronic kidney disease: time for a course correction. Journal of the American Society of Nephrology. 2008;19:844–846. doi: 10.1681/ASN.2008010110. [DOI] [PubMed] [Google Scholar]
- 21.Yu C., Chen Y., Cline G.W., Zhang D., Zong H., Wang Y. Mechanism by which fatty acids inhibit insulin activation of insulin receptor substrate-1 (IRS-1)-associated phosphatidylinositol 3-kinase activity in muscle. Journal of Biological Chemistry. 2002;277:50230–50236. doi: 10.1074/jbc.M200958200. [DOI] [PubMed] [Google Scholar]
- 22.Nagaraj N., Lu A., Mann M., Wisniewski J.R. Detergent-based but gel-free method allows identification of several hundred membrane proteins in single LC-MS runs. Journal of Proteome Research. 2008;7:5028–5032. doi: 10.1021/pr800412j. [DOI] [PubMed] [Google Scholar]
- 23.Hauck S.M., Dietter J., Kramer R.L., Hofmaier F., Zipplies J.K. Deciphering membrane-associated molecular processes in target tissue of autoimmune uveitis by label-free quantitative mass spectrometry. Mol Cell Proteomics. 2010;9:2292–2305. doi: 10.1074/mcp.M110.001073. [DOI] [PMC free article] [PubMed] [Google Scholar]
- 24.Franceschini A., Szklarczyk D., Frankild S., Kuhn M., Simonovic M. STRING v9.1: protein-protein interaction networks, with increased coverage and integration. Nucleic Acids Research. 2013;41:D808–D815. doi: 10.1093/nar/gks1094. [DOI] [PMC free article] [PubMed] [Google Scholar]
- 25.JC O. 2007. VENNY. An interactive tool for comparing lists with Venn Diagrams. BioinfoGP, CNB-CSIC Online Access. [Google Scholar]
- 26.Howe E.H.K., Nair S., Schlauch D., Sinha R., Quackenbush J. MeV: MultiExperiment viewer. In: Ochs M.F., Casagrande J.T., Davuluri R.V., editors. Biomedical informatics for cancer research. Springer; US: 2010. pp. 267–277. [Google Scholar]
- 27.Lai K.K., Kolippakkam D., Beretta L. Comprehensive and quantitative proteome profiling of the mouse liver and plasma. Hepatology. 2008;47:1043–1051. doi: 10.1002/hep.22123. [DOI] [PubMed] [Google Scholar]
- 28.Nagle C.A., Klett E.L., Coleman R.A. Hepatic triacylglycerol accumulation and insulin resistance. Journal of Lipid Research. 2009;(50 Suppl.):S74–S79. doi: 10.1194/jlr.R800053-JLR200. [DOI] [PMC free article] [PubMed] [Google Scholar]
- 29.Neuschwander-Tetri B.A. Hepatic lipotoxicity and the pathogenesis of nonalcoholic steatohepatitis: the central role of nontriglyceride fatty acid metabolites. Hepatology. 2010;52:774–788. doi: 10.1002/hep.23719. [DOI] [PubMed] [Google Scholar]
- 30.Russo S.B., Ross J.S., Cowart L.A. Sphingolipids in obesity, type 2 diabetes, and metabolic disease. Handbook of Experimental Pharmacology. 2013;216:373–401. doi: 10.1007/978-3-7091-1511-4_19. [DOI] [PMC free article] [PubMed] [Google Scholar]
- 31.Samuel V.T., Petersen K.F., Shulman G.I. Lipid-induced insulin resistance: unravelling the mechanism. Lancet. 2010;375:2267–2277. doi: 10.1016/S0140-6736(10)60408-4. [DOI] [PMC free article] [PubMed] [Google Scholar]
- 32.Storlien L.H., Jenkins A.B., Chisholm D.J., Pascoe W.S., Khouri S., Kraegen E.W. Influence of dietary fat composition on development of insulin resistance in rats. Relationship to muscle triglyceride and omega-3 fatty acids in muscle phospholipid. Diabetes. 1991;40:280–289. doi: 10.2337/diab.40.2.280. [DOI] [PubMed] [Google Scholar]
- 33.Zammit V.A., Ramsay R.R., Bonomini M., Arduini A. Carnitine, mitochondrial function and therapy. Advanced Drug Delivery Reviews. 2009;61:1353–1362. doi: 10.1016/j.addr.2009.04.024. [DOI] [PubMed] [Google Scholar]
- 34.Fritz I.B., Arrigoni-Martelli E. Sites of action of carnitine and its derivatives on the cardiovascular system: interactions with membranes. Trends in Pharmacological Sciences. 1993;14:355–360. doi: 10.1016/0165-6147(93)90093-y. [DOI] [PubMed] [Google Scholar]
- 35.Ho J.K., Duclos R.I., Jr., Hamilton J.A. Interactions of acyl carnitines with model membranes: a (13)C-NMR study. Journal of Lipid Research. 2002;43:1429–1439. doi: 10.1194/jlr.m200137-jlr200. [DOI] [PubMed] [Google Scholar]
- 36.Borkman M., Storlien L.H., Pan D.A., Jenkins A.B., Chisholm D.J., Campbell L.V. The relation between insulin sensitivity and the fatty-acid composition of skeletal-muscle phospholipids. New England Journal of Medicine. 1993;328:238–244. doi: 10.1056/NEJM199301283280404. [DOI] [PubMed] [Google Scholar]
- 37.Pan D.A., Lillioja S., Milner M.R., Kriketos A.D., Baur L.A., Bogardus C. Skeletal muscle membrane lipid composition is related to adiposity and insulin action. Journal of Clinical Investigation. 1995;96:2802–2808. doi: 10.1172/JCI118350. [DOI] [PMC free article] [PubMed] [Google Scholar]
- 38.Parrish C.C., Myher J.J., Kuksis A., Angel A. Lipid structure of rat adipocyte plasma membranes following dietary lard and fish oil. Biochimica et Biophysica Acta. 1997;1323:253–262. doi: 10.1016/s0005-2736(96)00192-7. [DOI] [PubMed] [Google Scholar]
- 39.Szule J.A., Fuller N.L., Rand R.P. The effects of acyl chain length and saturation of diacylglycerols and phosphatidylcholines on membrane monolayer curvature. Biophysical Journal. 2002;83:977–984. doi: 10.1016/s0006-3495(02)75223-5. [DOI] [PMC free article] [PubMed] [Google Scholar]
- 40.Begriche K., Massart J., Robin M.A., Bonnet F., Fromenty B. Mitochondrial adaptations and dysfunctions in nonalcoholic fatty liver disease. Hepatology. 2013;58:1497–1507. doi: 10.1002/hep.26226. [DOI] [PubMed] [Google Scholar]
- 41.Caldwell S.H., Swerdlow R.H., Khan E.M., Iezzoni J.C., Hespenheide E.E., Parks J.K. Mitochondrial abnormalities in non-alcoholic steatohepatitis. J Hepatol. 1999;31:430–434. doi: 10.1016/s0168-8278(99)80033-6. [DOI] [PubMed] [Google Scholar]
- 42.Pessayre D. Role of mitochondria in non-alcoholic fatty liver disease. Journal of Gastroenterology and Hepatology. 2007;22(Suppl. 1):S20–S27. doi: 10.1111/j.1440-1746.2006.04640.x. [DOI] [PubMed] [Google Scholar]
- 43.Pirola C.J., Gianotti T.F., Burgueno A.L., Rey-Funes M., Loidl C.F., Mallardi P. Epigenetic modification of liver mitochondrial DNA is associated with histological severity of nonalcoholic fatty liver disease. Gut. 2013;62:1356–1363. doi: 10.1136/gutjnl-2012-302962. [DOI] [PubMed] [Google Scholar]
- 44.Wei Y., Rector R.S., Thyfault J.P., Ibdah J.A. Nonalcoholic fatty liver disease and mitochondrial dysfunction. World Journal of Gastroenterology. 2008;14:193–199. doi: 10.3748/wjg.14.193. [DOI] [PMC free article] [PubMed] [Google Scholar]
- 45.J-a Kim, Wei Y., Sowers J.R. Role of mitochondrial dysfunction in insulin resistance. Circulation Research. 2008;102:401–414. doi: 10.1161/CIRCRESAHA.107.165472. [DOI] [PMC free article] [PubMed] [Google Scholar]
- 46.Lieber C.S., Leo M.A., Mak K.M., Xu Y., Cao Q., Ren C. Model of nonalcoholic steatohepatitis. American Journal of Clinical Nutrition. 2004;79:502–509. doi: 10.1093/ajcn/79.3.502. [DOI] [PubMed] [Google Scholar]
- 47.Rector R.S., Thyfault J.P., Uptergrove G.M., Morris E.M., Naples S.P., Borengasser S.J. Mitochondrial dysfunction precedes insulin resistance and hepatic steatosis and contributes to the natural history of non-alcoholic fatty liver disease in an obese rodent model. Journal of Hepatology. 2010;52:727–736. doi: 10.1016/j.jhep.2009.11.030. [DOI] [PMC free article] [PubMed] [Google Scholar]
- 48.Vance J.E. MAM (mitochondria-associated membranes) in mammalian cells: lipids and beyond. Biochimica et Biophysica Acta. 2014;1841:595–609. doi: 10.1016/j.bbalip.2013.11.014. [DOI] [PubMed] [Google Scholar]
- 49.Holme E., Greter J., Jacobson C.E., Larsson N.G., Lindstedt S., Nilsson K.O. Mitochondrial ATP-synthase deficiency in a child with 3-methylglutaconic aciduria. Pediatric Research. 1992;32:731–735. doi: 10.1203/00006450-199212000-00022. [DOI] [PubMed] [Google Scholar]
- 50.Jimenez L., Laporte D., Duvezin-Caubet S., Courtout F., Sagot I. Mitochondrial ATP synthases cluster as discrete domains that reorganize with the cellular demand for oxidative phosphorylation. Journal of Cell Science. 2014;127:719–726. doi: 10.1242/jcs.137141. [DOI] [PubMed] [Google Scholar]
- 51.Buzhynskyy N., Sens P., Prima V., Sturgis J.N., Scheuring S. Rows of ATP synthase dimers in native mitochondrial inner membranes. Biophysical Journal. 2007;93:2870–2876. doi: 10.1529/biophysj.107.109728. [DOI] [PMC free article] [PubMed] [Google Scholar]
- 52.Habersetzer J., Ziani W., Larrieu I., Stines-Chaumeil C., Giraud M.F., Brèthes D. ATP synthase oligomerization: from the enzyme models to the mitochondrial morphology. International Journal of Biochemistry & Cell Biology. 2013;45:99–105. doi: 10.1016/j.biocel.2012.05.017. [DOI] [PubMed] [Google Scholar]
- 53.Paumard P., Vaillier J., Coulary B., Schaeffer J., Soubannier V., Mueller D.M. The ATP synthase is involved in generating mitochondrial cristae morphology. EMBO Journal. 2002;21:221–230. doi: 10.1093/emboj/21.3.221. [DOI] [PMC free article] [PubMed] [Google Scholar]
- 54.Arselin G., Gandar J.C., Guerin B., Velours J. Isolation and complete amino acid sequence of the mitochondrial ATP synthase epsilon-subunit of the yeast Saccharomyces cerevisiae. Journal of Biological Chemistry. 1991;266:723–727. [PubMed] [Google Scholar]
- 55.Colombini M. VDAC structure, selectivity, and dynamics. Biochimica et Biophysica Acta. 2012;1818:1457–1465. doi: 10.1016/j.bbamem.2011.12.026. [DOI] [PMC free article] [PubMed] [Google Scholar]
- 56.Anflous-Pharayra K., Lee N., Armstrong D.L., Craigen W.J. VDAC3 has differing mitochondrial functions in two types of striated muscles. Biochimica et Biophysica Acta. 2011;1807:150–156. doi: 10.1016/j.bbabio.2010.09.007. [DOI] [PMC free article] [PubMed] [Google Scholar]
- 57.Anflous-Pharayra K., Cai Z.J., Craigen W.J. VDAC1 serves as a mitochondrial binding site for hexokinase in oxidative muscles. Biochimica et Biophysica Acta. 2007;1767:136–142. doi: 10.1016/j.bbabio.2006.11.013. [DOI] [PubMed] [Google Scholar]
Associated Data
This section collects any data citations, data availability statements, or supplementary materials included in this article.
Supplementary Materials
GO-term analysis of significantly regulated liver proteins during developing HF-induced hepatic insulin resistance and 6212 protein background dataset.
Via quantitative proteomics liver membrane protein profiles were assessed in random-fed male mice. The tables depict results from GO-term analyses performed with proteins significantly differentially expressed in livers obtained from 7 (no enrichment), 14, or 21 days HF- versus LF-treated mice and to avoid an organ-specific bias based on a custom-made 6212 liver protein background dataset (provided). n = 6–7/group. HFd7: FDR<20%, HFd14 and HFd21: FDR<10%.