

Abstract
Objective
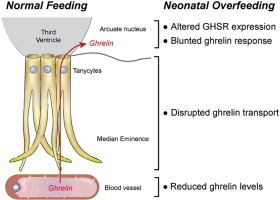
Excess nutrient supply and rapid weight gain during early life are risk factors for the development of obesity during adulthood. This metabolic malprogramming may be mediated by endocrine disturbances during critical periods of development. Ghrelin is a metabolic hormone secreted from the stomach that acts centrally to promote feeding behavior by binding to growth hormone secretagogue receptors in the arcuate nucleus of the hypothalamus. Here, we examined whether neonatal overnutrition causes changes in the ghrelin system.
Methods
We used a well-described mouse model of divergent litter sizes to study the effects of postnatal overfeeding on the central and peripheral ghrelin systems during postnatal development.
Results
Mice raised in small litters became overweight during lactation and remained overweight with increased adiposity as adults. Neonatally overnourished mice showed attenuated levels of total and acyl ghrelin in serum and decreased levels of Ghrelin mRNA expression in the stomach during the third week of postnatal life. Normalization of hypoghrelinemia in overnourished pups was relatively ineffective at ameliorating metabolic outcomes, suggesting that small litter pups may present ghrelin resistance. Consistent with this idea, neonatally overnourished pups displayed an impaired central response to peripheral ghrelin. The mechanisms underlying this ghrelin resistance appear to include diminished ghrelin transport into the hypothalamus.
Conclusions
Early postnatal overnutrition results in central resistance to peripheral ghrelin during important periods of hypothalamic development. Because ghrelin signaling has recently been implicated in the neonatal programming of metabolism, these alterations in the ghrelin system may contribute to the metabolic defects observed in postnatally overnourished mice.
Keywords: Ghrelin, Hypothalamus, Nutrition, Programming, Hormone, Tanycytes
Abbreviations: AgRP, agouti-related peptide; ARH, arcuate nucleus; DMH, dorsomedial nucleus; GOAT, ghrelin O-acyltransferase; GHSR, growth hormone secretagogue receptor; HFHS, high-fat/high-sucrose diet; LHA, lateral hypothalamic area; MBH, mediobasal hypothalamus; ME, median eminence; NL, normal litters; NPY, neuropeptide Y; P, postnatal day; POMC, pro-opiomelanocortin; PVH, paraventricular nucleus; SL, small litter
Graphical abstract
1. Introduction
Over the past three decades, the prevalence of obesity and type II diabetes has increased at an alarming rate, including among children and adolescents [1,2]. Epidemiological data have suggested that excess nutrition and growth during pre- and/or post-natal life may contribute to the etiology of obesity and related diseases in later life, particularly in an environment with a wide availability of calorie-dense foods [3,4]. The results of experiments in a variety of animal models also support a link between the perinatal nutritional environment and the programming of energy balance “set points” [5–8]. Because of the importance of postnatal organ development, including that of the brain, animal models of postnatal metabolic programming have been developed to specifically target this developmental period. An animal model that has proven very useful for the study of postnatal overfeeding is a reduction of litter size. Pups raised in small litters (SL) display accelerated growth during the pre-weaning period, and these animals remain overweight throughout life [9–12]. In addition, postnatally overfed animals show accelerated and exacerbated weight gain and altered glucose tolerance when fed an obesogenic diet [10,12].
The precise biological substrates that mediate the effects of early postnatal overfeeding on later metabolic health are not fully understood. However, there is a growing appreciation that the developmental programming of hypothalamic systems involved in energy balance regulation by the perinatal environment represents a possible cause of obesity and related diseases. The rodent hypothalamus develops primarily during the postnatal period under the influence of intrinsic and environmental cues (see [13] for a review). Perturbations in the development of projections from the arcuate nucleus of the hypothalamus (ARH) are a common feature of animals subjected to nutritional insults during perinatal life, including in postnatally overfed mice [14–19]. Changes in the circulating levels of metabolic hormones, such as the adipocyte hormone leptin, in response to nutritional challenges that occur during early life represent a likely cause for the nutrition-induced alterations in hypothalamic development. For example, maternal obesity and postnatal overnutrition increase leptin levels throughout postnatal life and cause central leptin resistance during critical periods of hypothalamic development [10,16,20]. In contrast, maternal malnutrition during pregnancy and/or lactation blunts the naturally occurring postnatal leptin surge [14,15,21]. Remarkably, daily leptin treatment during early postnatal life in pups born to malnourished dams normalizes their metabolic abnormalities [22], indicating that the developmental actions of leptin contribute to the adult metabolic phenotype.
The gut-derived hormone ghrelin is also particularly well suited to transmit signals to the developing brain in response to alterations in the nutritional environment. In adults, circulating ghrelin levels are influenced by nutritional status [23–26], and neonatal ghrelin plays an important role in hypothalamic development and lifelong metabolic regulation [27]. However, whether ghrelin levels are regulated in response to nutritional challenges during early life and whether neonatal nutrition influences the hypothalamic reponse to ghrelin remain unknown. In the present study, we used the small litter model to determine whether overnutrition during early postnatal life influences the development of the ghrelin system and the sensitivity of hypothalamic neurons to ghrelin.
2. Material and methods
2.1. Animals
Offspring of C57BL6 mice (Charles River Laboratory) produced in our mouse colony were used in these studies. Litters were normalized to 7 pups per litter on postnatal day 1 (P1), with 4 male and 3 female pups per litter. On P3, some litters were culled to 3 pups per litter (2 male + 1 female pups, SL = small litter) to induce postnatal overnutrition, whereas the control litters were maintained with 7 pups/litter (NL = normal litter). Animals were fed standard chow following weaning unless otherwise specified. Only male pups were used for the studies. Each experimental group in all experiments consisted of offspring from at least 3 litters. The animal usage was in compliance with and approved by the Institutional Animal Care and Use Committee of the University of Lille and the Saban Research Institute of the Children's Hospital of Los Angeles.
2.2. Physiological measurements
Pups were weighed once every two days from P4 to P22 and once weekly after weaning using an analytical balance. Body composition analysis (fat/lean mass) was performed at P120 using a LaTheta 100 X-ray Computed Tomography scanner. Food intake and respiratory exchange ratio (RER) were monitored at P90 using a combined indirect calorimetry system (TSE systems). Briefly, after adaptation for 3 days, O2 and CO2 production were measured for 3 days to determine the respiratory exchange ratio. In addition, food intake was determined continuously by the integration of weighing sensors fixed at the top of the cage from which the food containers were suspended into the sealed cage environment. Blood glucose levels were measured on P180 after overnight fasting using a glucometer (OneTouch Ultra, Johnson & Johnson). For the high-fat/high-sucrose (HFHS) challenge, mice were divided into two groups on P120: a first group was fed a standard chow diet for 8 weeks (also referred as “control” mice). A second group was fed for 8 weeks with a high-fat diet (60% fat) plus sucrose in the drinking water (20% wt/vol) (also referred as “HFHS” mice).
2.3. Ghrelin assays
Pups were decapitated on P8, P12, P14, P16, P22 and P60 and trunk blood was collected in a chilled tube containing Pefabloc (AEBSF, Roche Diagnostics). The collected serum was also acidified with 1 N HCl to achieve a final concentration of 0.05 N and then stored at −20 C until use. Total and acyl ghrelin levels in the serum were assayed using ELISA kits (Millipore). Acyl ghrelin levels were also characterized in mouse neonates injected with ghrelin. For this, P16 mice were injected with various doses of ghrelin (5, 10, and 50 ug/kg) or saline, and 15 min after injection the trunk blood was collected as described above.
2.4. Real-time qPCR analysis
The ARH (including the median eminence), DMH, and stomach of P14, P16, P22, and P60 mice (n = 4–6 per group) were dissected. For the ghrelin-induced changes in neuropeptide expression, P14 mice were given an intraperitoneal injection of ghrelin (Phoenix Pharmaceuticals, 2 mg/kg) or vehicle alone (0.9% NaCl) (n = 3–5) and were sacrificed 2 h later. Total RNA from the ARH and DMH was isolated using the Arcturus PicoPure RNA Isolation Kit (Life Technologies). Total RNA from the stomach was isolated using the RNeasy Lipid Tissue kit (Qiagen). cDNA was generated using the high-capacity cDNA Reverse Transcription Kit (Life Technologies). Quantitative real-time PCR analysis was performed using TaqMan Fast Universal PCR MasterMix. The mRNA expression was calculated using the 2−ddCt method after normalization to gapdh (Mm99999915_g1) as a housekeeping gene. The inventoried TaqMan Gene expression assays for Ghsr (Mm00616415_m1), Ghrelin (Mm00445450_m1), Goat (Mm01200389_m1), Pomc (Mm00435874_m1), Agrp (Mm00475829_g1), Npy (Mm03048253_m1) were used. All assays were performed using an Applied Biosystems StepOnePlus real-time PCR system.
2.5. Chronic neonatal injection of ghrelin
Starting at P12, pups were treated twice daily with intraperitoneal injections of ghrelin (Phoenix Pharmaceuticals, 10 ug/kg) for a total of 10 days. Controls received equivolume injections of vehicle (0.9% NaCl).
2.6. cFos analysis
On P14, P16, P22, and P60 mice were given an intraperitoneal injection of ghrelin (Phoenix Pharmaceuticals, 2 mg/kg) (n = 4–7) or vehicle alone (0.9% NaCl) (n = 3–9) and were then perfused 2 h later with a solution of 4% paraformaldehyde. A separate cohort of mice received an intracerebroventricular injection of ghrelin at P14. For this purpose, 1 ul of ghrelin (240 ug/ml) or vehicle (0.9% NaCl) was stereotactically infused over 3 min into the lateral ventricle (1 mm lateral to Bregma 0, depth of 3 mm) under isoflurane anesthesia. Pups were perfused 90 min later with a solution of 4% paraformaldehyde.
The brains were then frozen, cut into 30-um thick sections, and processed for cFos immunostaining using standard procedures [28]. Briefly, after pretreatment overnight in a mixture of 0.3% Triton X-100 and 2% normal goat serum, sections were incubated for 48 h at 4 C in a rabbit primary antiserum directed against the N-terminal domain of Fos (Ab-5, Oncogene; 1:2,000). The primary antibody was localized with Alexa Fluor 488 Goat anti-Rabbit IgG (Invitrogen; 1:200). The sections were counterstained using bis-benzamide (Invitrogen; 1:3,000) to visualize the cell nuclei and coverslipped with buffered glycerol (pH 8.5).
Two sections through the ARH and DMH from animals of each experimental group (n = 4–7 animals per group) were imaged using a Zeiss AxioImager Z1 Microscope equipped with a 20X objective. Slides were numerically coded to obscure the treatment group. The number of cFos-immunopositive cells in the ARH and DMH were manually counted using the point tool of the ImageJ analysis software (NIH). The average number of cells counted in two sections from each mouse was used for statistical comparisons.
2.7. Assessment of ghrelin uptake
Fluorescent bioactive ghrelin (Cisbio Bioassays, 25 nmol/mouse) [29] was injected intravenously, and mice were sacrificed 5 min later to the assess tanycytic ghrelin uptake by fluorescence microscopy as previously described [30]. The primary antibodies used for these studies were a rat anti-PECAM (1:200, generous gift from Dr. Britta Engelhardt, Theodor Kocher Institut, Bern, Switzerland) and a rabit anti-GFAP (Dako Cytomation; 1:2,000).
For the in vitro analysis of the ghrelin transport, tanycytes were isolated from the median eminence of the hypothalamus of P10 rats as described previously [29,30]. The internalization of ghrelin was assayed using clathrin immunoprecipitation in tanycytes after 15 min of ghrelin treatment and using clathrin immunolabeling of tanycytes cultured on coverslips and treated for 15 min with fluorescent ghrelin (Cisbio Bioassays, 50 nM) [29,30].
To determine the ability of ghrelin to be transported to the MBH, mice were intraperitoneally injected with ghrelin (Phoenix Pharmaceuticals, 2 mg/kg) and sacrificed 45 min later. The MBH was then rapidly microdissected and subjected to western blotting as previously described [30]. The primary antibodies used for western blotting were anti-ghrelin (AbCam, 1:500) and anti-ERK (Cell Signaling, 1:1,000).
2.8. Statistical analyses
All values are expressed as the means ± SEM. Statistical analyses were conducted using GraphPad PRISM (version 5.0d). Statistical significance was determined using unpaired two-tailed Student's t-tests and a two-way ANOVA followed by the Bonferroni multiple comparisons post hoc test. A one-way ANOVA, followed by the Tukeys multiple comparisons test was used for the western blot analysis. P-values less than 0.05 were considered to be statistically significant. Experimental units used for statistical comparisons correspond to the number of litters.
3. Results
3.1. Small litter rearing causes metabolic disturbances
To manipulate nutrient intake specifically during postnatal (pre-weaning) life, we used a well-described mouse model of divergent litter size. To this aim, litter size was manipulated beginning on P3 such that small litters (overfed) had 3 pups and normal litters (normally fed) had 7 pups. Small litter rearing was associated with changes in growth rates as revealed by a significant increase in pre-weaning body weight in overfed animals compared with normally fed mice (Figure 1A). As early as P4, the pups raised in small litters displayed heavier body weights than did the control animals (Figure 1A). Neonatally overfed animals remained heavier after weaning, and this elevated body weight persisted into adulthood (Figure 1B). The cumulative food intake was significantly higher in adult SL mice compared with control mice (Figure 1C). We also evaluated adiposity and found that SL mice displayed an elevated fat mass compared with NL mice (Figure 1E). In addition, the fasting glucose levels were significantly elevated in the adult SL mice fed a chow diet (Figure 1H). However, SL mice were comparable to NL mice with regard to respiratory quotient (Figure 1D), locomotor activity, oxygen consumption (VO2), and carbon dioxide production (VCO2) (data not shown). To determine whether neonatal overnutrition programs diet-induced obesity, we exposed SL and NL mice to a high-fat/high-sucrose (HFHS) regimen starting at 17 weeks of age. SL mice exposed to an HFHS regimen displayed a greater increase in body weight compared with NL mice (Figure 1F). Differences in body weight were detected as early as 1 week after HFHS feeding began and persisted throughout the HFHS exposure (Figure 1F). This elevated body weight was accompanied by greater adiposity (Figure 1G). However, SL mice exposed to an HFHS diet had a similar increase in fasting glucose levels compared with SL mice fed a chow diet (Figure 1H).
Figure 1.
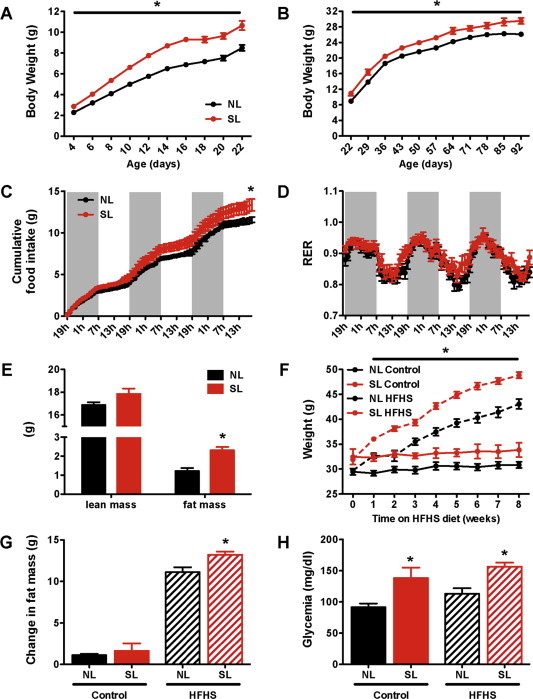
Small litter rearing accelerates postnatal weight gain and causes long-term metabolic alterations. (A) Pre- and (B) post-weaning body weight curves in C57BL6 male mice raised in small (SL) and normal (NL) litters and fed a chow diet after weaning (n = 15–16 per group). (C) Cumulative food intake of adult NL and SL mice on chow diet (n = 8 per group). (D) Respiratory exchange ratio of adult NL and SL mice (n = 8 per group). (E) Body composition of adult SL and NL mice (n = 9–11 per group). (F) Weight gain, (H) change in total fat mass, and (I) fasting glycemia of adult SL and NL mice fed a high-fat/high-sucrose diet (HFHS) for 8 weeks (n = 10–15 per group). Values are shown as the mean ± SEM. *P < 0.05 versus NL.
3.2. Neonatal overnutrition influences the pattern of postnatal ghrelin secretion
Given the importance of feeding status on ghrelin secretion in adults [23–26], we next investigated circulating total and acyl ghrelin levels in neonatally overfed mice. Serum ghrelin levels increased gradually after birth to reach adult-like levels by 3 weeks of life in normally fed mice (Figure 2A and B) [27,31,32]. However, mice raised in SLs displayed attenuated total ghrelin levels at P12 and P16 (Figure 2A) and attenuated acyl ghrelin levels at P16 and P22 (Figure 2B). In addition the ratio of acyl to total ghrelin was diminished in SL pups at P16 compared with NL mice (Supplementary Figure 1). Stomach levels of Ghrelin and Goat (the ghrelin activating enzyme) mRNA were increased in control pups between P14 and P22; however, levels remained unchanged in overfed pups (Figure 2C and D). Notably, these changes in circulating ghrelin and Ghrelin mRNA expression appear restricted to early postnatal life because in adult mice no difference in circulating ghrelin levels or stomach expression patterns was evident between control and neonatally overfed mice.
Figure 2.
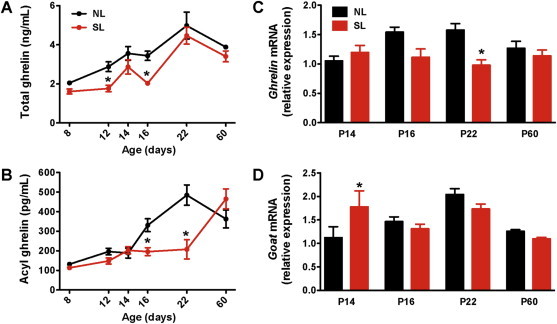
Neonatal overfeeding attenuates ghrelin levels during postnatal life. Serum (A) total and (B) acyl ghrelin levels of P8, P12, P14, P16, P22, and P60 (adult) mice raised in normal litters (NL) and small (SL) litters (n = 4–10 per group). Relative expression of (C) Ghrelin and (D) Goat mRNA in the stomach of P14, P16, P22, and P60 (adult) mice raised in SL and NL (n = 4–6 per group). Values are shown as the mean ± SEM. *P < 0.05 versus NL.
3.3. Neonatal ghrelin injections have moderate effects on the metabolic phenotype of SL mice
Neonatally overnourished pups displayed a reduction in circulating ghrelin levels during early postnatal life. Based on these observations, we next investigated whether neonatal ghrelin injections in SL mice rescue the metabolic phenotype of these mice. Ghrelin was administered twice daily in pups from P12 to P22, i.e., when endogenous ghrelin levels are low in SL mice. We determined through pilot studies that a dose of 10 ug/kg normalizes the ghrelin levels in SL mice (Figure 3A). Neonatal administration of ghrelin to SL mice did not result in changes in body weight or body composition (Figure 3B–E). Similarly, SL mice treated neonatally with ghrelin displayed similar weight and fat gain when challenged for 8 weeks with an obesogenic (HFHS) diet (data not shown). However, the fasting glycemia of SL mice neonatally injected with ghrelin was significantly reduced compared with saline-treated pups (Figure 3F).
Figure 3.
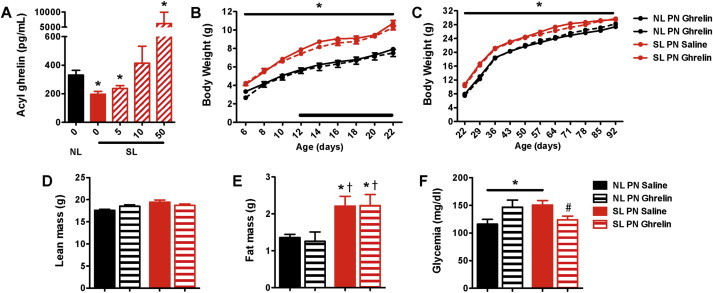
Neonatal ghrelin injections have moderate effects on the metabolic phenotype of neonatally overfed mice. (A) Serum acyl ghrelin levels of P16 NL pups injected with saline and SL pups injected with ghrelin (5, 10, and 50 ug/kg i.p.) or saline (n = 2–3 per group). (B) Pre- and (C) post-weaning growth curves (body weights) of SL and NL mice neonatally injected with ghrelin (10 ug/kg i.p.) or saline (n = 7–26 per group); the black bar represents the injection period. (D) Lean mass, (E) fat mass, and (F) fasting glycemia of adult SL and NL mice neonatally injected with ghrelin (10 ug/kg i.p.) or saline (n = 7–11 per group). Values are shown as the mean ± SEM. *P < 0.05 versus NL saline; †P < 0.05 versus NL ghrelin; #P < 0.05 versus SL saline.
3.4. Postnatal overnutrition alters the ability of peripheral ghrelin to modulate ARH neurons
Our findings indicate that neonatal ghrelin treatment is relatively ineffective at influencing metabolic outcomes in SL mice. A possible explanation for this lack of response is that brain regions that normally convey the metabolic effects of ghrelin are insensitive to ghrelin during neonatal life and that SL mice may present hormonal resistance. To test this hypothesis, we first examined the mRNA expression of the ghrelin receptor Ghsr in the arcuate nucleus of the hypothalamus (ARH)/median eminence (ME) of SL and NL mice. The rationale for focusing on this region, specifically, is because the ARH is a key site for mediating the effects of ghrelin on feeding [33–35], and under normal conditions neonatal ghrelin acts on the ARH to influence its development [27]. The ARH/ME of P14 and P60 SLs mice contained levels of Ghsr mRNA that were similar to those found in NL mice (Figure 4A). However, neonatal overnutrition caused a reduction in Ghsr mRNA levels at P16 and P22 (Figure 4A). We next studied the ability of peripheral ghrelin to activate ARH neurons. We used cFos expression as a surrogate marker of neuronal activation [36]. Peripheral ghrelin injection caused a marked increase in the number of cFos-immunoreactive cells in the ARH of control (NL) mice at P14, P16, and P22 (Figure 4B). In NL pups, cFos induction was found in 35% and 25% of NPY and POMC neurons, respectively, (Supplementary Figure 2B–C) and only a few number of cFos-immunoreactive cells was found in the ME (Supplementary Figure 2A). The induction of cFos immunoreactivity following peripheral ghrelin administration was significantly attenuated in the ARH of SL pups (Figure 4B). Nevertheless, neonatal ghrelin administration caused a significant increase in Ghsr mRNA levels in the ARH/ME of both NL and SL mice (Figure 4C). In addition, there were no differences in ghrelin-induced cFos expression between SL and NL mice at P60 (Figure 4B), indicating that the altered ghrelin response observed in SL mice is restricted to early postnatal life.
Figure 4.
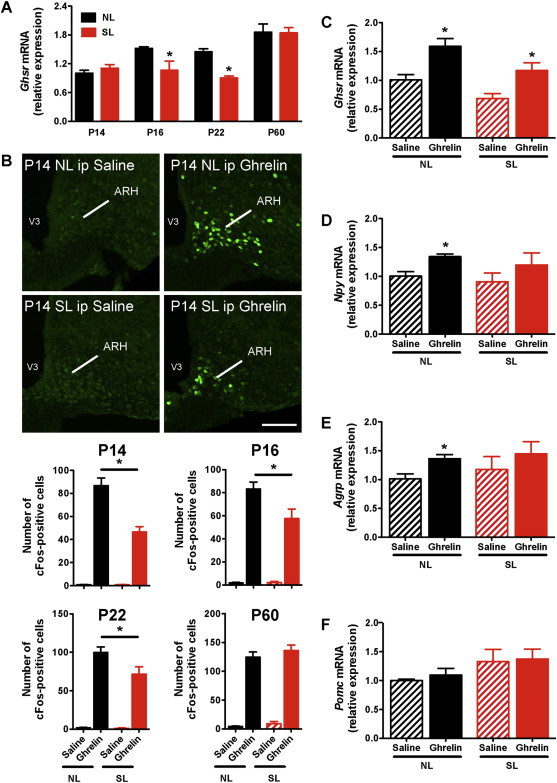
Attenuated central response to peripheral ghrelin in neonatally overfed pups. (A) Relative expression of Ghsr mRNA in the arcuate nucleus/median emimence of P14, P16, P22, and P60 (adult) mice raised in SLs and NLs (n = 4–5 per group). (B) Representative images and quantification of cFos-immunoreactive cells in the arcuate nucleus (ARH) 2 h after intraperitoneal (ip) administration of ghrelin (2 mg/kg) or saline alone in P14, P16, P22, and P60 mice raised in SLs and NLs (n = 4–7 per group). (C) Ghsr, (D) Npy, (E) Agrp, and (F) Pomc mRNA expression in the arcuate nucleus/median eminence of P14 SL and NL pups intraperitoneally injected with ghrelin (2 mg/kg i.p.) or saline alone (n = 3–5 per group). Values are shown as the mean ± SEM. (A) *P < 0.05 versus NL. (B) *P < 0.05 versus NL ghrelin; (C–E) *P < 0.05 versus saline (C–E). Scale bar, 200 um.
Within the mature ARH, ghrelin acts primarily on AgRP/NPY neurons to stimulate food intake [34,35]. Previous studies indicated that in normally fed animals, ghrelin administration stimulates Agrp and Npy mRNA expression [26,37,38]. Consistent with these data, we found that peripheral administration of ghrelin to NL mice at P14 increased the expression of Agrp and Npy mRNA (Figure 4D and E). However, the same ghrelin treatment did not result in changes in Agrp and Npy mRNA levels in the ARH of P14 SL mice (Figure 4D and E). Additionally, ghrelin injection at P14 did not change Pomc mRNA expression in either NL or SL mice (Figure 4F).
To determine whether neonatal overfeeding also affected the ability of peripheral ghrelin to modulate other non-ARH neurons, we examined ghrelin-induced cFos immunoreactivity in the DMH, which is another hypothalamic nucleus known to contain high levels of ghrelin receptors [27,39,40]. In contrast to the reduction in Ghsr mRNA expression observed in the ARH of SL pups, Ghsr mRNA levels appeared to be unaltered in the DMH of SL neonates (Figure 5A). Additionally, peripheral ghrelin administration did not result in cFos induction in the DMH of either NL or SL neonates (Figure 5B). Furthermore, consistent with previous report showing that Ghsr expression is low in non-ARH nuclei during postnatal development [27], ghrelin administration did not result in a significant induction of cFos expression in the VMH, LHA, and PVH of SL and NL pups at P14 and P16 (data not shown).
Figure 5.
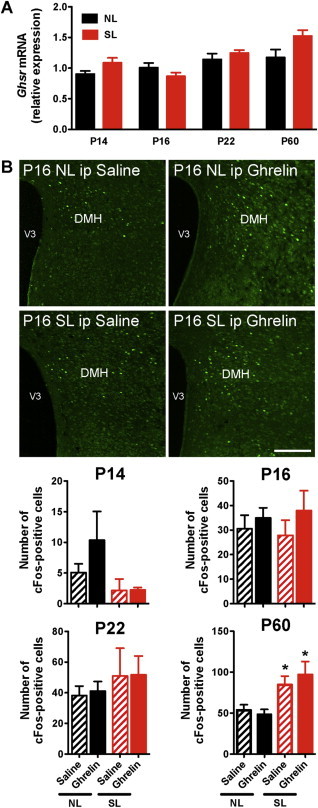
Peripheral ghrelin does not induce neuronal activation in the dorsomedial hypothalamic nucleus (DMH) during neonatal life. (A) Relative expression of Ghsr mRNA in the dorsomedial nucleus of P14, P16, P22, and P60 (adult) mice raised in SLs and NLs (n = 4–5 per group). (B) Representative images and quantification of cFos-immunoreactive cells in the dorsomedial nucleus (DMH) nucleus 2 h after intraperitopenal (ip) administration of ghrelin (2 mg/kg) or saline alone in P14, P16, P22, and P60 mice raised in SLs and NLs (n = 4–8 per group). Values are shown as the mean ± SEM. *P < 0.05 versus NL. Scale bar, 400 um.
3.5. Postnatal overnutrition alters ghrelin access to the brain
The mechanisms underlying hormonal resistance remain elusive but likely include defective transport of hormones across the blood–brain barrier to the cerebrospinal fluid [41,42] or to their sites of action within the brain [43]. To test the hypothesis that ARH neurons of SL mice can respond to ghrelin, we evaluated the ability of central ghrelin injection to activate cFos immunoreactivity in the ARH. In sharp contrast to the peripheral administration of ghrelin, intracerebroventricular injection of ghrelin induced similar cFos immunoreactivity in the ARH of both NL and SL pups at P14 (Figure 6). These observations indicate that the ARH neurons of SL mice retain the ability to respond to ghrelin and suggest that ghrelin transport from the periphery to the brain may be defective in neonatally overnourished mice.
Figure 6.
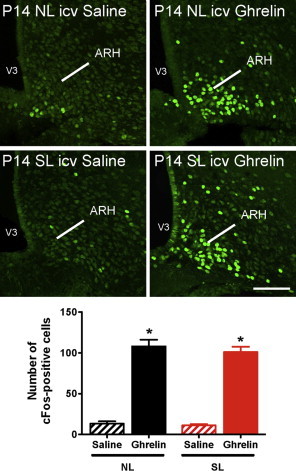
Normal central response to central ghrelin in neonatally overfed pups. Representative images and quantification of cFos-immunoreactive cells in the arcuate nucleus (ARH) 90 min after intracerebroventricular (icv) administration of ghrelin (240 ug/ml) or saline alone in P14 mice raised in SLs and NLs (n = 3–6 per group). Values are shown as the mean ± SEM. *P < 0.05 versus saline. Scale bar, 200 um.
It was recently shown that tanycytes, which are specialized hypothalamic glial cells located in the median eminence (ME), play a critical role in transporting peripheral hormones, such as leptin, from the periphery to the ARH [30]. Notably, by P10 tanycytes appear to be fully developed and display an adult-like morphology [44]. To determine whether tanycytes are also important for ghrelin uptake, we intravenously administered fluorescently labeled bioactive ghrelin [29] to wild-type mice. We observed that fluorescent ghrelin was exclusively present in ME tanycytes 5 min after injection (Figure 7A). We further explored the role of tanycytes in transporting ghrelin in vitro using primary cultures of tanycytes from neonatal rats. The results indicate that after 15 min, cultured tanycytes internalized fluorescent ghrelin through clathrin-coated vesicles (Figure 7B and C). These in vivo and in vitro observations support a role for ME tanycytes in transporting ghrelin from the periphery to the brain in the same manner as other hormones such as leptin [30]. To examine whether neonatal overnutrition alters the ability of ghrelin to be transported to the ARH, we performed western blots of the MBH (containing the ARH) from P14 SL and NL mice 45 min after an intraperitoneal ghrelin injection. Significant amounts of exogenous ghrelin were detected in the MBH of NL neonates (Figure 7D). However, the same ghrelin treatment did not result in the presence of ghrelin in the MBH of SL pups (Figure 7D), suggesting that neonatal overfeeding alters ghrelin access to the MBH. To investigate if the defective ghrelin transport observed in SL mice can be attributed to structural abnormalities in tanycytes, we compared the overall organization of tanycytes in the ARH/ME of NL and SL mice at P14. The gross morphology and the number of tanycytes appeared to be similar between NL and SL pups (Supplementary Figure 3), suggesting that the alteration in ghrelin transport in overnourished pups likely involves non-structural tanycytic perturbations such as intracellular defects.
Figure 7.
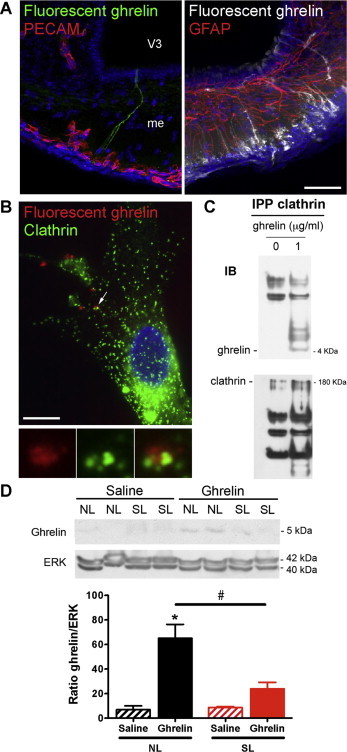
Altered ghrelin transport in the mediobasal hypothalamus of overfed pups. (A) Representative images showing tanycytic processes and cell bodies labeled by fluorescent ghrelin (25 nmoles per animal; green on left panel, white on right panel) 5 min after intravenous injection. Left panel, PECAM-immunoreactive pituitary portal blood vessels are shown in red. Right panel, GFAP-immunoreactive astrocytes are shown in red. (B) Representative images of clathrin immunoreactivity (green) in tanycytes treated in vitro for 15 min with fluorescent ghrelin (50 nM, red). (D) Representative western blots and quantification of ghrelin and clathrin in immunoprecipitated (IPP) clathrin-coated vesicles from tanycytes treated in vitro for 15 min with vehicle or ghrelin (1 μg/ml). (D) Representative western blots and quantification of ghrelin in mediobasal hypothalamic explants from P14 normal litter (NL) and small litter (SL) mice 45 min after intraperitoneal administration of ghrelin (2 mg/kg) or saline (n = 4 per group). Values are shown as the mean ± SEM. *P < 0.05 versus NL saline; #P < 0.05 versus NL ghrelin. Scale bar, 10 um.
4. Discussion
A variety of peripheral signals contribute to the regulation of food intake and energy homeostasis in adult life and it has been suggested that metabolic hormones are capable of transmitting signals to the developing organism in response to alterations in the nutritional environment and may underlie potential maladaptive responses to early metabolic perturbations. In the present study, we show that postnatal overnutrition alters the ability of the gut-derived hormone ghrelin to act on the hypothalamus during an important period of growth and development. Neonatal overfeeding silences the ghrelin system by reducing circulating ghrelin levels, attenuating ghrelin uptake from the periphery to the brain, diminishing ghrelin receptor expression and decreasing the ability of peripheral ghrelin to activate arcuate neurons.
Our findings are generally consistent with data suggesting that small litter rearing causes accelerated postnatal weight gain that leads to persistent increased weight and obesity, especially when animals are exposed to an obesogenic diet [10,12]. Our data indicate that neonatal overnutrition has marked effects on circulating ghrelin levels during important periods of growth and development. A similar reduction in ghrelin levels has previously been reported in adult obese individuals [25,26]. One exception to the negative correlation between body weight and circulating ghrelin level occurs in Prader–Willi Syndrome. This disorder, which is primarily characterized by severe hyperphagia and morbid obesity, is associated with markedly elevated ghrelin levels, including during early life [45,46]. During postnatal development, ghrelin is expressed in a variety of tissues, including the stomach and pancreas [47]. The present study suggests that the reduction in ghrelin levels observed in SL mice is, at least in part, due to altered production of ghrelin by the stomach. The observation that the acyl:total ghrelin ratio and Ghrelin mRNA levels are lower in SL mice despite higher levels of Goat mRNA is intriguing because it suggests that substrate availability may be a more important factor in production of acyl ghrelin in SL mice or that GOAT activity may be markedly reduced in SL mice.
Despite being hypoghrelinemic, SL mice display an attenuated central response to peripheral ghrelin. Exogenous ghrelin administration in SL pups results in an impaired induction of cFos immunoreactivity and does not increase Npy mRNA levels, in contrast to the observations in NL mice. However, direct injection of ghrelin into the brain results in similar cFos activation in both SL and NL. Similarly, Davidowa and colleagues reported that direct exposure of ARH neurons to ghrelin results in a similar electrical response in both overnourished and control pups [48]. These data suggest that the ARH neurons of SL animals can respond to ghrelin but that neonatal overnutrition alters the ability of peripheral ghrelin to reach these neurons. Supporting this hypothesis, our western blot analysis shows that peripheral ghrelin injection results in an increased ghrelin content in the ARH of NL mice; SL mice do not exhibit this effect. The cellular mechanisms involved in the attenuated ghrelin transport likely involve alteration in ghrelin uptake by tanycytes. These ependymoglial cells have recently emerged as critical regulators of hormone transport into the brain, including into the ARH [30,49]. In addition, diet-induced obesity in adults alters the ability of these cells to transport hormones, such as leptin, into the brain [30].
The relative contribution of these early alterations in the ghrelin system to the ultimate phenotype of SL pups remains to be investigated. However, based on recent reports indicating that neonatal ghrelin plays a lifelong role in energy balance regulation, it is likely that these perturbations in ghrelin secretion and action may contribute to the metabolic defects observed in postnatally overnourished mice. Recent data indicate that in addition to its regulatory role in mature animals, ghrelin acts during early postnatal life as a signal that can influence hypothalamic development. Neonatal ghrelin blockade results in enhanced densities of ARH projections. In contrast, abnormally elevated levels of ghrelin during postnatal life attenuate the normal development of ARH projections [27]. Remarkably, both neonatal ghrelin blockade and neonatal hyperghrelinemia are associated with the same metabolic phenotype, i.e., elevated body weight and hyperglycemia [27]. In our studies, normalizing the ghrelin levels in SL neonates did not result in marked changes in metabolic outcomes, which is consistent with the idea that the brain of neonatally overfed mice is relatively insensitive to ghrelin. Nevertheless, neonatal ghrelin injections improve glucose levels in SL mice. Because SL mice display central resistance to peripheral ghrelin, the effects of neonatal ghrelin on glucose levels likely involves a peripheral action, such as a direct action in the pancreas. Dembinski and colleagues previously reported that exposure of newborn rats to ghrelin for 7 or 14 days causes a reduction in pancreatic weight, attenuated pancreatic DNA synthesis and reduced DNA content, consistent with the idea that ghrelin might act directly on the pancreas to influence its development [50].
The present study supports the emerging concept that neuroendocrine defects during critical periods of development can lead to lifelong metabolic perturbations. Based on the observation that SL mice display early ghrelin resistance, future work will be required to address methods to improve ghrelin sensitivity in neonatally overfed pups. Interestingly, weight loss induced by caloric restriction has been reported to reverse the central ghrelin resistance observed in adult mice with diet-induced obesity [26,51]. However, for metabolic programming, the timing of the intervention will be important. For example, food restriction can either have beneficial or detrimental long-term metabolic effects, depending on whether nutritional intervention occurs at an earlier or later stage of development. Neonatal caloric restriction in obesity-prone rats is associated with ameliorated hypothalamic development and improved metabolism [52]. If caloric restriction occurs after weaning, however, the opposite phenotype is observed, i.e., obesity-prone rats increase their food intake and become even more obese once as they are allowed to eat ad libitum [53].
Acknowledgments
This work was supported by the National Institutes of Health (Grants R01DK84142, P01ES022845 to SGB), the United States Environment Protection Agency (Grant RD83544101), Inserm and University of Lille 2 (Grant Neurobese, to SGB and VP), the “Fondation pour la Recherche Médicale” (Grant DRM20101220423 to SGB and DEQ20130326524 to VP), the Foundation for Prader-Willi Research (to SGB), the Agence National pour la Recherche (Grant ANR-09-BLAN-0267 to VP), and the EU FP7 integrated project (grant agreement n° 266408, “Full4Health”, to SGB). GC was a Ph.D. student supported by a fellowship from Inserm and the Region Nord-Pas-de-Calais.
Conflict of interest
The authors declare no conflict of interest
Appendix A. Supplementary data
The following is the supplementary data related to this article:
References
- 1.Ogden C.L., Carroll M.D., Kit B.K., Flegal K.M. Prevalence of obesity and trends in body mass index among us children and adolescents, 1999-2010. The Journal of the American Medical Association. 2012;307:483–490. doi: 10.1001/jama.2012.40. [DOI] [PMC free article] [PubMed] [Google Scholar]
- 2.Wang Y., Beydoun M.A., Liang L., Caballero B., Kumanyika S.K. Will all Americans become overweight or obese? Estimating the progression and cost of the US obesity epidemic. Obesity (Silver Spring) 2008;16:2323–2330. doi: 10.1038/oby.2008.351. [DOI] [PubMed] [Google Scholar]
- 3.Rogers I. The influence of birthweight and intrauterine environment on adiposity and fat distribution in later life. International Journal of Obesity and Related Metabolic Disorders. 2003;27:755–777. doi: 10.1038/sj.ijo.0802316. [DOI] [PubMed] [Google Scholar]
- 4.Cruz M.L., Shaibi G.Q., Weigensberg M.J., Spruijt-Metz D., Ball G.D.C., Goran M.I. Pediatric obesity and insulin resistance: chronic disease risk and implications for treatment and prevention beyond body weight modification. Annual Review of Nutrition. 2005;25:435–468. doi: 10.1146/annurev.nutr.25.050304.092625. [DOI] [PubMed] [Google Scholar]
- 5.Duque-Guimarães D.E., Ozanne S.E. Nutritional programming of insulin resistance: causes and consequences. Trends in Endocrinology & Metabolism. 2013;24:525–535. doi: 10.1016/j.tem.2013.05.006. [DOI] [PubMed] [Google Scholar]
- 6.Levin B.E. Developmental gene x environment interactions affecting systems regulating energy homeostasis and obesity. Frontiers in Neuroendocrinology. 2010;31:270–283. doi: 10.1016/j.yfrne.2010.02.005. [DOI] [PMC free article] [PubMed] [Google Scholar]
- 7.Taylor P.D., Poston L. Developmental programming of obesity in mammals. Experimental Physiology. 2007;92:287–298. doi: 10.1113/expphysiol.2005.032854. [DOI] [PubMed] [Google Scholar]
- 8.Plagemann A. Perinatal nutrition and hormone-dependent programming of food intake. Hormone Research. 2006;65:83–89. doi: 10.1159/000091511. [DOI] [PubMed] [Google Scholar]
- 9.Davidowa H., Plagemann A. Different responses of ventromedial hypothalamic neurons to leptin in normal and early postnatally overfed rats. Neuroscience Letters. 2000;293:21–24. doi: 10.1016/s0304-3940(00)01475-0. [DOI] [PubMed] [Google Scholar]
- 10.Glavas M.M., Kirigiti M.A., Xiao X.Q., Enriori P.J., Fisher S.K., Evans A.E. Early overnutrition results in early-onset arcuate leptin resistance and increased sensitivity to high-fat diet. Endocrinology. 2010;151:1598–1610. doi: 10.1210/en.2009-1295. [DOI] [PMC free article] [PubMed] [Google Scholar]
- 11.Hou M., Liu Y., Zhu L., Sun B., Guo M., Burén J.. Neonatal overfeeding induced by small litter rearing causes altered glucocorticoid metabolism in rats. PLoS One. 2011;6:e25726. doi: 10.1371/journal.pone.0025726. [DOI] [PMC free article] [PubMed] [Google Scholar]
- 12.Fuente-Martín E., García-Cáceres C., Granado M., Sánchez-Garrido M.A., Tena-Sempere M., Frago L.M. Early postnatal overnutrition increases adipose tissue accrual in response to a sucrose-enriched diet. American Journal of Physiology. Endocrinology and Metabolism. 2012;302:E1586–E1598. doi: 10.1152/ajpendo.00618.2011. [DOI] [PubMed] [Google Scholar]
- 13.Bouret S.G. Organizational actions of metabolic hormones. Frontiers in Neuroendocrinology. 2013;34:18–26. doi: 10.1016/j.yfrne.2013.01.001. [DOI] [PMC free article] [PubMed] [Google Scholar]
- 14.Coupe B., Amarger V., Grit I., Benani A., Parnet P. Nutritional programming affects hypothalamic organization and early response to leptin. Endocrinology. 2013;151:702–713. doi: 10.1210/en.2009-0893. [DOI] [PubMed] [Google Scholar]
- 15.Delahaye F., Breton C., Risold P.-Y., Enache M., Dutriez-Casteloot I., Laborie C. Maternal perinatal undernutrition drastically reduces postnatal leptin surge and affects the development of arcuate nucleus proopiomelanocortin neurons in neonatal male rat pups. Endocrinology. 2008;149:470–475. doi: 10.1210/en.2007-1263. [DOI] [PubMed] [Google Scholar]
- 16.Kirk S.L., Samuelsson A.-M., Argenton M., Dhonye H., Kalamatianos T., Poston L. Maternal obesity induced by diet in rats permanently influences central processes regulating food intake in offspring. PLoS One. 2009;4:e5870. doi: 10.1371/journal.pone.0005870. [DOI] [PMC free article] [PubMed] [Google Scholar]
- 17.Schipper L., Bouyer K., Oosting A., Simerly R.B., van der Beek E.M. Postnatal dietary fatty acid composition permanently affects the structure of hypothalamic pathways controlling energy balance in mice. The American Journal of Clinical Nutrition. 2013;98:1395–1401. doi: 10.3945/ajcn.113.069229. [DOI] [PMC free article] [PubMed] [Google Scholar]
- 18.Bouret S.G., Burt-Solorzano C., Wang C.-H., Simerly R.B. Proc of the 37th Annual Meeting the Society for Neuroscience, San Diego, CA. 2007. Impact of neonatal nutrition on development of brain metabolic circuits in mice. [Google Scholar]
- 19.Caron E., Ciofi P., Prevot V., Bouret S.G. Alteration in neonatal nutrition causes perturbations in hypothalamic neural circuits controlling reproductive function. The Journal of Neuroscience. 2012;32:11486–11494. doi: 10.1523/JNEUROSCI.6074-11.2012. [DOI] [PMC free article] [PubMed] [Google Scholar]
- 20.Bouret S.G., Gorski J.N., Patterson C.M., Chen S., Levin B.E., Simerly R.B. Hypothalamic neural projections are permanently disrupted in diet-induced obese rats. Cell Metabolism. 2008;7:179–185. doi: 10.1016/j.cmet.2007.12.001. [DOI] [PMC free article] [PubMed] [Google Scholar]
- 21.Yura S., Itoh H., Sagawa N., Yamamoto H., Masuzaki H., Nakao K. Role of premature leptin surge in obesity resulting from intrauterine undernutrition. Cell Metabolism. 2005;1:371–378. doi: 10.1016/j.cmet.2005.05.005. [DOI] [PubMed] [Google Scholar]
- 22.Vickers M.H., Gluckman P.D., Coveny A.H., Hofman P.L., Cutfield W.S., Gertler A.M. Neonatal leptin treatment reverses developmental programming. Endocrinology. 2005;146:4211–4216. doi: 10.1210/en.2005-0581. [DOI] [PubMed] [Google Scholar]
- 23.Tschöp M., Smiley D.L., Heiman M.L. Ghrelin induces adiposity in rodent. Nature. 2000:908–913. doi: 10.1038/35038090. [DOI] [PubMed] [Google Scholar]
- 24.Cummings D.E., Purnell J.Q., Frayo R.S., Schmidova K., Wisse B.E., Weigle D.S. A preprandial rise in plasma ghrelin levels suggests a role in meal initiation in humans. Diabetes. 2001;50:1714–1719. doi: 10.2337/diabetes.50.8.1714. [DOI] [PubMed] [Google Scholar]
- 25.Tschöp M., Weyer C., Tataranni P.A., Devanarayan V., Ravussin E., Heiman M.L. Circulating ghrelin levels are decreased in human obesity. Diabetes. 2001;50:707–709. doi: 10.2337/diabetes.50.4.707. [DOI] [PubMed] [Google Scholar]
- 26.Briggs D.I., Enriori P.J., Lemus M.B., Cowley M.A., Andrews Z.B. Diet-induced obesity causes ghrelin resistance in arcuate NPY/AgRP neuron. Endocrinology. 2010;151:4745–4755. doi: 10.1210/en.2010-0556. [DOI] [PubMed] [Google Scholar]
- 27.Steculorum SM, Collden G, Coupe B, Croizier S, Lockie S, Andrews ZB, et al., Ghrelin programs development of hypothalamic feeding circuits. J Clin Invest, in press. [DOI] [PMC free article] [PubMed]
- 28.Bouret S.G., Draper S.J., Simerly R.B. Formation of projection pathways from the arcuate nucleus of the hypothalamus to hypothalamic regions implicated in the neural control of feeding behavior in mice. Journal of Neuroscience. 2004;24:2797–2805. doi: 10.1523/JNEUROSCI.5369-03.2004. [DOI] [PMC free article] [PubMed] [Google Scholar]
- 29.Schaeffer M., Langlet F., Lafont C., Molino F., Hodson D.J., Roux T. Rapid sensing of circulating ghrelin by hypothalamic appetite-modifying neurons. Proceedings of the National Academy of Sciences. 2013;110:1512–1517. doi: 10.1073/pnas.1212137110. [DOI] [PMC free article] [PubMed] [Google Scholar]
- 30.Balland E., Dam J., Langlet F., Caron E., Steculorum S., Messina A. Hypothalamic tanycytes are an ERK-gated conduit for leptin into the brain. Cell Metabolism. 2014;19:293–301. doi: 10.1016/j.cmet.2013.12.015. [DOI] [PMC free article] [PubMed] [Google Scholar]
- 31.Hayashida T., Nakahara K., Mondal M.S., Date Y., Nakazato M., Kojima M. Ghrelin in neonatal rats: distribution in stomach and its possible role. Journal of Endocrinology. 2002;173:239–245. doi: 10.1677/joe.0.1730239. [DOI] [PubMed] [Google Scholar]
- 32.Torsello A., Scibona B., Leo G., Bresciani E., Avallone R., Bulgarelli I. Ontogeny and tissue-specific regulation of ghrelin mRNA expression suggest that ghrelin is primarily involved in the control of extraendocrine functions in the rat. Neuroendocrinology. 2003;77:91–99. doi: 10.1159/000068653. [DOI] [PubMed] [Google Scholar]
- 33.Wren A.M., Small C.J., Abbott C.R., Dhillo W.S., Seal L.J., Cohen M.A. Ghrelin causes hyperphagia and obesity in rats. Diabetes. 2001;50:2540–2547. doi: 10.2337/diabetes.50.11.2540. [DOI] [PubMed] [Google Scholar]
- 34.Cowley M.A., Smith R.G., Diano S., Tschop M., Pronchuk N., Grove K. The distribution and mechanism of action of ghrelin in the CNS demonstrates a novel hypothalamic circuit regulating energy homeostasis. Neuron. 2003;37:649–661. doi: 10.1016/s0896-6273(03)00063-1. [DOI] [PubMed] [Google Scholar]
- 35.Wang Q., Liu C., Uchida A., Chuang J.-C., Walker A., Liu T. Arcuate AgRP neurons mediate orexigenic and glucoregulatory actions of ghrelin. Molecular Metabolism. 2014;3:64–72. doi: 10.1016/j.molmet.2013.10.001. [DOI] [PMC free article] [PubMed] [Google Scholar]
- 36.Sagar S.M., Sharp F.R., Curran T. Expression of c-fos protein in brain: metabolic mapping at the cellular level. Science. 1988;240:1328–1331. doi: 10.1126/science.3131879. [DOI] [PubMed] [Google Scholar]
- 37.Chen H.Y., Trumbauer M.E., Chen A.S., Weingarth D.T., Adams J.R., Frazier E.G. Orexigenic action of peripheral ghrelin is mediated by neuropeptide Y and agouti-related protein. Endocrinology. 2004;145:2607–2612. doi: 10.1210/en.2003-1596. [DOI] [PubMed] [Google Scholar]
- 38.Steculorum S.M., Bouret S.G. Developmental effects of ghrelin. Peptides. 2011;32:2362–2366. doi: 10.1016/j.peptides.2011.06.021. [DOI] [PMC free article] [PubMed] [Google Scholar]
- 39.Zigman J.M., Ones J.E., Lee C.E., Saper C.B., Elmquist J.K. Expression of ghrelin receptor mRNA in the rat and the mouse brain. The Journal of Comparative Neurology. 2006;494:528–548. doi: 10.1002/cne.20823. [DOI] [PMC free article] [PubMed] [Google Scholar]
- 40.Mani B.K., Walker A.K., Lopez Soto E.J., Raingo J., Lee C.E., Perelló M. Neuroanatomical characterization of a growth hormone secretagogue receptor-green fluorescent protein reporter mouse. Journal of Comparative Neurology. 2014;522:3644–3666. doi: 10.1002/cne.23627. [DOI] [PMC free article] [PubMed] [Google Scholar]
- 41.Caro J.F., Kolaczynski J.W., Nyce M.R., Ohannesian J.P., Opentanova I., Goldman W.H. Decreased cerebrospinal-fluid/serum leptin ratio in obesity: a possible mechanism for leptin resistance. The Lancet. 1996;348:159–161. doi: 10.1016/s0140-6736(96)03173-x. [DOI] [PubMed] [Google Scholar]
- 42.Schwartz M.W., Peskind E., Raskind M., Boyko E.J., Porte D.J. Cerebrospinal fluid leptin levels: relationship to plasma levels and to adiposity in humans. Nature Medicine. 1996;2:589–593. doi: 10.1038/nm0596-589. [DOI] [PubMed] [Google Scholar]
- 43.Van Heek M., Compton D.S., France C.F., Tedesco R.P., Fawzi A.B., Graziano M.P. Diet-induced obese mice develop peripheral, but not central, resistance to leptin. The Journal of Clinical Investigation. 1997;99:385–390. doi: 10.1172/JCI119171. [DOI] [PMC free article] [PubMed] [Google Scholar]
- 44.De Seranno S., Estrella C., Loyens A., Cornea A., Ojeda S.R., Beauvillain J.-C. Vascular endothelial cells promote acute plasticity in ependymoglial cells of the neuroendocrine brain. The Journal of Neuroscience. 2004;24:10353–10363. doi: 10.1523/JNEUROSCI.3228-04.2004. [DOI] [PMC free article] [PubMed] [Google Scholar]
- 45.Cummings D.E., Clement K., Purnell J.Q., Vaisse C., Foster K.E., Frayo R.S. Elevated plasma ghrelin levels in Prader−Willi syndrome. Nature Medicine. 2002;8:643–644. doi: 10.1038/nm0702-643. [DOI] [PubMed] [Google Scholar]
- 46.Feigerlová E., Diene G., Conte-Auriol F., Molinas C., Gennero I., Salles J.P. Hyperghrelinemia precedes obesity in Prader-Willi syndrome. The Journal of Clinical Endocrinology and Metabolism. 2008;93:2800–28005. doi: 10.1210/jc.2007-2138. [DOI] [PubMed] [Google Scholar]
- 47.Chanoine J.-P., Wong A.C.K. Ghrelin gene expression is markedly higher in fetal pancreas compared with fetal stomach: effect of maternal fasting. Endocrinology. 2004;145:3813–3820. doi: 10.1210/en.2004-0053. [DOI] [PubMed] [Google Scholar]
- 48.Davidowa H., Ziska T., Plagemann A. Arcuate neurons of overweight rats differ in their responses to amylin from controls. Neuroreport. 2004;15:2801–2805. [PubMed] [Google Scholar]
- 49.Langlet F., Levin B.E., Luquet S., Mazzone M., Messina A., Dunn-Meynell A.A. Tanycytic VEGF-A boosts blood-hypothalamus barrier plasticity and access of metabolic signals to the arcuate nucleus in response to fasting. Cell Metabolism. 2013;17:607–617. doi: 10.1016/j.cmet.2013.03.004. [DOI] [PMC free article] [PubMed] [Google Scholar]
- 50.Dembinski A., Warzecha Z., Ceranowicz P., Bielanski W., Cieszkowski J., Dembinski M. Variable effect of ghrelin administration on pancreatic development in young rats. Role of insulin-like growth factor-1. Journal of Physiology and Pharmacology. 2005;56:555–570. [PubMed] [Google Scholar]
- 51.Briggs D.I., Lockie S.H., Wu Q., Lemus M.B., Stark R., Andrews Z.B. Calorie-restricted weight loss reverses high-fat diet-induced ghrelin resistance, which contributes to rebound weight gain in a ghrelin-dependent manner. Endocrinology. 2013;154:709–717. doi: 10.1210/en.2012-1421. [DOI] [PubMed] [Google Scholar]
- 52.Patterson C.M., Bouret S.G., Park S., Irani B.G., Dunn-Meynell A.A., Levin B.E. Large litter rearing enhances leptin sensitivity and protects selectively bred diet-induced obese rats from becoming obese. Endocrinology. 2010;151:4270–4279. doi: 10.1210/en.2010-0401. [DOI] [PMC free article] [PubMed] [Google Scholar]
- 53.Patterson C.M., Bouret S.G., Dunn-Meynell A.A., Levin B.E. Three weeks of postweaning exercise in DIO rats produces prolonged increases in central leptin sensitivity and signaling. American Journal of Physiology – Regulatory, Integrative and Comparative Physiology. 2009;296:R537–R548. doi: 10.1152/ajpregu.90859.2008. [DOI] [PMC free article] [PubMed] [Google Scholar]
Associated Data
This section collects any data citations, data availability statements, or supplementary materials included in this article.