

Abstract
Objectives
Certain nutrients positively regulate energy homeostasis via intestinal gluconeogenesis (IGN). The objective of this study was to evaluate the impact of a deficient IGN in glucose control independently of nutritional environment.
Methods
We used mice deficient in the intestine glucose-6 phosphatase catalytic unit, the key enzyme of IGN (I-G6pc−/− mice). We evaluated a number of parameters involved in energy homeostasis, including insulin sensitivity (hyperinsulinemic euglycaemic clamp), the pancreatic function (insulin secretion in vivo and in isolated islets) and the hypothalamic homeostatic function (leptin sensitivity).
Results
Intestinal-G6pc−/− mice exhibit slight fasting hyperglycaemia and hyperinsulinemia, glucose intolerance, insulin resistance and a deteriorated pancreatic function, despite normal diet with no change in body weight. These defects evoking type 2 diabetes (T2D) derive from the basal activation of the sympathetic nervous system (SNS). They are corrected by treatment with an inhibitor of α-2 adrenergic receptors. Deregulation in a key target of IGN, the homeostatic hypothalamic function (highlighted here through leptin resistance) is a mechanistic link. Hence the leptin resistance and metabolic disorders in I-G6pc−/− mice are corrected by rescuing IGN by portal glucose infusion. Finally, I-G6pc−/− mice develop the hyperglycaemia characteristic of T2D more rapidly under high fat/high sucrose diet.
Conclusions
Intestinal gluconeogenesis is a mandatory function for the healthy neural control of glucose homeostasis.
Keywords: Intestinal gluconeogenesis, Insulin sensitivity, Insulin secretion, Autonomous nervous system, Hypothalamus, Type 2 diabetes
1. Introduction
The recent worldwide increase in the prevalence of obesity and associated pathologies like type 2 diabetes (T2D) is a public health issue of major importance [36]. Faced with this epidemic, it becomes crucial to develop knowledge to ensure better prevention and treatment of obesity and T2D. T2D is a metabolic disorder characterized by chronic hyperglycemia in a context of insulin resistance (IR) and impaired insulin secretion [15,19]. Insulin resistance is linked to the inefficiency of insulin to stimulate glucose uptake by adipose tissue and skeletal muscles, and to suppress endogenous glucose production (EGP) from glucose-producing organs. On the other hand, T2D patients exhibit basal hyperinsulinemia, at least partially compensating IR, associated with anomalies in glucose-stimulated insulin secretion (GSIS) [9,15]. Lastly, a general hallmark of IR and T2D is linked to increased levels of plasma epinephrine [17,28]. These increased levels reflect the chronic activation of the sympathetic nervous system (SNS). This might play an important role in the onset of T2D, since an increased plasma epinephrine level may impair GSIS [2] and an augmentation of EGP, by stimulating both gluconeogenesis [1,5] and glycogenolysis [3].
In this context, intestinal gluconeogenesis (IGN) is a function shown to regulate energy homeostasis in fed post-absorptive states (for a review see [29]). The induction of IGN results in the release of glucose in the portal vein. Its detection by a portal glucose sensor, recently identified as the sodium glucose co-transporter 3, and the transmission of this signal to the brain by the peripheral neural system, initiate a neural gut–brain axis with benefits for energy homeostasis [37,40]. It has been suggested that this takes place in particular nutritional situations, such as when eating a protein-enriched diet [21,30,38], a fiber-enriched diet [41], and after gastric bypass surgery [27]. It is noteworthy that the increase in IGN is associated with a marked improvement in insulin sensitivity of EGP from the liver [27,30]. In particular, the role of IGN in glucose control under stimulation conditions has been proven by experiments in which the periportal neural afferents were inactivated, since improvements in insulin sensitivity are blunted after such inactivation [27,41]. However, these metabolic benefits might also be at least partially ascribed to the decreased body weight associated with these nutritional situations.
Here, to assess the specific role of IGN in glucose homeostasis, i.e. independently of its activation by the nutritional environment, we used mice with a tamoxifen-inducible and intestine-specific deletion of the catalytic subunit (G6pc) of glucose-6 phosphatase (G6Pase, the key enzyme of gluconeogenesis) (I-G6pc−/− mice) [34]. We first characterized glucose tolerance, insulin sensitivity and the pancreatic function in I-G6pc−/− mice, in the context of a normal chow diet. We then investigated the roles of the autonomic nervous system and the homeostatic hypothalamic function, a key target of IGN in normal animals, in the defects observed. Finally, we tested whether the absence of IGN could accelerate the development of T2D with a high fat/high sucrose diet (HF/HS).
2. Methods
2.1. Animals, diets and treatments
I-G6pc−/− mice were generated as described previously [34] and the experiments were performed 5 weeks after gene deletion. We used only male adult I-G6pc−/− and I-G6pc+/+ control (C57Bl/6J, Charles River Laboratories, France) mice for the present studies. All the mice were housed in the animal facility of Lyon 1 University (“Animalerie Lyon Est Conventionnelle” and “Specific Pathogen Free”) under controlled temperature (22 °C) conditions, with a 12-h light/dark cycle. All mice had free access to water. The standard diet was from SAFE (Augy, France) and the High-Fat/High Sucrose diet (consisting of 36.1% fat, 35% carbohydrates (50% maltodextrine + 50% sucrose), 19.8% proteins) was produced at the “Unité de Préparation des Aliments Expérimentaux” (UE0300 INRA, Jouy-en-Josas, France). All the procedures were performed in accordance with the principles and guidelines established by the European Convention for the protection of Laboratory Animals. The regional animal care committee (CREEA, CNRS, Rhône-Alpes Auvergne, France) approved all the experiments. For yohimbine treatment, mice were subcutaneously injected with yohimbine (2 mg/kg body weight, TOCRIS Bioscience) or vehicule (saline) once a day for 15 days. A fresh sterile solution of yohimbine was prepared every day.
2.2. Glucose and insulin tolerance tests
Glucose tolerance test (GTT) and insulin tolerance test (ITT) were performed in 16 h- or 6 h-fasted mice. Animals received an intraperitoneal injection of glucose (1 g/kg b.w.) or insulin (0.5 U/kg b.w., Insulatard, Novo Nordisk). Blood glucose was monitored for 120 min using a glucometer (Accu-Check, Roche) on blood samples collected from the tail vein. Insulin and glucagon were quantified using Mouse Insulin or Glucagon Elisa kits (Mercodia).
2.3. Insulin release
Animals were fasted for 16 h and then received an intraperitoneal injection of glucose (3 g/kg b.w., ip). Blood was withdrawn from the tail vein at 0, 3, 6 and 12 min after injection for insulin assessment.
2.4. Leptin tolerance tests
Animals were fasted for 16 h and then received an intraperitoneal injection of leptin (1 mg/kg b.w., Enzo Life Science®) or vehicle (Nacl). In the first procedure, animals were refed and food intake was measured at 1 and 3 h after refeeding. In the second procedure, mice were euthanized 30 min after injection by cervical dislocation before hypothalamus sampling.
2.5. Hyperinsulinemic euglycaemic clamp
Clamp was performed in conscious, unrestrained, catheterized mice. A catheter was inserted into the right jugular vein under anesthesia (2% isoflurane), and mice were allowed to recover for 7 days. After 6 h of fasting, blood was withdrawn from the tail vein to measure glycemia (with an Accu-Check glucometer, Roche). A bolus of [3-3H] glucose (2.5 μCi, specific activity 0.74 TBq/mmol, Perkin Elmer, Boston, USA) and insulin (1.25 mU) was administered via the catheter to the mice. We then infused [3-3H] glucose (0.17 μCi) and insulin (3 mU/kg/min) at a rate of 1 μL/min in the jugular vein. In the same way, euglycemia was maintained through a variable infusion of 15% (weight/volume) glucose. Glycemia was monitored every 20 min until the end of the clamp. After 120 min infusion, 20 μL of blood sampled from the tail vein was collected to determine [3-3H] glucose specific activity, as described previously [23,27]. We checked that a steady state in plasma glucose and [3-3H] glucose specific activity was established at this time, as previously reported [27]. Mice were euthanized by cervical dislocation before liver sampling for glycogen determination. GIR, EGP and Rd were determined using radioactivity and glycemia values, as described previously [27].
2.6. Portal glucose infusion
A catheter was inserted into the portal vein under isoflurane anesthesia (2%), and mice were allowed to recover for 7 days. A 0.9% saline or 20% glucose (Laboratoire Aguettant) was infused at 40 μmol/kg/min for 6 h. In the GTT experiments, mice received infusion in the portal vein during the last 7 h of fasting and GTT was performed at the end of the infusion as described above. In the clamp procedure, the portal infusion was performed during the prior fasting period and maintained during the clamp. In the insulin secretion experiments, pancreatic islets were isolated after 7 h of glucose infusion and insulin secretion was measured as described in the section “insulin secretion” [35]. In the study relating to leptin sensitivity, portal glucose infusion was carried out for 24 h. At the end of the infusion, mice received an intraperitoneal injection of leptin or vehicle and the leptin tolerance tests were performed as described above.
2.7. Western blot analysis
Tissues were rapidly sampled in liquid nitrogen and stored at −80 °C before analysis. Whole cell extracts from tissues were lysed in standard lysis buffer at 4 °C. Aliquots of 30 μg proteins were separated by 9%-SDS polyacrylamide gel electrophoresis and transferred to PVDF Immobilon membranes (Millipore). The membranes were probed with antibodies diluted in TBS/0.2% Tween/5% BSA against TH, pAkt Ser473, Akt, pSTAT3 and STAT3 (dilution 1:2000, Cell Signaling) and then with goat secondary anti-rabbit IgG linked to peroxidase (dilution 1:10 000, Biorad). The intensity of the spots was determined by densitometry with the VersaDoc™ system (Biorad) and analyzed using the Quantity One® software (Biorad).
2.8. Insulin secretion
Islets were obtained from mice, isolated through collagenase perfusion and Histopaque gradient (Sigma) and cultured, as described previously [10,35]. Eight islets were pre-incubated in HEPES-buffered Krebs–Ringer bicarbonate medium without glucose for 30 min and then replaced for 1 h in the same medium supplemented with 5.5 or 16.7 mM glucose at 37 °C with 5% CO2. At the end of the experiment, the supernatant was recovered to measure the insulin released, and islets were extracted with acid-ethanol solution to measure insulin content.
2.9. Immunohistochemistry
For the morphometric analysis, tissue samples were fixed in 10% buffered formalin and embedded in paraffin. Four μm-thick tissue sections were prepared according to conventional procedures. Immunohistochemistry was performed on an automated immunostainer (Ventana Discovery XT, Roche) using DABmap Kit according to the manufacturer's instructions. Sections were incubated with insulin antibody (diluted 1:10 000, Dako). Staining was visualized with DAB solution with 3,3′-diaminobenzidine as a chromogenic substrate. Finally, the sections were counterstained with Gill's hematoxylin. Image analysis was performed using a light microscope (Eclipse E400, Nikon France) equipped with a tri-CDD video camera (Sony, Japan). The total surface of the pancreas and the β-cell area were determined by morphometric analysis (Histolab, Microvision Instruments).
For TH labeling, the pancreas was fixed in 10% buffered formalin, cryoprotected in sucrose, and cut on a cryostat (40 μm). After rinsing with PBS Triton X-100 (0.3%), sections were incubated in blocking solution (PBS-Triton X-100, 5% BSA). Thereafter, the sections were incubated for 48 h (4 °C) with TH antibody (Millipore) diluted to 1:250 in blocking solution.
Immunostaining was visualized by using Alexa Fluor conjugated secondary antibodies (1:500 in blocking solution; 1 h at room temperature; Invitrogen). Cell nuclei were stained with DAPI. Slides were mounted with ProLong Anti Fade (Invitrogen).
Confocal images of randomly selected islets (5–7 islets per pancreas) were acquired on a confocal laser scanning microscope (Leica SP5) with a 40× objective at 1024 × 1024 pixel resolution. Nerve fiber immunostaining was analyzed and quantified in Z-stacks (step size = 1 μm) of confocal images using imageJ software. Denis Ressnikoff developed a macro in ImageJ that automatically detected all the TH-immunostained elements within the islet volume. The volume of immunostained elements was then expressed as a percentage of the islet volume examined. Using this macro, we calculated the area of TH-immunostained fibers and the medium intensity of TH labeling.
2.10. Epinephrine and leptin blood concentration and determination of acetylcholine esterase activity
Blood samples were collected from the retro-orbital sinus in anesthetized (2% isofluorane) fed mice and epinephrine and leptin plasma concentration was quantified using Elisa kits (Eurobio and Euromedex, respectively). The livers were collected as described above and acetylcholine esterase activity was determined using an Amplex red acetylcholine/acetylcholine esterase assay kit (Life Technologies).
2.11. Statistical analyses
All data are presented as mean ± SEM. Two-group comparisons were analyzed using paired or unpaired t test. Groups were compared using one-way ANOVA followed by Tukey's.
3. Results
3.1. I-G6pc−/− mice exhibit disturbed glucose control despite normal food intake
Since the induction of IGN, when feeding a protein- or fiber-enriched diet or after gastric bypass surgery, results in a decrease in food intake and/or body weight, we evaluated the effect of the absence of IGN on these parameters. I-G6pc−/− mice exhibited no difference in body mass (Figure S1A) or in food intake (Figure S1B), compared to control mice. By age 13–15 weeks (5–7 weeks after knockout), despite the absence of a gluconeogenic organ, the fasting glucose concentration was slightly higher in I-G6pc−/− mice than in WT mice. This was true in the fed to the “48 h fasting states” (Figure 1A) and was dependent neither on a putative decrease in plasma insulin concentration nor on a putative increase in plasma glucagon, since plasma insulin was significantly higher and plasma glucagon significantly lower in I-G6pc−/− mice than in WT mice (Figure 1B). After overnight fasting, I-G6pc−/− mice exhibited impaired glucose tolerance (Figure 1C). Accordingly, insulin tolerance was markedly affected in I-G6pc−/− mice (Figure 1D). The mechanisms underlying the alteration in insulin sensitivity were evaluated using a euglycemic hyperinsulinemic clamp. The glucose infusion rate (GIR) required to maintain euglycemia during the clamps was 24% lower in I-G6pc−/− mice compared with WT mice, demonstrating whole body insulin resistance in I-G6pc−/− mice (Figure 1E). There was no difference in the rate of insulin-stimulated glucose utilization (Rd) in I-G6pc−/− mice versus control mice (Figure 1E). On the other hand, EGP during clamping was 4-fold higher in I-G6pc−/− mice than in control mice (Figure 1E), reflecting the impairment in the action of insulin to lower EGP in I-G6pc−/− mice. To investigate the molecular mechanisms underlying insulin resistance of EGP in I-G6pc−/− mice in more depth, we assessed the hepatic glycogen content at the end of the insulin clamp. Glycogen stores were still substantial in control mice (13.3 ± 0.7 mg/mg of protein), whereas they were virtually exhausted in the liver of I-G6pc−/− mice (0.7 ± 0.1 mg/mg of protein) (Figure 1F). This result suggests that a defect in glycogen synthesis and/or an unrestrained glycogenolysis took place in the liver of I-G6pc−/− mice. Both processes might contribute to the insulin resistance of EGP in these mice. Also, in accordance with the impairment in hepatic insulin sensitivity, we observed a decrease in the basal phosphorylation of Akt (a key intermediate in the insulin signaling cascade) in the liver of I-G6pc−/− mice compared to WT mice (Figure 1G), despite higher levels of insulin in the fed post-absorptive state (Figure 1B). Taken together, these data strongly suggest that the liver is the primary site of the insulin resistance of EGP in I-G6pc−/− mice.
Figure 1.
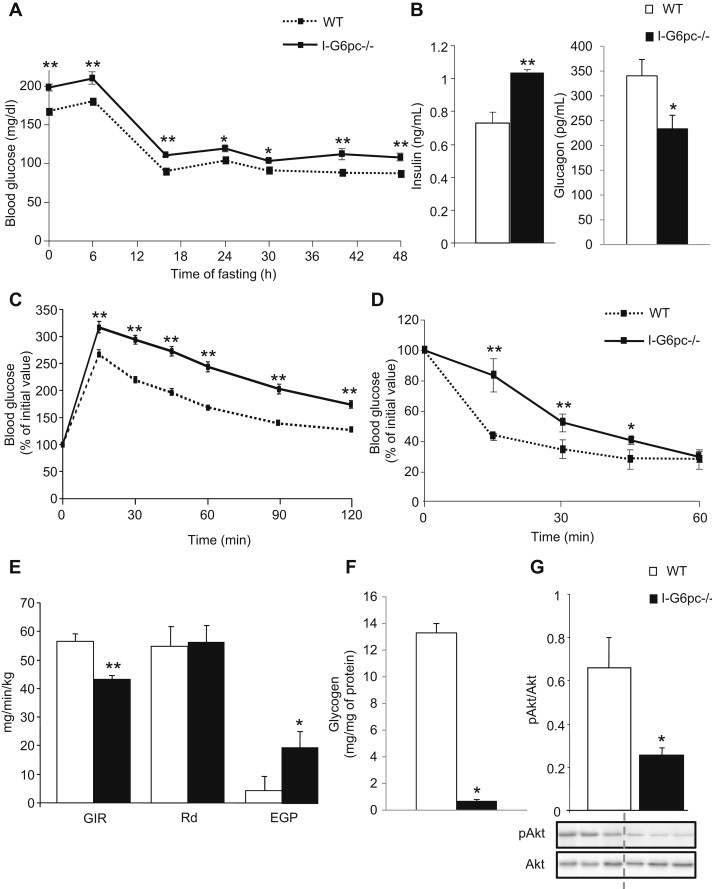
Alteration of glucose control in I-G6pc−/− mice. (A) Plasma glucose concentration monitored throughout fasting in I-G6pc−/− and WT mice (means ± SEM, n = 6). (B) Plasma insulin and glucagon levels at 6 h fasting. (C) Glucose tolerance test in I-G6pc−/− and WT mice. The data are expressed as % of initial plasma glucose (means ± SEM, n = 8). (D) Insulin tolerance test in I-G6pc−/− and WT mice. Expression of data as in panel c (means ± SEM, n = 10). (E) Insulin sensitivity assessed by hyperinsulinemic-euglycemic clamp (means ± SEM, n = 5). (F) Hepatic glycogen stores measured at the end of the clamp. (G) Phosphorylation state of Akt studied in the fed state (means ± SEM, n = 5). *p < 0.05; **p < 0.01 vs WT mice.
3.2. Insulin secretion is altered in I-G6pc−/− mice
First, we compared insulin release in response to a glucose injection in WT and I-G6pc−/− mice in vivo. In control mice, a 70% increase in plasma insulin was observed 3 min after IP glucose injection, and after this first peak the insulin level increased again for up to 12 min, indicating a second-phase insulin response (Figure 2A). In I-G6pc−/− mice, the acute first-phase insulin secretory response to glucose was blunted. However, the insulin level progressively rose during the glucose challenge, suggesting the persistence of a second-phase of insulin secretion in I-G6pc−/− mice (Figure 2A). Second, we measured insulin secretion in response to glucose stimulation in islets isolated from I-G6pc−/− and control mice. Pancreatic islets from I-G6pc−/− mice showed a basal increase in insulin secretion under non-stimulated conditions (5.5 mM glucose) (0.33 ± 0.02 vs 0.14 ± 0.03% of insulin content) (Figure 2B). Besides this defect in insulin secretion in the basal state, pancreatic islets isolated from I-G6pc−/− mice exhibited an alteration in GSIS. While insulin secretion from control islets had increased 3 fold at 16.7 mM glucose compared to 5.5 mM glucose, the I-G6pc−/− islets showed no increase in insulin secretion in response to high glucose (Figure 2B). Hence I-G6pc−/− mice displayed defects in insulin secretion in both the basal and stimulated states. These defects took place without change in β cell mass and islet size distribution in I-G6pc−/− mice compared to control mice (Figure 2C, D).
Figure 2.
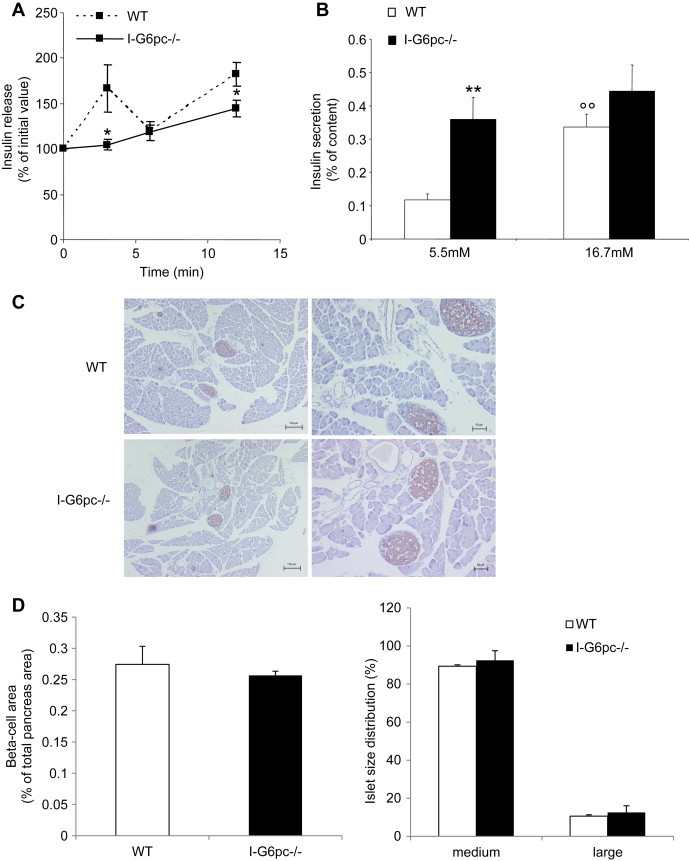
Alteration of insulin secretion in I-G6pc−/− mice. (A) Glucose (3 g/kg) was injected intraperitonally and blood glucose was collected at the time intervals indicated (0, 3, 6, 12 min) for insulin determination. The data are expressed as % of initial plasma insulin (means ± SEM, n = 4; *p < 0.05 vs WT mice). (B) Insulin secretion measured at 5.5 mM and 16.7 mM glucose from islets isolated from I-G6pc−/− and WT mice. The data are expressed as % of insulin content (means ± SEM, n = 6; **p < 0.01 vs WT mice; °°p < 0.01 vs 5.5 mM). (C) Immunostaining of pancreas sections with insulin antibody. (D) The ß-cell area was determined from the total area of insulin-positive cells (μm2) in the pancreatic sections divided by the total pancreas area (μm2). The data are expressed as % of total pancreas area. (E) Size of islets isolated from I-G6pc−/− mice compared to WT mice. The data are expressed as % of islet total number (n = 3).
3.3. Rescuing IGN improves glucose tolerance and hepatic insulin sensitivity and restores GSIS in I-G6pc−/− mice
To ascertain whether the alteration of glucose control in I-G6pc−/− mice was caused by the absence of intestinal glucose production, we rescued IGN by infusing glucose at a rate mimicking IGN [27] directly into the portal vein and evaluated glucose tolerance, hepatic insulin sensitivity and insulin secretion. The area under the curve of the plasma glucose profile was smaller during the glucose tolerance test (GTT) with the concomitant infusion of portal glucose compared to portal saline, despite the fact that the mice had received more glucose (Figure 3A, B). Thus the infusion of glucose in the portal vein improved glucose tolerance in I-G6pc−/− mice. Whole body insulin sensitivity was further evaluated using a euglycaemic hyperinsulinaemic clamp. The GIR required to euglycemia was 34% higher in I-G6pc−/− mice infused with portal glucose than in I-G6pc−/− mice receiving portal saline (Figure 3C). There was no change in the glucose disappearance rate induced by portal glucose. In contrast, EGP during the clamp was significantly lower in I-G6pc−/− mice after portal glucose infusion (Figure 3C). These results strongly suggest that EGP was the function involved in the improvement of insulin sensitivity by portal glucose.
Figure 3.
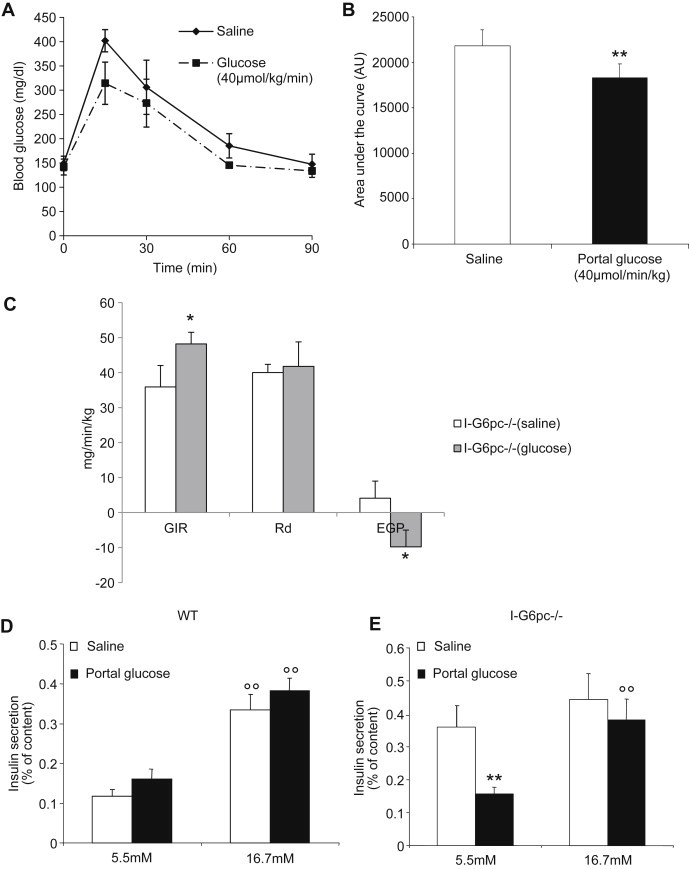
Improvement of glucose control by portal glucose infusion in I-G6pc−/− mice. (A) Glucose tolerance test during saline and portal glucose infusion in I-G6pc−/− mice (means ± SEM, n = 4). (B) Area under the curve of glucose profiles shown in panel A. (C) Insulin sensitivity assessed by hyperinsulinemic-euglycemic clamp during glucose and saline infusion in the portal vein (means ± SEM, n = 4). *p < 0.05; **p < 0.01 vs saline condition. (D, E) Insulin secretion was measured after portal saline or glucose infusion in control (D) and I-G6pc−/− mice (E). In I-G6pc−/− mice, portal glucose infusion decreased insulin secretion at basal glucose concentration and restored insulin secretion in response to glucose stimulation (means ± SEM, n = 4). The data are expressed as % of insulin content. °°p < 0.01 vs 5.5 mM glucose condition; **p < 0.01 vs saline condition.
The impact of portal glucose on insulin secretion was also evaluated in isolated islets. In WT mice, the infusion of portal glucose did not affect insulin secretion in basal state (5.5 mM glucose) or under stimulated conditions (16.7 mM glucose) (Figure 3D). On the contrary, in islets from I-G6pc−/− mice, the infusion of portal glucose restored insulin secretion in the basal state and GSIS (Figure 3E). Taken together, these results strongly suggest a causal role of the absence of IGN in the defects in glucose metabolism observed in I-G6pc−/− mice.
3.4. The sympathetic/parasympathetic balance is deregulated in I-G6pc−/− mice
Increased plasma epinephrine reflecting the activation of the sympathetic system is a hallmark of T2D in humans [17,28]. Moreover, epinephrine infusion has long been known to induce hyperglycemia in humans and animals [6] and to cause defects in GSIS [2]. Thus we hypothesized that an increased epinephrine level could be implicated in the systemic deregulation of glucose control in I-G6pc−/− mice. Accordingly, I-G6pc−/− mice showed an increased plasma epinephrine concentration at age 13–15 weeks compared to WT mice (Figure 4A).
Figure 4.
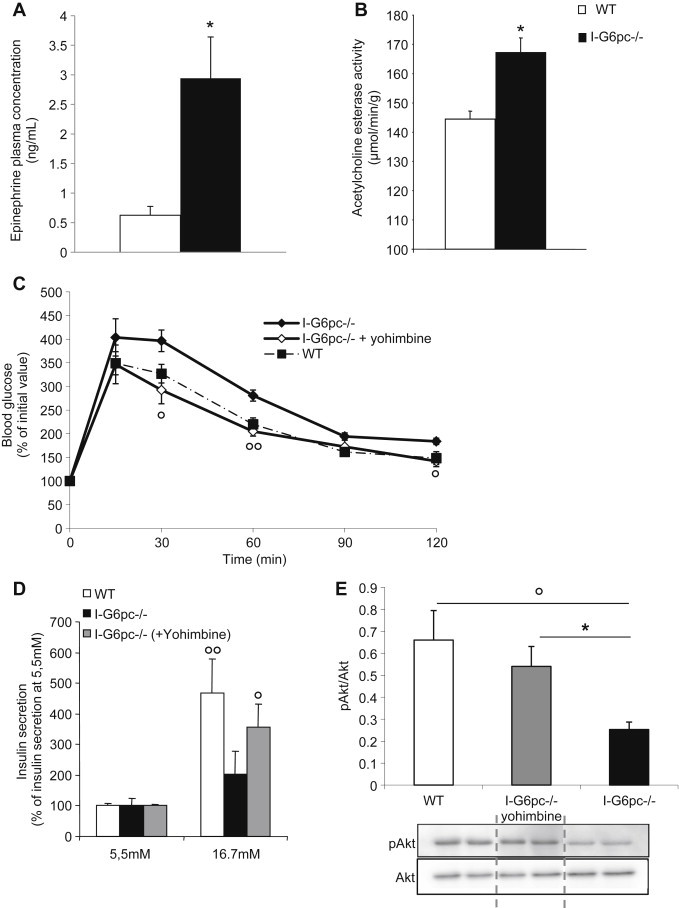
Increased plasma epinephrine and restoration of glucose control in I-G6pc−/− mice by inhibition of α-2 adrenergic receptors. (A) Plasma epinephrine concentration at 6 h fasting (means ± SEM, n = 6; *p < 0.05 vs WT mice). (B) Acetylcholine esterase activity in the liver of WT and I-G6pc−/− mice (means ± SEM, n = 6; *p < 0.05 vs WT mice). (C) Glucose tolerance test. Values are represented as % of initial values (means ± SEM, n = 6; *p < 0.05; **p < 0.01 vs WT mice; °p<0.05; °°p<0.01 vs I-G6pc−/− mice). (D) Insulin secretion measured at 5.5 mM and 16.7 mM glucose from islets isolated from I-G6pc−/− and WT mice. Values are expressed as % of 5.5 mM values (means ± SEM, n = 6; °p<0.05; °°p<0.01 vs 5.5 mM glucose. (E) Phosphorylation state of Akt studied in the fed state (means ± SEM, n = 6; °p < 0.05 vs WT mice; *p<0.05 vs I-G6pc−/− mice).
Since the liver was an important site of the metabolic impairments observed in I-G6pc−/− mice (Figures 1 and 3), we evaluated whether a local tissue determinant of the sympathetic/parasympathetic balance, i.e. hepatic acetylcholine esterase (responsible for the degradation of acetylcholine, the principal neurotransmitter of the parasympathetic nervous system, opposing the sympathetic tone) could be associated with systemic activation (increased epinephrine). Accordingly, the activity of hepatic acetylcholine esterase was increased in I-G6pc−/− mice compared to WT mice (Figure 4B). This suggests a local deregulation of the sympathetic/parasympathetic balance in the liver of I-G6pc−/− mice.
Since the systemic activation of the sympathetic nervous system (SNS) impairs GSIS [17,28], we raised the same question regarding local sympathetic innervation in the islets of I-G6pc−/− mice. We immuno-stained pancreatic sections with a commonly used sympathetic marker: tyrosine hydroxylase (TH). We showed that the density of TH fibers was comparable in the islets of control and I-G6pc−/− mice (Figure S3A). However, the protein expression of TH, studied and quantified from western-blots, was increased in the islets of I-G6pc−/− mice compared to control mice (Figure S3B).
Taken together, these results strongly suggest a deregulation of the systemic and local sympathetic/parasympathetic balance in favor of the sympathetic tone in I-G6pc−/− mice.
3.5. The inhibition of α-2 adrenergic receptors corrects GSIS defects and improves glucose control in I-G6pc−/− mice
Epinephrine per se induces hyperglycemia by impairing GSIS via the activation of α-2 adrenergic receptors [2]. Thus the increased concentration in epinephrine could be causal in the alteration of β-cell function and of glucose tolerance in I-G6pc−/− mice. To prove it, we treated I-G6pc−/− mice daily with a specific inhibitor of α-2 adrenergic receptors (yohimbine), and we evaluated insulin secretion from isolated islets and glucose tolerance. After 15 days treatment, a GTT was performed in mice following an overnight fast. Yohimbine-treated I-G6pc−/− mice exhibited glucose tolerance comparable to that in WT mice (Figure 4C). Moreover, there was a marked improvement in GSIS in the islets isolated from yohimbine-treated I-G6pc−/− mice (Figure 4D). Interestingly, the 15-day yohimbine treatment also had a beneficial impact on hepatic insulin signaling, as revealed by the restoration of normal Akt phosphorylation in the liver of I-G6pc−/− mice (Figure 4E). These results strongly suggest that the chronic activation of the SNS, while quantitatively limited, was sufficient to cause the disturbance in the pancreatic function via α2-adrenergic receptors in I-G6pc−/− mice and its repercussion on whole body glucose control.
3.6. I-G6pc−/− mice exhibit hypothalamic leptin resistance that is corrected by rescuing IGN
The autonomic nervous system is controlled centrally, with the hypothalamus playing a key regulatory role [22]. In addition, several hypothalamic nuclei are key targets of IGN [31]. We hypothesized that a deregulation of the homeostatic hypothalamic function could be a link in the impairments of glucose control deriving from the absence of IGN. As readout we assessed leptin sensitivity, a key process in the control of energy homeostasis at the hypothalamic level. First, the inhibition of food intake by leptin was studied from a fast-refed paradigm in I-G6pc−/− and WT mice. While food intake in WT mice was decreased by 55% by leptin, I-G6pc−/− mice showed only a 19% decrease after 3 h refeeding (Figure 5A). Hence I-G6pc−/− mice were resistant to the anorexigenic effect of exogenous leptin. Because hyperleptinemia plays a key role in leptin resistance [32], we measured the plasma concentration of leptin in I-G6pc−/− and WT mice. I-G6pc−/− mice exhibited no difference in plasma leptin compared to WT mice (Figure 5B).
Figure 5.
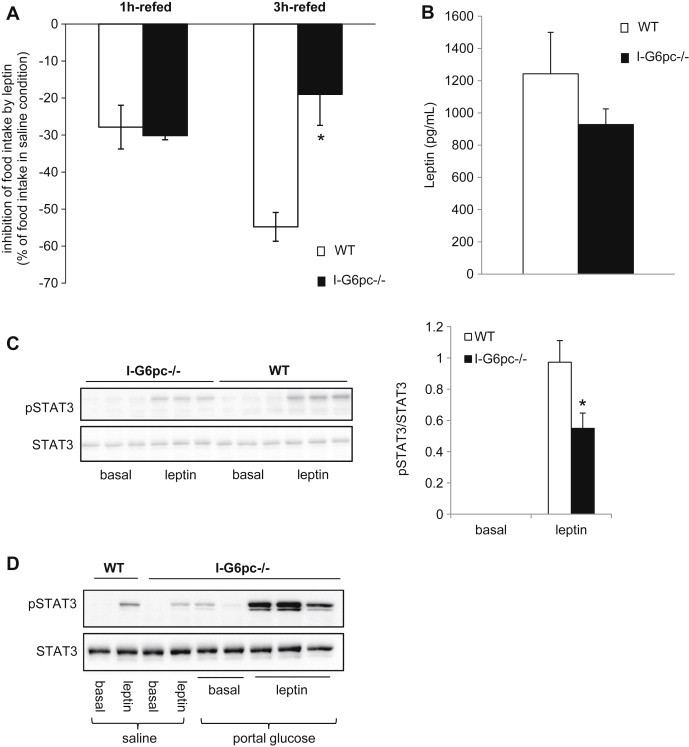
Alteration of hypothalamic leptin sensitivity in the absence of IGN (A) Leptin tolerance studied at 16 h fasting from a fast-refed paradigm in I-G6pc−/− and WT mice (means ± SEM, n = 10, *p < 0.05). The data are expressed as % of food intake in saline condition. (B) Plasma leptin level in the fed state (means ± SEM, n = 7–8). (C) Phosphorylation state of STAT3 in the hypothalamus measured after IP injection of leptin. The graph shows the quantification of phosphorylation state of STAT3 (means ± SEM, n = 5, *p < 0.05). (D) Activation of STAT3 phosphorylation in the hypothalamus by IP injection of leptin after saline or glucose infusion in the portal vein.
Next, we characterized leptin signaling in the hypothalamus. We studied the leptin-dependent phosphorylation of STAT3, a key intermediate in the leptin signaling cascade. In agreement with leptin resistance taking place at the hypothalamic level, we observed that the phosphorylation of STAT3 in response to the injection of leptin fell by half in the hypothalamus of I-G6pc−/− mice, compared to control mice (Figure 5C).
To prove that the phenotype of the leptin resistance observed in I-G6pc−/− mice was caused by the absence of IGN, we rescued IGN by portal glucose infusion and evaluated the correction of the hypothalamic leptin signal by measuring STAT3 phosphorylation. In accordance with our hypothesis, we observed that the phosphorylation of STAT3 was restored in I-G6pc−/− mice infused with glucose compared with their counterparts infused with saline (Figure 5D). This result demonstrates that the absence of portal glucose delivered by IGN is sufficient to induce a defect in the hypothalamic function.
3.7. I-G6pc−/− mice are more prone to the development of type 2 diabetes induced by HF-HS diet
To know whether these metabolic defects conferred a predisposition in I-G6pc−/− mice to develop diabetes, they were fed an HF-HS diet. There was no difference in body weight and food intake between I-G6pc−/− and control mice during 5 weeks under HF/HS diet (Figure S4). I-G6pc−/− mice exhibited fasting hyperglycemia much more rapidly than WT mice on the HF-HS diet (Figure 6A). Moreover, I-G6pc−/− mice exhibited higher basal plasma insulin levels than control mice from 1 month after the switch on the HF-HS diet (Figure 6B). Two months were sufficient to generate a frank hyperglycemia (around 150 mg/dL) in I-G6pc−/− mice. Instead, fasting plasma glucose was not increased at this time in WT mice. Moreover, a fasting hyperglycemia comparable to that of I-G6pc−/− mice (around 150 mg/dL) was reached only after 6 months on HF-HS diet in WT mice (Figure 6A). After 8 weeks of HF-HS diet, I-G6pc−/− mice showed significantly higher plasma glucose levels than the control mice upon glucose challenge during GTT (Figure 6C). Moreover, I-G6pc−/− mice exhibited a stronger impairment in insulin tolerance after 9 weeks of HF-HS diet compared to WT mice (Figure 6D). Altogether, these results indicate that the absence of IGN makes I-G6pc−/− mice more susceptible to develop T2D under a deleterious diet.
Figure 6.
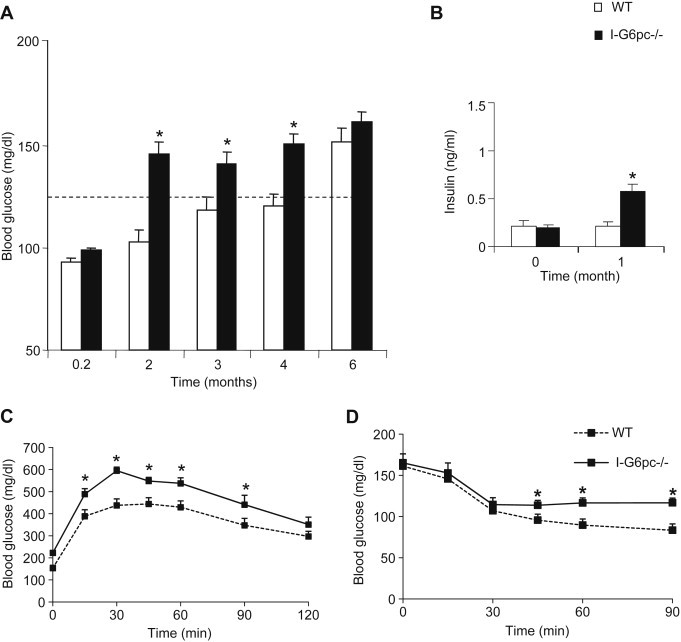
Proneness of I-G6pc−/− mice to the development of T2D induced by a HF-HS diet. (A) Fasting blood glucose concentration monitored through time in I-G6pc−/− and WT mice. The body weight was 51.9 ± 1.6 g and 52.5 ± 1.3 g in WT and I-G6pc−/− mice, respectively, after 6 months on the HF-HS diet. (B) Plasma insulin levels at 6 h fasting. (C) Glucose tolerance in I-G6pc−/− and WT mice. (D) Insulin tolerance in I-G6pc−/− and WT mice (means ± SEM, n = 10; *p < 0.05 vs WT mice).
4. Discussion
When IGN is induced under specific nutritional conditions, it interferes in energy homeostasis mostly by modulating hunger sensation and food intake and/or increasing energy expenditure, resulting in decreased body weight [21,27,41]. This is associated with a gain in insulin sensitivity [27,30,41] that might be linked at least in part to the concomitant decrease in body weight. Here we studied mice with an inducible deletion in intestinal G6PC. It is important to emphasize that the intestinal deletion in these mice is complete and highly specific, since no deletion takes place in the liver or kidney [34]. Moreover, no compensatory mechanism takes place in the intestine, since mice deficient in both hepatic and intestinal G6PC exhibit an impaired control in plasma glucose during fasting compared to mice deficient in hepatic G6PC only [42]. It is noteworthy here that the complete suppression of IGN does not significantly alter basal food intake in mice fed a standard starch-based diet. However, the suppression of IGN promotes several metabolic perturbations in glucose control, albeit in the absence of food intake and body weight changes. We previously estimated that basal IGN in the post-absorptive state (standard diet) may represent 5–7% of total EGP [24], whereas IGN induced, for example, by a protein-enriched diet, might represent up to 20–25% of total EGP. This suggests a difference in the range of sensitivity of the whole body to IGN in relation to the control of food intake and energy expenditure (induction of IGN to about 20% of EGP is needed to modulate these parameters, something not done by basal IGN) and in relation to glucose homeostasis (basal IGN is already mandatory for correct glucose control). The case for IGN playing a crucial role in glucose control is demonstrated forcefully by the portal glucose rescue experiments reported in Figures 3 and 5.
Two major perturbations in glucose control seen in I-G6pc−/− mice relate to the insulin sensitivity of EGP in the liver and the first peak of GSIS in vivo. It has long been known that hepatic glucose production is efficiently controlled by the sympathetic/parasympathetic balance via the regulation of glycogenolysis and glycogen synthesis, with the sympathetic tone activating hepatic glucose production [8,20]. Furthermore, the first peak of GSIS in vivo is also dependent on the autonomic nervous system [13,26]. It is noteworthy that the defects in GSIS are still present in isolated islets. This suggests that chronic epinephrine exposure of islets may induce lasting modifications of the insulin secretory response, putatively via alterations of gene expression. A key result here is that we could ascribe the defects observed in I-G6pc−/− mice to a deregulation of the sympathetic/parasympathetic balance translating into increased plasma epinephrine and TH protein expression in pancreatic islets, since yohimbine restores both GSIS and glucose tolerance. Hypothalamic nuclei are major targets of portal glucose signaling including that generated by IGN [4,7,21,31,40]. Most of these nuclei are further connected to the locus coeruleus controlling the autonomic nervous system and are considered as pre-ganglionic structures [11,22]. Therefore it is likely that the absence of a key informative signal to the hypothalamus may translate in a deregulation of the hypothalamic homeostatic function and next in a disturbance of the sympathetic/parasympathetic balance, such as occurs in I-G6pc−/− mice. An obvious illustration of this hypothalamic dysfunction in I-G6pc−/− mice is linked to leptin resistance, evidenced here by a fasted-refed paradigm and at a hypothalamic molecular level. Interestingly, rescuing IGN by an infusion of glucose into the portal vein restores hypothalamic leptin signaling in I-G6pc−/− mice, indicating that the hypothalamic function is corrected. Usually, leptin resistance is considered to derive from continuous exposure to elevated concentrations of the hormone in obese people [12]. This is not the case here since there is no increase in plasma leptin in I-G6pc−/− mice (see Figure 5B). However, it may appear surprising that hypothalamic leptin resistance does not promote increased food intake and body weight. As far as leptin resistance might contribute to the phenotype of I-G6pc−/− mice (a question not addressed herein), it could be proposed that low leptin concentrations and/or initial stages of leptin resistance might interest glucose control only and not food intake, according to the above rationale relating to basal IGN. To our knowledge, this is the first observation of leptin resistance independently of increased body weight or increased leptinemia. Thus our data strongly suggest that the IGN signal is mandatory for the homeostatic hypothalamic function. Furthermore, its deficiency generates proneness to metabolic diseases.
5. Conclusions
Intestinal gluconeogenesis is a function located upstream of and able to signal to the hypothalamus. Thus, IGN is capable of modulating numerous functions in the whole body metabolism placed under the control of hypothalamus. We previously reported that IGN might be impaired in situations of IR induced by high-fat feeding in rats [25]. Here, we report that a deficient IGN per se is sufficient to initiate the metabolic impairment characteristics of a pre-diabetic state in mice. Moreover, the deficient IGN predisposes an accelerated occurrence of fasting hyperglycemia in the context of a deleterious nutritional environment, such as an HF-HS diet. Intestinal gluconeogenesis genes are expressed in the human intestine [14,16] and intestinal glucose production takes place in humans and might be increased after gastric bypass surgery for obesity [18,33,39]. Therefore, IGN may apply to human physiology and pathophysiology; understanding this important regulatory system may suggest future approaches for treatment of metabolic disorders.
Acknowledgments
We would like to thank the members of the Anipath Platform (Université Lyon 1 Laennec) for the immunohistochemistry experiments, Annabelle Bourchardon (CIQLE – Centre d'Imagerie Quantitative Lyon-Est, Lyon) for confocal image acquisition and Denis Ressnikoff (Centre Commun de Quantimétrie, Faculté Rockefeller, Lyon) for developing the ImageJ macro for of fluorescence image quantification. We thank the institute ADIR-Servier for funding in part this study.
Conflict of interest
None declared.
Appendix A. Supplementary data
The following are the supplementary data related to this article:
I-G6pc−/− mice did not present any difference in body mass or food intake compared to WT mice on standard diet. (A) Body weight and (B) food intake monitored 5 weeks following tamoxifen treatment in I-G6pc−/− and WT mice (means ± SEM, n = 4–6).
Monitoring of (A) blood glucose and (B) GIR during the hyperinsulinemic-euglycemic clamp in I-G6pc−/− and WT mice. (means ± SEM, n = 5; **, p < 0.01 vs WT).
Study of sympathetic innervation and activity in pancreas of WT and I-G6pc−/− mice. (A) The pancreatic islets of I-G6pc−/− mice did not present any difference in TH fiber area compared to WT mice. (B) The protein expression of TH was increased in the pancreatic islets of I-G6pc−/− mice (means ± SEM, n = 4; *, p < 0.05 vs WT).
I-G6pc−/− mice did not present any difference in body mass or food intake compared to WT mice on HF/HS diet. (A) Body weight and (B) food intake monitored during 5 weeks on HF/HS diet in I-G6pc−/− and WT mice (means ± SEM, n = 4–6).
References
- 1.Exton J.H., Park C.R. The stimulation of gluconeogenesis from lactate by epinephrine, glucagon, cyclic 3′,5′-adenylate in the perfused rat liver. Pharmacological Reviews. 1966;18(1):181–188. [PubMed] [Google Scholar]
- 2.Altszuler N., Steele R., Rathgeb I., De Bodo R.C. Glucose metabolism and plasma insulin level during epinephrine infusion in the dog. American Journal of Physiology. 1967;212(3):677–682. doi: 10.1152/ajplegacy.1967.212.3.677. [DOI] [PubMed] [Google Scholar]
- 3.Sherline P., Lynch A., Glinsmann W.H. Cyclic AMP and adrenergic receptor control of rat liver glycogen metabolism. Endocrinology. 1972;91(3):680–690. doi: 10.1210/endo-91-3-680. [DOI] [PubMed] [Google Scholar]
- 4.Schmitt M. Influences of hepatic portal receptors on hypothalamic feeding and satiety centers. American Journal of Physiology. 1973;225(5):1089–1095. doi: 10.1152/ajplegacy.1973.225.5.1089. [DOI] [PubMed] [Google Scholar]
- 5.Kneer N.M., Bosch A.L., Clark M.G., Lardy H.A. Glucose inhibition of epinephrine stimulation of hepatic gluconeogenesis by blockade of the alpha-receptor function. Proceedings of the National Academy of Sciences of the United States of America. 1974;71(11):4523–4527. doi: 10.1073/pnas.71.11.4523. [DOI] [PMC free article] [PubMed] [Google Scholar]
- 6.Deibert D.C., DeFronzo R.A. Epinephrine-induced insulin resistance in man. Journal of Clinical Investigation. 1980;65(3):717–721. doi: 10.1172/JCI109718. [DOI] [PMC free article] [PubMed] [Google Scholar]
- 7.Shimizu N., Oomura Y., Novin D., Grijalva C.V., Cooper P.H. Functional correlations between lateral hypothalamic glucose-sensitive neurons and hepatic portal glucose-sensitive units in rat. Brain Research. 1983;265(1):49–54. doi: 10.1016/0006-8993(83)91332-x. [DOI] [PubMed] [Google Scholar]
- 8.Shimazu T. Neuronal regulation of hepatic glucose metabolism in mammals. Diabetes Metabolism Reviews. 1987;3(1):185–206. doi: 10.1002/dmr.5610030109. [DOI] [PubMed] [Google Scholar]
- 9.Granner D.K., O'Brien R.M. Molecular physiology and genetics of NIDDM. Importance of metabolic staging. Diabetes Care. 1992;15(3):369–395. doi: 10.2337/diacare.15.3.369. [DOI] [PubMed] [Google Scholar]
- 10.Becker T.C., Noel R.J., Coats W.S., Gomez-Foix A.M., Alam T., Gerard R.D. Use of recombinant adenovirus for metabolic engineering of mammalian cells. Methods in Cell Biology. 1994;43(Pt A):161–189. doi: 10.1016/s0091-679x(08)60603-2. [DOI] [PubMed] [Google Scholar]
- 11.Luppi P.H., Aston-Jones G., Akaoka H., Chouvet G., Jouvet M. Afferent projections to the rat locus coeruleus demonstrated by retrograde and anterograde tracing with cholera-toxin B subunit and Phaseolus vulgaris leucoagglutinin. Neuroscience. 1995;65(1):119–160. doi: 10.1016/0306-4522(94)00481-j. [DOI] [PubMed] [Google Scholar]
- 12.Considine R.V., Sinha M.K., Heiman M.L., Kriauciunas A., Stephens T.W., Nyce M.R. Serum immunoreactive-leptin concentrations in normal-weight and obese humans. New England Journal of Medicine. 1996;334(5):292–295. doi: 10.1056/NEJM199602013340503. [DOI] [PubMed] [Google Scholar]
- 13.Magnan C., Collins S., Berthault M.F., Kassis N., Vincent M., Gilbert M. Lipid infusion lowers sympathetic nervous activity and leads to increased beta-cell responsiveness to glucose. Journal of Clinical Investigation. 1999;103(3):413–419. doi: 10.1172/JCI3883. [DOI] [PMC free article] [PubMed] [Google Scholar]
- 14.Rajas F., Bruni N., Montano S., Zitoun C., Mithieux G. The glucose-6 phosphatase gene is expressed in human and rat small intestine: regulation of expression in fasted and diabetic rats. Gastroenterology. 1999;117(1):132–139. doi: 10.1016/s0016-5085(99)70559-7. [DOI] [PubMed] [Google Scholar]
- 15.Weyer C., Bogardus C., Mott D.M., Pratley R.E. The natural history of insulin secretory dysfunction and insulin resistance in the pathogenesis of type 2 diabetes mellitus. Journal of Clinical Investigation. 1999;104(6):787–794. doi: 10.1172/JCI7231. [DOI] [PMC free article] [PubMed] [Google Scholar]
- 16.Rajas F., Croset M., Zitoun C., Montano S., Mithieux G. Induction of PEPCK gene expression in insulinopenia in rat small intestine. Diabetes. 2000;49(7):1165–1168. doi: 10.2337/diabetes.49.7.1165. [DOI] [PubMed] [Google Scholar]
- 17.Lee Z.S., Critchley J.A., Tomlinson B., Young R.P., Thomas G.N., Cockram C.S. Urinary epinephrine and norepinephrine interrelations with obesity, insulin, and the metabolic syndrome in Hong Kong Chinese. Metabolism. 2001;50(2):135–143. doi: 10.1053/meta.2001.19502. [DOI] [PubMed] [Google Scholar]
- 18.Battezzati A., Caumo A., Martino F., Sereni L.P., Coppa J., Romito R. Nonhepatic glucose production in humans. American Journal of Physiology. Endocrinology and Metabolism. 2004;286(1):E129–E135. doi: 10.1152/ajpendo.00486.2002. [DOI] [PubMed] [Google Scholar]
- 19.DeFronzo R.A. Pathogenesis of type 2 diabetes mellitus. Medical Clinics of North America. 2004;88(4):787–835. doi: 10.1016/j.mcna.2004.04.013. [ix] [DOI] [PubMed] [Google Scholar]
- 20.Uyama N., Geerts A., Reynaert H. Neural connections between the hypothalamus and the liver. Anatomical Record. Part A, Discoveries in Molecular, Cellular, and Evolutionary Biology. 2004;280(1):808–820. doi: 10.1002/ar.a.20086. [DOI] [PubMed] [Google Scholar]
- 21.Mithieux G., Misery P., Magnan C., Pillot B., Gautier-Stein A., Bernard C. Portal sensing of intestinal gluconeogenesis is a mechanistic link in the diminution of food intake induced by diet protein. Cell Metabolism. 2005;2(5):321–329. doi: 10.1016/j.cmet.2005.09.010. [DOI] [PubMed] [Google Scholar]
- 22.Reyes B.A., Valentino R.J., Xu G., Van Bockstaele E.J. Hypothalamic projections to locus coeruleus neurons in rat brain. European Journal of Neuroscience. 2005;22(1):93–106. doi: 10.1111/j.1460-9568.2005.04197.x. [DOI] [PubMed] [Google Scholar]
- 23.Andreelli F., Foretz M., Knauf C., Cani P.D., Perrin C., Iglesias M.A. Liver adenosine monophosphate-activated kinase-alpha2 catalytic subunit is a key target for the control of hepatic glucose production by adiponectin and leptin but not insulin. Endocrinology. 2006;147(5):2432–2441. doi: 10.1210/en.2005-0898. [DOI] [PubMed] [Google Scholar]
- 24.Mithieux G., Gautier-Stein A., Rajas F., Zitoun C. Contribution of intestine and kidney to glucose fluxes in different nutritional states in rat. Comparative Biochemistry and Physiology Part B: Biochemistry and Molecular Biology. 2006;143(2):195–200. doi: 10.1016/j.cbpb.2005.11.007. [DOI] [PubMed] [Google Scholar]
- 25.Mithieux G., Rajas F., Zitoun C. Glucose utilization is suppressed in the gut of insulin-resistant high fat-fed rats and is restored by metformin. Biochemical Pharmacology. 2006;72(2):198–203. doi: 10.1016/j.bcp.2006.04.020. [DOI] [PubMed] [Google Scholar]
- 26.Fukaya M., Mizuno A., Arai H., Muto K., Uebanso T., Matsuo K. Mechanism of rapid-phase insulin response to elevation of portal glucose concentration. American Journal of Physiology. Endocrinology and Metabolism. 2007;293(2):E515–E522. doi: 10.1152/ajpendo.00536.2006. [DOI] [PubMed] [Google Scholar]
- 27.Troy S., Soty M., Ribeiro L., Laval L., Migrenne S., Fioramonti X. Intestinal gluconeogenesis is a key factor for early metabolic changes after gastric bypass but not after gastric lap-band in mice. Cell Metabolism. 2008;8(3):201–211. doi: 10.1016/j.cmet.2008.08.008. [DOI] [PubMed] [Google Scholar]
- 28.Kyrou I., Tsigos C. Stress hormones: physiological stress and regulation of metabolism. Current Opinion in Pharmacology. 2009;9(6):787–793. doi: 10.1016/j.coph.2009.08.007. [DOI] [PubMed] [Google Scholar]
- 29.Mithieux G., Andreelli F., Magnan C. Intestinal gluconeogenesis: key signal of central control of energy and glucose homeostasis. Current Opinion in Clinical Nutrition and Metabolic Care. 2009;12(4):419–423. doi: 10.1097/MCO.0b013e32832c4d6a. [DOI] [PubMed] [Google Scholar]
- 30.Pillot B., Soty M., Gautier-Stein A., Zitoun C., Mithieux G. Protein feeding promotes redistribution of endogenous glucose production to the kidney and potentiates its suppression by insulin. Endocrinology. 2009;150(2):616–624. doi: 10.1210/en.2008-0601. [DOI] [PubMed] [Google Scholar]
- 31.Delaere F., Magnan C., Mithieux G. Hypothalamic integration of portal glucose signals and control of food intake and insulin sensitivity. Diabetes & Metabolism. 2010;36(4):257–262. doi: 10.1016/j.diabet.2010.05.001. [DOI] [PubMed] [Google Scholar]
- 32.Knight Z.A., Hannan K.S., Greenberg M.L., Friedman J.M. Hyperleptinemia is required for the development of leptin resistance. PLoS One. 2010;5(6):e11376. doi: 10.1371/journal.pone.0011376. [DOI] [PMC free article] [PubMed] [Google Scholar]
- 33.Hayes M.T., Foo J., Besic V., Tychinskaya Y., Stubbs R.S. Is intestinal gluconeogenesis a key factor in the early changes in glucose homeostasis following gastric bypass? Obesity Surgery. 2011;21(6):759–762. doi: 10.1007/s11695-011-0380-7. [DOI] [PubMed] [Google Scholar]
- 34.Penhoat A., Mutel E., Correig M.A., Pillot B., Stefanutti A., Rajas F. Protein-induced satiety is abolished in the absence of intestinal gluconeogenesis. Physiology & Behavior. 2011;105(1):89–93. doi: 10.1016/j.physbeh.2011.03.012. [DOI] [PubMed] [Google Scholar]
- 35.Soty M., Visa M., Soriano S., Carmona Mdel C., Nadal A., Novials A. Involvement of ATP-sensitive potassium (K(ATP)) channels in the loss of beta-cell function induced by human islet amyloid polypeptide. Journal of Biological Chemistry. 2011;286(47):40857–40866. doi: 10.1074/jbc.M111.232801. [DOI] [PMC free article] [PubMed] [Google Scholar]
- 36.Chen L., Magliano D.J., Zimmet P.Z. The worldwide epidemiology of type 2 diabetes mellitus – present and future perspectives. Nature Reviews Endocrinology. 2012;8(4):228–236. doi: 10.1038/nrendo.2011.183. [DOI] [PubMed] [Google Scholar]
- 37.Delaere F., Duchampt A., Mounien L., Seyer P., Duraffourd C., Zitoun C. The role of sodium-coupled glucose co-transporter 3 in the satiety effect of portal glucose sensing. Molecular Metabolism. 2012;2:47–53. doi: 10.1016/j.molmet.2012.11.003. [DOI] [PMC free article] [PubMed] [Google Scholar]
- 38.Duraffourd C., De Vadder F., Goncalves D., Delaere F., Penhoat A., Brusset B. Mu-opioid receptors and dietary protein stimulate a gut-brain neural circuitry limiting food intake. Cell. 2012;150(2):377–388. doi: 10.1016/j.cell.2012.05.039. [DOI] [PubMed] [Google Scholar]
- 39.Mithieux G. Comment about intestinal gluconeogenesis after gastric bypass in human in relation with the paper by Hayes et al., Obes. Surg. 2011. Obesity Surgery. 2012;22(12):1920–1922. doi: 10.1007/s11695-012-0755-4. [DOI] [PubMed] [Google Scholar]
- 40.Delaere F., Akaoka H., De Vadder F., Duchampt A., Mithieux G. Portal glucose influences the sensory, cortical and reward systems in rats. European Journal of Neuroscience. 2013;38(10):3476–3486. doi: 10.1111/ejn.12354. [DOI] [PubMed] [Google Scholar]
- 41.De Vadder F., Kovatcheva-Datchary P., Goncalves D., Vinera J., Zitoun C., Duchampt A. Microbiota-generated metabolites promote metabolic benefits via gut-brain neural circuits. Cell. 2014;156(1–2):84–96. doi: 10.1016/j.cell.2013.12.016. [DOI] [PubMed] [Google Scholar]
- 42.Penhoat A., Fayard L., Stefanutti A., Mithieux G., Rajas F. Intestinal gluconeogenesis is crucial to maintain a physiological fasting glycemia in the absence of hepatic glucose production in mice. Metabolism. 2014;63(1):104–111. doi: 10.1016/j.metabol.2013.09.005. [DOI] [PubMed] [Google Scholar]
Associated Data
This section collects any data citations, data availability statements, or supplementary materials included in this article.
Supplementary Materials
I-G6pc−/− mice did not present any difference in body mass or food intake compared to WT mice on standard diet. (A) Body weight and (B) food intake monitored 5 weeks following tamoxifen treatment in I-G6pc−/− and WT mice (means ± SEM, n = 4–6).
Monitoring of (A) blood glucose and (B) GIR during the hyperinsulinemic-euglycemic clamp in I-G6pc−/− and WT mice. (means ± SEM, n = 5; **, p < 0.01 vs WT).
Study of sympathetic innervation and activity in pancreas of WT and I-G6pc−/− mice. (A) The pancreatic islets of I-G6pc−/− mice did not present any difference in TH fiber area compared to WT mice. (B) The protein expression of TH was increased in the pancreatic islets of I-G6pc−/− mice (means ± SEM, n = 4; *, p < 0.05 vs WT).
I-G6pc−/− mice did not present any difference in body mass or food intake compared to WT mice on HF/HS diet. (A) Body weight and (B) food intake monitored during 5 weeks on HF/HS diet in I-G6pc−/− and WT mice (means ± SEM, n = 4–6).