

Abstract
Purpose
Travel distances to care have increased substantially with centralization of complex cancer procedures at high-volume centers. We hypothesize that longer travel distances are associated with higher rates of postoperative readmission and poorer outcomes.
Methods
SEER-Medicare patients with bladder, lung, pancreas, or esophagus cancer who were diagnosed in 2001 to 2007 and underwent extirpative surgery were included. Readmission rates and survival were calculated using Kaplan-Meier functions. Multivariable negative binomial models were used to examine factors associated with readmission.
Results
Four thousand nine hundred forty cystectomies, 1,573 esophagectomies, 20,362 lung resections, and 2,844 pancreatectomies were included. Thirty- and 90-day readmission rates ranged from 13% to 29% and 23% to 43%, respectively, based on tumor type. Predictors of readmission were discharge to somewhere other than home, longer length of stay, comorbidities, higher stage at diagnosis, and longer travel distance (P < .001 for each). Patients who lived farther from the index hospital also had increased emergency room visits and were more likely to be readmitted to a hospital other than the index hospital (P < .001). Of readmitted patients, 31.9% were readmitted more than once. Long-term survival was worse and costs of care higher for patients who were readmitted (P < .001 for all).
Conclusion
The burden of readmissions after major cancer surgery is high, resulting in substantially poorer patient outcomes and higher costs. Risk of readmission was most strongly associated with length of stay and discharge destination. Travel distance also has an impact on patterns of readmission. Interventions targeted at higher risk individuals could potentially decrease the population burden of readmissions after major cancer surgery.
INTRODUCTION
Patient travel distances to complex surgical cancer care have increased substantially over the last two decades. In a 2009 study examining pancreatectomy and esophagectomy, we demonstrated a more than 70% increase in patient travel as surgery was centralized at high-volume centers, raising the question of whether travel burden is a barrier to care for some patients.1 For many patients, travel for a single episode of care will be feasible, whereas repeated trips may become a problem. Surgery is often viewed as a single episode of care, but in reality, complex surgical procedures often require extended hospital stays and multiple perioperative clinic visits, amounting to substantial travel burden for patients and their caregivers. The impact of travel distance on the postoperative care experience has not been previously studied. It is possible that patients may miss or delay postoperative visits as a result of long travel distances. Delayed care could increase the risk of hospital readmission if potentially minor issues are permitted to escalate (ie, urinary tract infection escalating to urosepsis). It is also possible that patients who live far from the operative (index) hospital may disproportionately use local emergency rooms (ERs) for postoperative care. Physicians at a local facility may be unfamiliar not only with the patient's specific case, but also with the broader management issues after complex cancer surgery. As a result, they may be less comfortable managing these problems in the outpatient setting, increasing the likelihood of readmission.
Hospital readmissions are costly and lead to fragmentation of care, resulting in poorer clinical outcomes, including greater 1-year mortality rates and detriment in the timing of and eligibility for recommended adjuvant therapies.2,3 Hospital readmission rates after major cancer surgery are high.4–25 The impact of travel distance on hospital readmissions is unknown. This study examines patterns of postoperative readmission for four cancers that require complex surgical resections—bladder, esophagus, lung, and pancreas cancer. We hypothesize that longer travel distances are associated with higher rates of postoperative readmission and poorer patient outcomes.
METHODS
Data Source
Data for this study were derived from the Surveillance, Epidemiology, and End Results (SEER)–Medicare linked database, which is a population-based data source that provides detailed information about 1.6 million Medicare beneficiaries with cancer. SEER is a National Cancer Institute registry program that collects information about cancer site, stage, and histology for incident cancer cases occurring in the SEER geographic areas. Sixteen SEER registries participate in the SEER-Medicare linkage, covering approximately 28% of the US population. The data used in this study include incident cancer cases from January 2001 to December 2007 linked to Medicare claims through 2009.
Patient Cohort Selection
Patients were included in the study if they were diagnosed with bladder, lung, pancreas, or esophagus cancer from 2001 to 2007. Patients were excluded if they were diagnosed at autopsy or by death certificate, ≤ 65 years of age at diagnosis (to ensure claims data available for 12 months before diagnosis to calculate comorbidity), not continuously enrolled in both Medicare Parts A and B for 12 months before and after cancer diagnosis, or enrolled in a health maintenance organization or Medicare Managed Care anytime during 12 months before and after cancer diagnosis (because claims data may not capture all delivered care for these patients). Finally, the cohort was limited to patients who underwent major extirpative surgery (Appendix Table A1, online only) for invasive bladder, esophagus, lung, or pancreas cancer between January 1, 2001, and December 31, 2008. Patients were included if they had claims with relevant International Classification of Diseases, Ninth Revision, procedure codes in the Medicare Provider Analysis and Review file (26,588 of 29,719 patients) or if they had claims with relevant Healthcare Common Procedure Coding System codes in the National Claims History file as well as admission records in the Medicare Provider Analysis and Review file for corresponding dates (3,131 of 29,719 patients). A flowchart of cohort selection is presented in Appendix Figure 1 (online only).
Fig 1.

(A) Travel distances by SEER region, disease site, and index hospital volume. (B) Travel distances in the Southwest region are presented separately because of the large difference in range of values compared with other regions. Outlier values are not shown. Horizontal reference line designates 25 miles.
Outcomes
The primary outcomes included readmissions to acute care hospitals within 30 and 90 days of discharge from extirpative surgery (the index discharge). Admissions to acute inpatient rehabilitation facilities were excluded. Transfer, defined as admission to an acute inpatient facility other than the index hospital on the same day or day after index discharge, was considered part of the index admission, and the two admission records were analyzed as one admission. Many patients were readmitted more than once, but only the first readmission within 90 days was used for the analysis of factors associated with readmission. On the basis of the timing of first readmission, patients were grouped into the following three mutually exclusive groups: no readmission, 30-day readmission, and 31- to 90-day readmission. For all readmitted patients, the time from index discharge to first readmission, the total number of readmissions, the total readmission length of stay including all readmissions within 90 days, and the total number of complications during the 90 days after index discharge were measured.
Other outcomes measured included short-term mortality (30- and 90-day), total number of ER visits not resulting in readmission, and total cost of care including both inpatient and outpatient visits. Overall survival was measured as the number of months from surgery to death or the study end (December 31, 2009), whichever came first.
Covariates
Distance to care was defined as the straight-line distance between patient and provider, measured in miles.26,27 Patients and providers were geocoded at the zip code level. Distance was examined in quartile groups. Because distance to care varies by cancer type, the quartiles were calculated for each cancer type separately.
Hospital volume, defined as the total number of SEER-Medicare patients who had extirpative surgery at the same hospital in the same year, was also calculated for each cancer type and analyzed in quartiles. Statistics for hospital volume were calculated at the patient level, such that the median value represents the hospital volume for the 50th percentile of patients, not the volume of the 50th percentile hospital.
Patient characteristics examined included demographic, socioeconomic, and clinical factors. The rate and number of postoperative complications, including surgical site infections, urinary tract infections, pneumonia, sepsis, venous thromboembolic events, and myocardial infarction, were also measured.28
Statistical Analysis
Descriptive statistics were reported for all variables and compared across disease sites. The distribution of travel distance to index hospital was plotted to illustrate variation in distance to care across SEER region, disease site, and index hospital volume. Thirty- and 90-day readmission rates were calculated for each cancer site using Kaplan-Meier estimates accounting for the number of patients at risk in each time period.
Multivariable negative binomial regression was performed to identify factors associated with readmissions and calculate incidence rate ratios counting the number of readmissions over days at risk. Patient demographics, clinical characteristics, and distance to index hospital and hospital volume were examined. Patients who died during the index admission were excluded from these analyses, because these patients could not have been readmitted. Similarly, for the 90-day readmission analysis, patients who did not survive 30 days or were readmitted during the first 30 days were excluded. The main analysis was performed by pooling all four cancer sites. However, the same analyses were repeated for each cancer site separately for sensitivity analysis.
The outcomes of patients who were readmitted within 90 days were compared by disease site with the outcomes of patients who were not readmitted. To investigate the association between patient travel and outcomes, the four cancer types were pooled and the outcomes were examined by distance quartiles. Survival since surgery was examined using Kaplan-Meier functions. Total costs of care were calculated as the total charges for all inpatient and outpatient care during the designated time period. SAS version 9.3 (SAS Institute, Cary, NC) was used for all statistical analyses. The study was reviewed and approved by the Institutional Review Board of the University of North Carolina (Chapel Hill, NC).
RESULTS
Index Hospitalization
Twenty-nine thousand seven hundred nineteen patients were included in the analysis (4,940 cystectomies, 1,573 esophagectomies, 20,362 lung resections, and 2,844 pancreatectomies; Table 1). Mean age ranged from 72.9 to 74.5 years for all disease sites. Median length of stay for the index admission ranged from 8 days for lung resections to 14 days for esophagectomy. One thousand three hundred ninety-four patients died during the index admission, representing 3.5% of cystectomies, 10.8% of esophagectomies, 4.2% of lung resections, and 6.8% of pancreatectomies.
Table 1.
Patient Demographics and Descriptive Statistics for All Cancer Sites
| Demographic or Characteristic* | Total (N = 29,719) |
Cancer Site |
||||||||
|---|---|---|---|---|---|---|---|---|---|---|
| Bladder (n = 4,940) |
Lung (n = 20,362) |
Pancreas (n = 2,844) |
Esophagus (n = 1,573) |
|||||||
| No. of Patients | % | No. of Patients | % | No. of Patients | % | No. of Patients | % | No. of Patients | % | |
| Age, years | ||||||||||
| Mean | 73.9 | 74.5 | 73.8 | 74.1 | 72.9 | |||||
| SD | 5.4 | 5.6 | 5.3 | 5.5 | 5.1 | |||||
| Range | 66-100 | 66-100 | 66-96 | 66-95 | 66-90 | |||||
| Median | 73 | 74 | 73 | 74 | 72 | |||||
| Q1 | 70 | 70 | 70 | 70 | 69 | |||||
| Q3 | 78 | 79 | 77 | 78 | 76 | |||||
| 66-69 | 7,390 | 25 | 1,139 | 23 | 5,070 | 25 | 689 | 24 | 492 | 31 |
| 70-74 | 9,579 | 32 | 1,463 | 30 | 6,680 | 33 | 894 | 31 | 542 | 34 |
| 75-79 | 7,877 | 27 | 1,335 | 27 | 5,445 | 27 | 745 | 26 | 352 | 22 |
| ≥ 80 | 4,873 | 16 | 1,003 | 20 | 3,167 | 16 | 516 | 18 | 187 | 12 |
| Sex | ||||||||||
| Male | 16,265 | 55 | 3,633 | 74 | 10,113 | 50 | 1,288 | 45 | 1,231 | 78 |
| Female | 13,454 | 45 | 1,307 | 26 | 10,249 | 50 | 1,556 | 55 | 342 | 22 |
| Race | ||||||||||
| White | 26,583 | 89 | 4,485 | 91 | 18,186 | 89 | 2,482 | 87 | 1,430 | 91 |
| African American | 1,484 | 5 | 200 | 4 | 1,046 | 5 | 165 | 6 | 73 | 5 |
| Other | 1,652 | 6 | 255 | 5 | 1,130 | 6 | 197 | 7 | 70 | 4 |
| Marital status | ||||||||||
| Married with living partner | 18,174 | 61 | 3,230 | 65 | 12,066 | 59 | 1,768 | 62 | 1,110 | 71 |
| All other† | 11,545 | 39 | 1,710 | 35 | 8,296 | 41 | 1,076 | 38 | 463 | 29 |
| Residence | ||||||||||
| Urban | 3,673 | 12 | 667 | 14 | 2,518 | 12 | 289 | 10 | 199 | 13 |
| Metro | 25,575 | 86 | 4,192 | 85 | 17,524 | 86 | 2,521 | 89 | 1,338 | 85 |
| Rural | 469 | 2 | 81 | 2 | 320 | 2 | 33 | 1 | 35 | 2 |
| Dual eligibility (Medicaid), yes | 3,240 | 11 | 458 | 9 | 2,366 | 12 | 297 | 10 | 119 | 8 |
| % of patient census tract below poverty level | ||||||||||
| Median | 7.1 | 7.1 | 7.2 | 6.6 | 7.1 | |||||
| Q1 | 3.9 | 3.9 | 3.9 | 3.6 | 4.1 | |||||
| Q3 | 13.5 | 13.5 | 13.7 | 12.7 | 12.8 | |||||
| Stage | ||||||||||
| Localized | 20,384 | 69 | 3,862 | 78 | 14,465 | 71 | 1,195 | 42 | 862 | 55 |
| Node positive | 7,874 | 26 | 873 | 18 | 4,959 | 24 | 1,425 | 50 | 617 | 39 |
| Distant | 1,461 | 5 | 205 | 4 | 938 | 5 | 224 | 8 | 94 | 6 |
| Charlson comorbidity index | ||||||||||
| 0 | 13,657 | 46 | 2,918 | 59 | 8,554 | 42 | 1,304 | 46 | 881 | 56 |
| 1 | 9,164 | 31 | 1,171 | 24 | 6,640 | 33 | 913 | 32 | 440 | 28 |
| 2+ | 6,898 | 23 | 851 | 17 | 5,168 | 25 | 627 | 22 | 252 | 16 |
| Distance to index hospital, miles | ||||||||||
| Mean | 47.1 | 59.4 | 40.0 | 63.4 | 71.0 | |||||
| SD | 186.4 | 197.5 | 173.7 | 226.0 | 221.1 | |||||
| Median | 10.4 | 13.6 | 9.4 | 13.9 | 16.8 | |||||
| Q1 | 4.4 | 5.2 | 4.0 | 5.6 | 6.4 | |||||
| Q3 | 29.1 | 40.7 | 24.1 | 40.5 | 50.2 | |||||
| Yearly procedure volume, No. of procedures‡ | ||||||||||
| Mean | 12.3 | 7.7 | 15.2 | 4.9 | 3.1 | |||||
| SD | 14.4 | 9.7 | 15.8 | 4.0 | 2.8 | |||||
| Median | 8 | 4 | 10 | 3 | 2 | |||||
| Q1 | 3 | 2 | 5 | 2 | 1 | |||||
| Q3 | 16 | 10 | 19 | 7 | 4 | |||||
| Patients with at least one complication during index admission | 5,307 | 18 | 918 | 19 | 3,163 | 16 | 686 | 24 | 540 | 34 |
| Length of stay for index admission, days | ||||||||||
| Mean | 12.5 | 13.9 | 10.7 | 17.4 | 22.0 | |||||
| SD | 12.8 | 12.2 | 11.0 | 14.9 | 22.2 | |||||
| Median | 9 | 10 | 8 | 13 | 14 | |||||
| Q1 | 7 | 8 | 6 | 9 | 11 | |||||
| Q3 | 13 | 15 | 11 | 20 | 24 | |||||
| Deaths during index admission | 1,394 | 5 | 173 | 4 | 859 | 4 | 192 | 7 | 170 | 11 |
| Discharge destination | ||||||||||
| Home | 23,465 | 79 | 3,760 | 76 | 16,574 | 81 | 2,071 | 73 | 1,060 | 67 |
| SNF | 3,903 | 13 | 823 | 17 | 2,349 | 12 | 476 | 17 | 255 | 16 |
| Other§ | 2,351 | 8 | 357 | 7 | 1,439 | 7 | 297 | 10 | 258 | 16 |
| Readmission | ||||||||||
| No readmission | 21,815 | 73 | 2,910 | 59 | 15,898 | 78 | 1,921 | 68 | 1,086 | 69 |
| 30-day readmission | 4,859 | 16 | 1,411 | 29 | 2,567 | 13 | 580 | 20 | 301 | 19 |
| 31- to 90-day readmission | 3,045 | 10 | 619 | 13 | 1,897 | 9 | 343 | 12 | 186 | 12 |
Abbreviations: SD, standard deviation; SNF, skilled nursing facility; Q, quartile.
All characteristics are significantly different across disease sites (P < .001 for all), except census tract poverty (P = .018).
Separated, divorced, or widowed.
Statistics are calculated at the patient level. For example, 50% of cystectomy patients had surgery at a hospital that performed four or more cystectomies for Medicare patients with bladder cancer per year. Mean/median volume at the hospital level is much lower.
The majority of these patients were transferred to another inpatient facility (eg, rehabilitation, psychiatric, long-term care) from the index admission.
Average travel distances for surgery were inversely proportional to known cancer incidence patterns, ranging from a median of 9.4 miles for lung to a median of 16.8 miles for esophagus (Fig 1). Patient travel distance increased as index hospital volume increased. Disease site and hospital volume patterns were the same in all regions; however, patients in certain regions had much longer average travel distances. In particular, in the Southwest region (which for these data include only New Mexico), patient travel was much greater. Presumably as a result, few patients in the Southwest had surgery at the highest volume hospitals.
Readmissions
Overall, 30- and 90-day readmission rates ranged from 13% and 23% for lung resection to 30% and 43% for cystectomy, respectively (Fig 2). Primary diagnoses for readmissions were similar at 30 and 90 days and were generally attributable to the prior surgery (Appendix Table 2, online only). Clinical and sociodemographic factors associated with readmission at 30 versus 90 days were also similar (Table 2). Older patients, male patients, and those with more advanced cancer and more comorbidity were consistently more likely to be readmitted (P < .05 for all). The strongest predictor of readmission, particularly at 30 days, was discharge from index admission to somewhere other than home (eg, skilled nursing facility, acute rehab; P < .001 for all). Similarly, longer length of stay was associated with increased risk of readmission at 30 and 90 days (P < .001). The occurrence of complications during the index admission was associated with increased risk of readmission at 90 days (P < .001) but not 30 days. Index hospital procedure volume was associated with readmission at 30 days (P < .05) but not 90 days, but the association was not linear. When all disease sites were analyzed together, distance to care was associated with 30-day (P < .05), but not 90-day, readmission rates. Patients who traveled the farthest were the most likely to be readmitted. However, when each disease site was analyzed separately, this association held true only for patients with lung cancer (data not shown).
Fig 2.
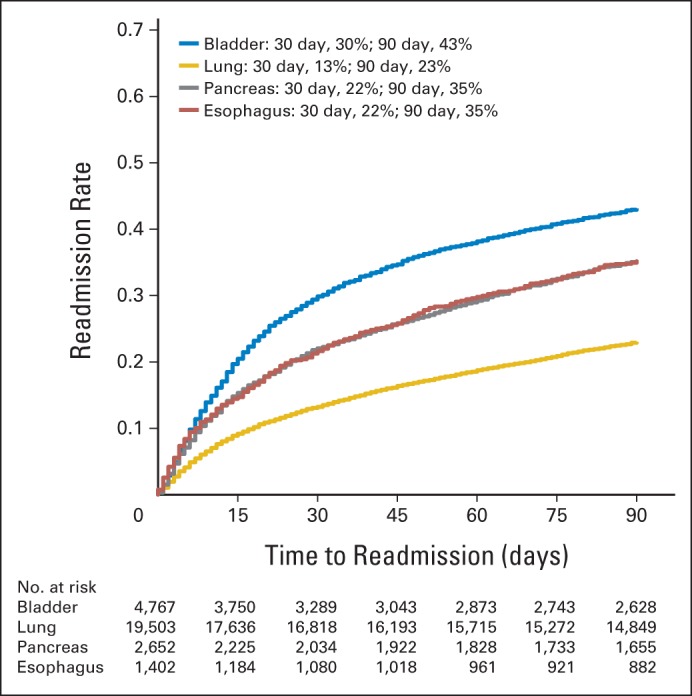
Readmission rates by disease site.
Table 2.
Multivariable Analysis of Factors Associated With Readmission at 30 and 90 Days
| Factor | 30-Day Readmission |
30- to 90-Day Readmission |
||||||
|---|---|---|---|---|---|---|---|---|
| No. of Patietns | Rate per Person-Day | IRR | 95% CI | No. of Patients | Rate per Person-Day | IRR | 95% CI | |
| Age, years | ||||||||
| 66-69 | 7,135 | 0.17 | 1 | 5,973 | 0.13 | 1 | ||
| 70-74 | 9,178 | 0.18 | 1.06 | 0.94 to 1.18 | 7,601 | 0.14 | 1.03 | 0.94 to 1.14 |
| 75-79 | 7,473 | 0.21 | 1.23* | 1.09 to 1.38 | 6,037 | 0.15 | 1.10 | 0.99 to 1.21 |
| ≥ 80 | 4,539 | 0.22 | 1.24† | 1.08 to 1.41 | 3,608 | 0.15 | 1.11 | 0.98 to 1.24 |
| Sex | ||||||||
| Male | 15,363 | 0.22 | 1 | 12,246 | 0.15 | 1 | ||
| Female | 12,962 | 0.16 | 0.64* | 0.59 to 0.70 | 10,973 | 0.13 | 0.89† | 0.82 to 0.96 |
| Race | ||||||||
| White | 25,368 | 0.20 | 1 | 20,744 | 0.14 | 1 | ||
| African American | 1,385 | 0.18 | 0.93 | 0.7 to 1.14 | 1,148 | 0.16 | 1.07 | 0.91 to 1.26 |
| Other | 1,572 | 0.16 | 0.78‡ | 0.64 to 0.95 | 1,327 | 0.13 | 0.86 | 0.73 to 1.02 |
| Marital status | ||||||||
| Married with living partner | 17,352 | 0.19 | 1 | 14,247 | 0.14 | 1 | ||
| All other | 10,973 | 0.19 | 1.01 | 0.92 to 1.10 | 8,972 | 0.14 | 0.91‡ | 0.84 to 0.98 |
| Residence | ||||||||
| Urban | 3,491 | 0.20 | 0.97 | 0.84 to 1.12 | 2,825 | 0.15 | 1.07 | 0.95 to 1.21 |
| Metro | 24,386 | 0.19 | 1 | 20,048 | 0.14 | 1 | ||
| Rural | 447 | 0.26 | 1.43‡ | 1.04 to 1.98 | 345 | 0.14 | 0.93 | 0.69 to 1.28 |
| Dual eligibility (Medicaid) | ||||||||
| No | 25,279 | 0.19 | 1 | 20,787 | 0.14 | 1 | ||
| Yes | 3,046 | 0.22 | 1.18‡ | 1.03 to 1.37 | 2,432 | 0.16 | 1.11 | 0.98 to 1.26 |
| Stage | ||||||||
| Localized | 19,565 | 0.18 | 1 | 16,198 | 0.12 | 1 | ||
| Node positive | 7,409 | 0.21 | 1.12‡ | 1.02 to 1.23 | 5,991 | 0.19 | 1.59* | 1.48 to 1.72 |
| Distant | 1,351 | 0.25 | 1.44* | 1.20 to 1.74 | 1,030 | 0.24 | 1.95* | 1.69 to 2.24 |
| No. of complications (continuous) | 1.03 | 0.98 to 1.09 | 1.08* | 1.03 to 1.12 | ||||
| Length of stay, days (continuous) | 1.03* | 1.03 to 1.04 | 1.01* | 1.01 to 1.01 | ||||
| Modified Charlson score | ||||||||
| 0 | 13,217 | 0.17 | 1 | 11,114 | 0.12 | 1 | ||
| 1 | 8,689 | 0.19 | 1.13‡ | 1.03 to 1.25 | 7,157 | 0.14 | 1.09 | 1.00 to 1.19 |
| 2+ | 6,419 | 0.25 | 1.46* | 1.32 to 1.63 | 4,948 | 0.19 | 1.42* | 1.30 to 1.55 |
| Discharge destination | ||||||||
| Home | 23,457 | 0.17 | 1 | 19,804 | 0.13 | 1 | ||
| SNF | 3,898 | 0.31 | 1.61* | 1.42 to 1.81 | 2,819 | 0.21 | 1.46* | 1.32 to 1.62 |
| Other | 970 | 0.41 | 3.25* | 2.54 to 4.16 | 596 | 0.27 | 1.62* | 1.35 to 1.93 |
| % census tract below poverty | ||||||||
| Highest (≥ 75%) | 6,879 | 0.20 | 1 | 5,612 | 0.16 | 1 | ||
| Quartile 2 | 6,920 | 0.20 | 1.05 | 0.93 to 1.18 | 5,621 | 0.14 | 0.91 | 0.82 to 1.01 |
| Quartile 3 | 6,982 | 0.19 | 1.00 | 0.88 to 1.14 | 5,761 | 0.14 | 0.90 | 0.81 to 1.01 |
| Lowest (< 25%) | 7,006 | 0.19 | 1.02 | 0.89 to 1.16 | 5,798 | 0.14 | 0.93 | 0.83 to 1.04 |
| Hospital volume quartile | ||||||||
| Lowest | 7,269 | 0.18 | 1 | 6,020 | 0.14 | 1 | ||
| Quartile 2 | 6,820 | 0.21 | 1.25* | 1.11 to 1.41 | 5,504 | 0.13 | 0.98 | 0.89 to 1.09 |
| Quartile 3 | 7,208 | 0.19 | 1.15‡ | 1.02 to 1.29 | 5,922 | 0.14 | 1.06 | 0.95 to 1.17 |
| Highest | 7,028 | 0.20 | 1.26* | 1.12 to 1.43 | 5,773 | 0.15 | 1.09 | 0.99 to 1.21 |
| Distance to hospital quartile | ||||||||
| Nearest | 7,004 | 0.18 | 1 | 5,803 | 0.15 | 1 | ||
| Quartile 2 | 7,063 | 0.19 | 1.14‡ | 1.01 to 1.28 | 5,793 | 0.14 | 0.96 | 0.86 to 1.06 |
| Quartile 3 | 7,091 | 0.19 | 1.12 | 1.00 to 1.27 | 5,822 | 0.14 | 0.96 | 0.86 to 1.06 |
| Farthest | 7,105 | 0.21 | 1.27* | 1.12 to 1.45 | 5,748 | 0.14 | 0.94 | 0.84 to 1.05 |
Abbreviations: IRR, incidence rate ratio; SNF, skilled nursing facility.
P < .001.
P < .01.
P < .05.
Outcomes
Patients who were readmitted had poorer outcomes than patients who were never readmitted. Of readmitted patients, 31.9% (2,542 of 7,904 patients) were readmitted more than once during the 90 days after the index hospitalization (Appendix Table A3, online only). On average, these 7,904 patients had 1.5 readmissions (range, one to 10 readmissions) during the 90 days after the index hospitalization and spent a total of 11.4 (lung), 13.4 (bladder), 13.8 (pancreas), and 15.8 (esophagus) readmission days in the hospital. For each tumor type, approximately one third of readmitted patients (30% to 34%) were readmitted to a hospital other than the index hospital. Median total 90-day costs of care for readmitted patients were substantially higher than the costs for those who were not readmitted (bladder, $45,000 v $26,000; esophagus, $65,000 v $40,000; lung, $44,000 v $26,000; and pancreas, $63,000 v $45,000, respectively; P < .001 for each). For patients with bladder and lung cancer, 90-day postdischarge mortality for readmitted patients was 15% and 14%, respectively, compared with 10% and 9%, respectively, for patients who were never readmitted (P < .001). In contrast, 90-day postdischarge mortality for patients with pancreas and esophagus cancer was not statistically significantly different for those who were readmitted compared with those who were not readmitted. However, 1-year mortality was statistically significantly worse for readmitted patients than for patients not readmitted for all disease sites (bladder, 40% v 24%; esophagus, 45% v 34%; lung, 33% v 15%; and pancreas, 55% v 37%, respectively; P < .001 for all; Fig 3).
Fig 3.

Kaplan-Meier estimates of survival by readmission group for (A) bladder cancer, (B) lung cancer, (C) pancreas cancer, and (D) esophagus cancer.
Impact of Travel Distance
Time to readmission was similar regardless of travel distance (Table 3). Readmission to a hospital other than the index hospital was highly associated with travel distance, with 59% of patients in the longest distance quartile readmitted to different hospitals versus only 11% of patients in the shortest distance quartile (P < .001).
Table 3.
Outcomes by Distance Quartile
| Characteristic | Total (N = 29,653) |
Quartile of Distance to Index Hospital |
P | ||||||||
|---|---|---|---|---|---|---|---|---|---|---|---|
| Quartile 1: Nearest (n = 7,432) |
Quartile 2 (n = 74,21) |
Quartile 3 (n = 7,403) |
Quartile 4: Farthest (n = 7,397) |
||||||||
| No. of Patients | % | No. of Patients | % | No. of Patients | % | No. of Patients | % | No. of Patients | % | ||
| Time to readmission, days* | .299 | ||||||||||
| Mean | 29.15 | 29.97 | 28.76 | 29.37 | 28.55 | ||||||
| SD | 25.67 | 25.67 | 25.33 | 25.83 | 25.85 | ||||||
| Median (Q1, Q3) | 20 | 22 | 20 | 20 | 19 | ||||||
| Q1 | 7 | 8 | 7 | 8 | 7 | ||||||
| Q3 | 47 | 48 | 45 | 47 | 46 | ||||||
| Readmission to index hospital* | < .001 | ||||||||||
| No | 2,604 | 33 | 219 | 11 | 394 | 20 | 777 | 39 | 1,214 | 59 | |
| Yes | 5,285 | 67 | 1,696 | 89 | 1,561 | 80 | 1,196 | 61 | 832 | 41 | |
| 90-day mortality | 2,969 | 10 | 860 | 12 | 748 | 10 | 672 | 9 | 689 | 9 | < .001 |
| 1-year mortality | 7,084 | 24 | 1,914 | 26 | 1,761 | 24 | 1,687 | 23 | 1,722 | 23 | < .001 |
| Complications during index admission, No. | |||||||||||
| Mean | 0.31 | 0.34 | 0.32 | 0.30 | 0.29 | .001 | |||||
| SD | 0.87 | 0.90 | 0.87 | 0.85 | 0.86 | ||||||
| 0 | 24,358 | 82 | 5,985 | 81 | 6,029 | 81 | 6,141 | 83 | 6,203 | 84 | < .001 |
| ≥ 1 | 5,295 | 18 | 1,447 | 19 | 1,392 | 19 | 1,262 | 17 | 1,194 | 16 | |
| Complications in 90 day after index discharge, No. | |||||||||||
| Mean | 0.32 | 0.29 | 0.33 | 0.32 | 0.33 | .085 | |||||
| SD | 1.04 | 0.95 | 1.05 | 1.07 | 1.08 | ||||||
| 0 | 25,625 | 86 | 6,450 | 87 | 6,389 | 86 | 6,433 | 87 | 6,353 | 86 | .190 |
| ≥ 1 | 4,028 | 14 | 982 | 13 | 1,032 | 14 | 970 | 13 | 1,044 | 14 | |
| No. of ER visits in 30 days | |||||||||||
| Mean | 0.11 | 0.10 | 0.08 | 0.12 | 0.14 | < .001 | |||||
| SD | 0.37 | 0.37 | 0.31 | 0.39 | 0.41 | ||||||
| Range | 0-10 | 0-10 | 0-5 | 0-7 | 0-7 | ||||||
| 0 | 26,919 | 91 | 6,824 | 92 | 6,901 | 93 | 6,678 | 90 | 6,516 | 88 | < .001 |
| ≥ 1 | 2,734 | 9 | 608 | 8 | 520 | 7 | 725 | 10 | 881 | 12 | |
| No. of ER visits in 90 days | |||||||||||
| Mean | 0.21 | 0.19 | 0.16 | 0.22 | 0.27 | < .001 | |||||
| SD | 0.62 | 0.70 | 0.47 | 0.59 | 0.69 | ||||||
| Range | 0-38 | 0-38 | 0-6 | 0-13 | 0-18 | ||||||
| 0 | 24,923 | 84 | 6,359 | 86 | 6,443 | 87 | 6,198 | 84 | 5,923 | 80 | < .001 |
| ≥ 1 | 4,730 | 16 | 1,073 | 14 | 978 | 13 | 1,205 | 16 | 1,474 | 20 | |
| Total No. of readmissions within 90 days | |||||||||||
| Mean | 0.39 | 0.37 | 0.38 | 0.39 | 0.41 | .003 | |||||
| SD | 0.77 | 0.74 | 0.75 | 0.77 | 0.80 | ||||||
| 0 | 21,763 | 73 | 5,517 | 74 | 5,466 | 74 | 5,429 | 73 | 5,351 | 72 | .034 |
| 1 | 5,352 | 18 | 1,339 | 18 | 1,325 | 18 | 1,334 | 18 | 1,354 | 18 | |
| ≥ 2 | 2,538 | 9 | 576 | 8 | 630 | 8 | 640 | 9 | 692 | 9 | |
| Total readmission length of stay within 90 days, days* | .004 | ||||||||||
| Mean | 27.00 | 28.06 | 27.38 | 26.99 | 25.68 | ||||||
| SD | 21.33 | 20.40 | 21.27 | 22.41 | 21.12 | ||||||
| Median | 21 | 22 | 21 | 20 | 19 | ||||||
| Q1 | 14 | 15 | 14 | 14 | 14 | ||||||
| Q3 | 32 | 34 | 32 | 31 | 30 | ||||||
| Overall survival, months | .150 | ||||||||||
| Mean | 36.18 | 35.81 | 36.37 | 36.69 | 35.85 | ||||||
| SD | 27.58 | 28.33 | 27.80 | 27.10 | 27.08 | ||||||
| Median | 31 | 30 | 32 | 32 | 31 | ||||||
| Q1 | 13 | 11 | 13 | 14 | 13 | ||||||
| Q3 | 55 | 56 | 54 | 55 | 54 | ||||||
Abbreviations: ER, emergency room; SD, standard deviation; Q, quartile.
Calculated for readmission patients only.
Patients who traveled longer distances generally had lower short-term mortality than patients who traveled shorter distances (Table 3). Accordingly, patients who lived farther from the index hospital had lower rates of complications during the index admission. However, recorded complications during the 90 days after discharge from the index admission did not vary based on travel distance to index hospital. Although no difference in postdischarge complication rates was noted, patients who lived farther from the index hospital had consistently higher rates of ER visits than those who had surgery closer to home. Eight percent of patients in the shortest travel quartiles had at least one ER visit by 30 days compared with 12% of patients in the longest travel quartile (P < .001); at 90 days, these differences persisted (14% v 20%, respectively; P < .001). Although patients in the longest travel groups had slightly higher readmission rates, among readmitted patients, the total number of readmission days spent in the hospital was greater for patients who lived closer to the index hospital (P = .004). Long-term overall survival was not different across distance groups.
DISCUSSION
Readmission rates after major cancer surgery are high. In this study, depending on cancer site, 20% to 50% of patients older than age 65 years were readmitted during the 90 days after discharge from the surgical admission. The precise burden of postoperative readmissions is difficult to measure because there is no standard methodology for defining readmission after cancer surgery. Varying time periods from 30 days to 1 year have been used to try to capture readmissions, and using secondary data, it is challenging to determine whether a hospital admission is a readmission (attributable to the index admission and potentially avoidable) or rather a separate index admission attributable to cancer progression or other comorbid medical conditions. This study suggests that the bulk of readmissions up to 90 days are attributable to the surgical intervention. The rate of readmission tapers at 20 days and further after 40 days, but a substantial portion of readmissions still occurs after this time period. Studies aimed at qualitatively studying readmissions may be able to focus on shorter time periods as representative of the larger picture. However, studies aimed at quantifying the burden of readmissions attributable to cancer surgery should consider a longer postoperative time window, because a large portion of readmissions occurs after 30 days.
Hospital readmissions are costly and have been viewed as a marker of inferior quality of care in broader clinical contexts. In general, patients who are readmitted have poorer short- and long-term outcomes. As a result, investigators have sought to identify risk factors for readmission as a critical step toward the development of targeted interventions aimed at decreasing readmissions.4,9–25 For cancer surgery, the most consistent risk factors for readmission are strikingly similar across tumor types and include patient comorbidity,4,13,16,18–22,25 occurrence of postoperative complications during index admission,9,11,12,16,17,21,22 and extended length of stay of index admission.4,11,12,14–16,20–22 Extended length of stay and discharge to a destination other than home,17,25 which were strong risk factors for readmission in this study, are both likely proxies for poor performance status. Consequently, efforts to minimize readmissions may best be directed toward patients with a complex index hospital stay and those with poor performance status preoperatively or at the time of discharge from the index hospitalization.
Because complex cancer surgery often requires longer hospitalizations and multiple perioperative visits, we hypothesized that travel burden could be a barrier to postoperative care for some patients. In this study, patients who traveled long distances had better immediate postoperative outcomes than patients who traveled short distances to the operative hospital. This is a result of the high correlation between longer travel distances and higher hospital volume. However, although postdischarge rates of complications were the same across travel distance groups, patients who traveled long distances to the operative hospital had higher rates of readmission and substantially higher rates of ER visits than patients who had surgery close to home. The latter finding suggests that patients who live far from the surgeon are more likely to use the ER for smaller postoperative issues that do not require readmission rather than travel long distances to the surgeon's office for evaluation.
Travel distance was also associated with the location of readmission, with patients who lived far from the index hospital being much more likely to seek postoperative care at a hospital closer to their home. The consequences of readmission to a hospital other than the index hospital are unknown. However, it can be presumed that this trend would lead to further increases in cost and fragmentation of care as additional providers who are unfamiliar with the patient, procedure, and plan of care are added to the treatment team. Additional studies are needed to determine the relationship between the location of readmission and the costs and outcomes of postoperative cancer care.
This study examined only patients with continuous Medicare coverage throughout their initial diagnosis and treatment for cancer. The findings from this older population may not completely reflect patterns of care and readmission for younger populations or for those with no or different health coverage. Older patients are more likely to have increased comorbidity and are also, in general, less willing to travel longer distances for care, both of which could influence patterns of readmission. In addition, although travel patterns are similar throughout the country, the burden of travel is certainly more substantial in some areas than others. In this study, this is most evident in the Southwest region of the United States, where travel distances for this small sample were five- to 10-fold greater than in other parts of the country. Consequently, there may be a differential impact of travel distance in the different regions of the country; however, further exploration of this was beyond the scope of the current study.
Travel distance impacts the patterns and burden of readmission after major cancer surgery. The negative impact of long patient travel distances does not seem to outweigh the benefits of having surgery at a high-volume center. However, travel distance needs to be acknowledged as a potential barrier to high-quality care. Future research into models of cancer care delivery should focus on interventions that can mitigate the negative consequences of patient travel. Multilevel interventions, targeted at higher risk patients, will be necessary to decrease the population burden of readmissions after cancer surgery on a large scale.
Glossary Terms
- Surveillance, Epidemiology, and End Results (SEER):
a national cancer registry that collects information from all incident malignancies in multiple geographic areas of the United States.
Appendix
Table A1.
Codes Used to Identify Extirpative Procedures
| Cancer Type | ICD-9 Procedure Code | HCPCS code |
|---|---|---|
| Bladder | 57.7 Total cystectomy 57.71 Radical cystectomy 57.79 Other total cystectomy |
51570 Removal of bladder 51575 Removal of bladder and nodes 51580 Removal of bladder/revise tract 51585 Removal of bladder and nodes 51590 Removal of bladder/revise tract 51595 Removal of bladder/revise tract 51596 Removal of bladder/create pouch 51597 Removal of pelvic structures |
| Lung | 32.4 Lobectomy of lung 32.41 Thoracoscopic lobectomy of lung 32.49 Other lobectomy of lung 32.5 Pneumonectomy 32.50 Thoracoscopic pneumonectomy 32.59 Other and unspecified pneumonectomy |
32440 Removal of lung 32442 Sleeve pneumonectomy 32445 Removal of lung 32480 Partial removal of lung 32482 Bilobectomy 32486 Sleeve lobectomy 32488 Completion pneumonectomy 32503 Resect apical lung tumor 32504 Resect apical lung tumor/chest 32663 Thoracoscopy surgical |
| Pancreas | 52.5 Partial pancreatectomy 52.51 Proximal pancreatectomy 52.52 Distal pancreatectomy 52.53 Radical subtotal pancreatectomy 52.59 Other partial pancreatectomy 52.6 Total pancreatectomy 52.7 Radical pancreaticoduodenectomy |
48140 Partial removal of pancreas 48145 Partial removal of pancreas 48146 Pancreatectomy 48148 Removal of pancreatic duct 48150 Partial removal of pancreas 48152 Pancreatectomy 48153 Pancreatectomy 48154 Pancreatectomy 48155 Removal of pancreas 48160 Pancreas removal/transplantation |
| Esophagus | 42.4 Excision of esophagus 42.40 Esophagectomy, not otherwise specified 42.41 Partial esophagectomy 42.42 Total esophagectomy 43.5 Partial gastrectomy with anastomosis to esophagus 43.99 Other total gastrectomy |
43107 Removal of esophagus 43108 Removal of esophagus 43112 Removal of esophagus 43113 Removal of esophagus 43116 Partial removal of esophagus 43117 Partial removal of esophagus 43118 Partial removal of esophagus 43121 Partial removal of esophagus 43122 Partial removal of esophagus 43123 Partial removal of esophagus 43124 Removal of esophagus |
Abbreviations: ICD-9, International Classification of Diseases, Ninth Revision; HCPCS, Healthcare Common Procedure Coding System.
Table A2.
Primary Admitting Diagnosis for Readmission
| Admitting Diagnosis | % of Patients |
|||||||
|---|---|---|---|---|---|---|---|---|
| Bladder |
Lung |
Pancreas |
Esophagus |
|||||
| 30-Day Readmission | 90-Day Readmission | 30-Day Readmission | 90-Day Readmission | 30-Day Readmission | 90-Day Readmission | 30-Day Readmission | 90-Day Readmission | |
| Volume depletion | 8.8 | 5.7 | 3.1 | 9.0 | 7.9 | 6.0 | 8.1 | |
| Dyspnea | 11.2 | 6.9 | 7.7 | 4.3 | ||||
| Abdominal pain | 5.3 | 4.7 | 9.3 | 8.2 | ||||
| Pneumonia | 8.4 | 6.4 | 3.5 | 9.3 | 7.0 | |||
| Urinary tract infection | 7.7 | 7.1 | ||||||
| Nausea and vomiting | 9.2 | 2.9 | 5.0 | 5.4 | ||||
| Fever | 6.8 | 5.8 | 4.8 | 3.5 | ||||
| Chest pain | 5.2 | 4.8 | 4.3 | |||||
| Atrial fibrillation/flutter | 2.9 | |||||||
| Postoperative infection | 8.1 | 4.7 | ||||||
| Intestinal obstruction | 5.3 | |||||||
| Congestive heart failure | 2.7 | 2.5 | ||||||
| Septicemia | 5.2 | |||||||
Table A3.
Outcomes of Readmitted Patients by Cancer Site
| Characteristic | Total (N = 7,904) |
Cancer Site |
||||||||
|---|---|---|---|---|---|---|---|---|---|---|
| Bladder (n = 2,030) |
Lung (n = 4,464) |
Pancreas (n = 923) |
Esophagus (n = 487) |
|||||||
| No. of Patients | % | No. of Patients | % | No. of Patients | % | No. of Patients | % | No. of Patients | % | |
| Total No. of readmissions within 90 days | ||||||||||
| Mean | 1.5 | 1.5 | 1.4 | 1.5 | 1.5 | |||||
| SD | 0.8 | 0.8 | 0.8 | 0.9 | 0.8 | |||||
| Median | 1 | 1 | 1 | 1 | 1 | |||||
| Q1 | 1 | 1 | 1 | 1 | 1 | |||||
| Q3 | 2 | 2 | 2 | 2 | 2 | |||||
| 1 | 5,362 | 68 | 1,284 | 63 | 3,170 | 71 | 595 | 64 | 313 | 64 |
| ≥ 2 | 2,542 | 32 | 746 | 37 | 1,294 | 29 | 328 | 36 | 174 | 36 |
| Time to readmission, days | ||||||||||
| Mean | 29.1 | 25.0 | 31.2 | 29.0 | 28.2 | |||||
| SD | 25.7 | 23.2 | 26.5 | 26.0 | 25.5 | |||||
| Median | 20 | 16 | 23 | 20 | 20 | |||||
| Q1 | 7 | 7 | 8 | 7 | 6 | |||||
| Q3 | 47 | 37 | 51 | 48 | 46 | |||||
| Readmission to index hospital | ||||||||||
| No | 2,606 | 33 | 615 | 30 | 1,510 | 34 | 314 | 34 | 167 | 34 |
| Yes | 5,298 | 67 | 1,415 | 70 | 2,954 | 66 | 609 | 66 | 320 | 66 |
| Length of stay, days | ||||||||||
| Mean | 14.5 | 14.4 | 12.5 | 18.9 | 25.1 | |||||
| SD | 13.3 | 10.9 | 11.5 | 14.4 | 23.7 | |||||
| Median | 10 | 11 | 9 | 15 | 17 | |||||
| Q1 | 8 | 9 | 7 | 10 | 12 | |||||
| Q3 | 16 | 16 | 14 | 22 | 29 | |||||
| Length of stay during first readmission, days | ||||||||||
| Mean | 8.7 | 8.7 | 8.3 | 9.4 | 10.9 | |||||
| SD | 9.8 | 10.2 | 9.3 | 10.1 | 12.2 | |||||
| Median | 6 | 6 | 6 | 6 | 7 | |||||
| Q1 | 4 | 4 | 4 | 4 | 4 | |||||
| Q3 | 10 | 10 | 9 | 11 | 13 | |||||
| Total length of stay within 90 days, including index admission, days | ||||||||||
| Mean | 27.0 | 27.8 | 23.9 | 32.6 | 40.9 | |||||
| SD | 21.3 | 19.9 | 19.3 | 21.7 | 32.5 | |||||
| Median | 21 | 22 | 18 | 27 | 30 | |||||
| Q1 | 14 | 16 | 12 | 18 | 20 | |||||
| Q3 | 32 | 32 | 28 | 39 | 52 | |||||
| Total readmission length of stay after index discharge, days | ||||||||||
| Mean | 12.5 | 13.4 | 11.4 | 13.8 | 15.8 | |||||
| SD | 14.1 | 15.1 | 13.2 | 14.2 | 16.9 | |||||
| Median | 8 | 9 | 7 | 9 | 10 | |||||
| Q1 | 4 | 5 | 4 | 5 | 5 | |||||
| Q3 | 15 | 16 | 14 | 18 | 20 | |||||
| No. of ER visits not resulting in readmission within 30 days | ||||||||||
| 0 | 6,776 | 86 | 1,755 | 86 | 3,866 | 87 | 767 | 83 | 388 | 80 |
| 1 | 1,128 | 14 | 275 | 14 | 598 | 13 | 156 | 17 | 99 | 20 |
| No. of ER visits not resulting in readmission within 90 days | ||||||||||
| Mean | 0.4 | 0.3 | 0.3 | 0.5 | 0.6 | |||||
| SD | 0.9 | 1.1 | 0.7 | 1.0 | 1.0 | |||||
| Median | 0 | 0 | 0 | 0 | 0 | |||||
| Q1 | 0 | 0 | 0 | 0 | 0 | |||||
| Q3 | 1 | 0 | 1 | 1 | 1 | |||||
| 0 | 5,856 | 74 | 1,555 | 77 | 3,347 | 75 | 635 | 69 | 319 | 66 |
| 1 | 2,048 | 26 | 475 | 23 | 1,117 | 25 | 288 | 31 | 168 | 34 |
| Distance to index hospital, miles | ||||||||||
| Mean | 48.2 | 53.1 | 44.4 | 53.2 | 53.2 | |||||
| SD | 177.0 | 163.3 | 187.0 | 178.6 | 127.3 | |||||
| Median | 11.3 | 13.8 | 10.1 | 12.8 | 17.2 | |||||
| Q1 | 4.8 | 5.4 | 4.2 | 5.5 | 5.9 | |||||
| Q3 | 32.4 | 39.8 | 26.8 | 37.3 | 46.5 | |||||
| < 15 | 4,531 | 57 | 1,055 | 52 | 2,752 | 62 | 495 | 54 | 229 | 47 |
| ≥ 15 | 3,358 | 42 | 971 | 48 | 1,701 | 38 | 428 | 46 | 258 | 53 |
| Distance to first readmission hospital, miles | ||||||||||
| Mean | 35.8 | 38.2 | 33.9 | 35.3 | 43.4 | |||||
| SD | 166.8 | 156.1 | 177.7 | 148.0 | 138.8 | |||||
| Median | 7.2 | 8.1 | 6.7 | 7.8 | 8.8 | |||||
| Q1 | 3.2 | 3.6 | 2.9 | 3.5 | 3.8 | |||||
| Q3 | 16.3 | 19.8 | 14.4 | 16.9 | 24.7 | |||||
| < 15 | 5,728 | 72 | 1,379 | 68 | 3,372 | 76 | 661 | 72 | 316 | 65 |
| ≥ 15 | 2,144 | 27 | 645 | 32 | 1,069 | 24 | 260 | 28 | 170 | 35 |
| Total costs within 90 days, US$ | ||||||||||
| Mean | 58,704.4 | 54,278.4 | 54,001.0 | 73,419.1 | 92,377.9 | |||||
| SD | 47,760.7 | 39,380.7 | 40,953.6 | 47,267.1 | 95,634.3 | |||||
| Median | 46,869.2 | 44,740.9 | 43,466.5 | 62,123.8 | 64,459.5 | |||||
| Q1 | 34,928.3 | 33,656.6 | 33,167.9 | 47,042.2 | 46,495.4 | |||||
| Q3 | 65,841.7 | 62,663.7 | 59,931.4 | 83,793.0 | 101,988.8 | |||||
| Discharge destination from index admission | ||||||||||
| Home | 5,944 | 75 | 1,531 | 75 | 3,431 | 77 | 662 | 72 | 320 | 66 |
| SNF | 1,532 | 19 | 412 | 20 | 791 | 18 | 212 | 23 | 117 | 24 |
| Other | 428 | 5 | 87 | 4 | 242 | 5 | 49 | 5 | 50 | 10 |
| Discharge destination from readmission | ||||||||||
| Home | 5,696 | 72 | 1,447 | 71 | 3,291 | 74 | 655 | 71 | 303 | 62 |
| SNF | 1,253 | 16 | 341 | 17 | 654 | 15 | 155 | 17 | 103 | 21 |
| Other | 940 | 12 | 240 | 12 | 509 | 11 | 111 | 12 | 80 | 16 |
| Time from surgery discharge to study end or death, months | ||||||||||
| Mean | 28.3 | 27.9 | 31.0 | 18.0 | 25.3 | |||||
| SD | 26.3 | 26.9 | 26.8 | 19.6 | 26.2 | |||||
| Median | 21 | 19 | 25 | 10 | 15 | |||||
| Q1 | 6 | 5 | 7 | 4 | 4 | |||||
| Q3 | 44 | 43 | 48 | 25 | 39 | |||||
Abbreviations: ER, emergency room; SD, standard deviation; SNF, skilled nursing facility; Q, quartile.
Fig A1.
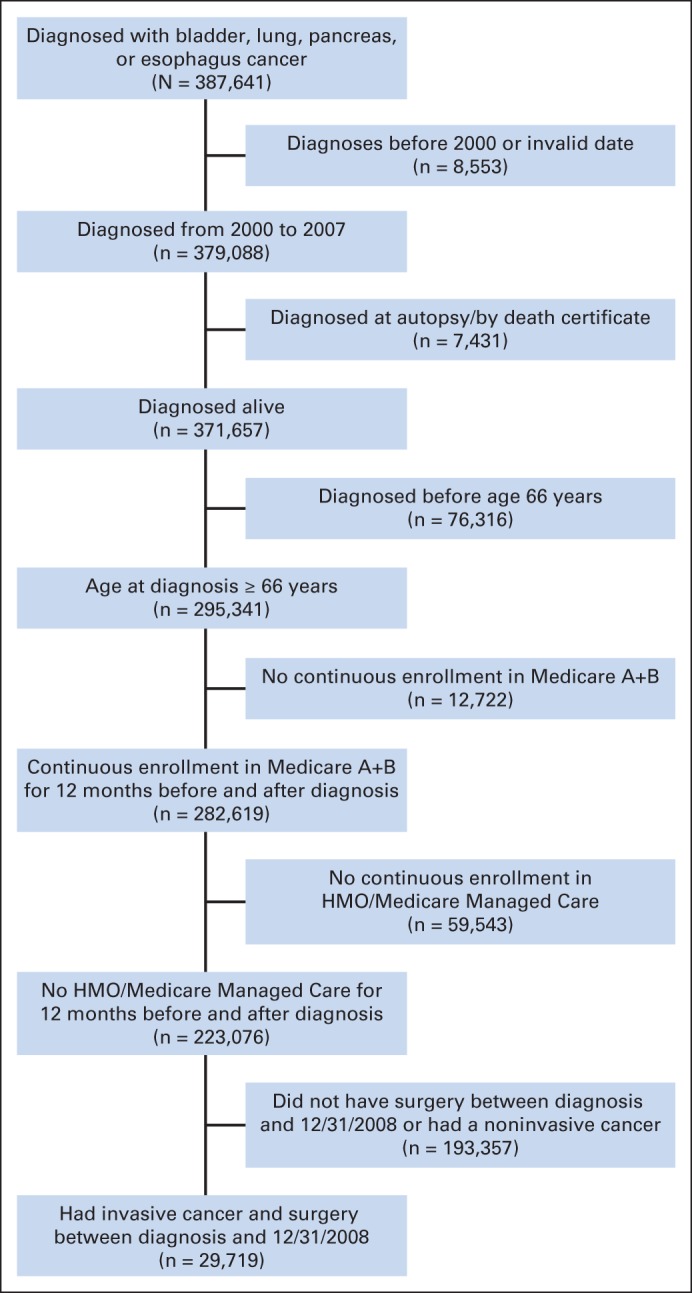
Patient cohort selection. HMO, health maintenance organization.
Footnotes
Supported by the Integrated Cancer Information and Surveillance System, University of North Carolina (UNC) Lineberger Comprehensive Cancer Center with funding provided by the University Cancer Research Fund via the state of North Carolina. K.B.S. is supported in part by the UNC IBM Junior Faculty Development Award. M.E.N. was supported in part by the American Cancer Society (Grant No. MRSG-13-154-01-CPPB) and the Urology Care Foundation/Astellas. A.B.S. was supported in part by the National Center for Research Resources and the National Center for Advancing Translational Sciences, National Institutes of Health, through Grant No. KL2TR000084.
Terms in blue are defined in the glossary, found at the end of this article and online at www.jco.org.
Authors' disclosures of potential conflicts of interest are found in the article online at www.jco.org. Author contributions are found at the end of this article.
AUTHORS' DISCLOSURES OF POTENTIAL CONFLICTS OF INTEREST
Disclosures provided by the authors are available with this article at www.jco.org.
AUTHOR CONTRIBUTIONS
Conception and design: Karyn B. Stitzenberg
Collection and assembly of data: YunKyung Chang
Data analysis and interpretation: All authors
Manuscript writing: All authors
Final approval of manuscript: All authors
AUTHORS' DISCLOSURES OF POTENTIAL CONFLICTS OF INTEREST
Exploring the Burden of Inpatient Readmissions After Major Cancer Surgery
The following represents disclosure information provided by authors of this manuscript. All relationships are considered compensated. Relationships are self-held unless noted. I = Immediate Family Member, Inst = My Institution. Relationships may not relate to the subject matter of this manuscript. For more information about ASCO's conflict of interest policy, please refer to www.asco.org/rwc or jco.ascopubs.org/site/ifc.
Karyn B. Stitzenberg
No relationship to disclose
YunKyung Chang
No relationship to disclose
Angela B. Smith
No relationship to disclose
Matthew E. Nielsen
No relationship to disclose
REFERENCES
- 1.Stitzenberg KB, Sigurdson ER, Egleston BL, et al. Centralization of cancer surgery: Implications for patient access to optimal care. J Clin Oncol. 2009;27:4671–4678. doi: 10.1200/JCO.2008.20.1715. [DOI] [PMC free article] [PubMed] [Google Scholar]
- 2.Donat SM, Shabsigh A, Savage C, et al. Potential impact of postoperative early complications on the timing of adjuvant chemotherapy in patients undergoing radical cystectomy: A high-volume tertiary cancer center experience. Eur Urol. 2009;55:177–185. doi: 10.1016/j.eururo.2008.07.018. [DOI] [PubMed] [Google Scholar]
- 3.Greenblatt DY, Weber SM, O'Connor ES, et al. Readmission after colectomy for cancer predicts one-year mortality. Ann Surg. 2010;251:659–669. doi: 10.1097/SLA.0b013e3181d3d27c. [DOI] [PMC free article] [PubMed] [Google Scholar]
- 4.Yermilov I, Bentrem D, Sekeris E, et al. Readmissions following pancreaticoduodenectomy for pancreas cancer: A population-based appraisal. Ann Surg Oncol. 2009;16:554–561. doi: 10.1245/s10434-008-0178-6. [DOI] [PubMed] [Google Scholar]
- 5.Reddy DM, Townsend CM, Jr, Kuo YF, et al. Readmission after pancreatectomy for pancreatic cancer in Medicare patients. J Gastrointest Surg. 2009;13:1963–1974. doi: 10.1007/s11605-009-1006-4. [DOI] [PMC free article] [PubMed] [Google Scholar]
- 6.Emick DM, Riall TS, Cameron JL, et al. Hospital readmission after pancreaticoduodenectomy. J Gastrointest Surg. 2006;10:1243–1252. doi: 10.1016/j.gassur.2006.08.016. [DOI] [PubMed] [Google Scholar]
- 7.Stimson CJ, Chang SS, Barocas DA, et al. Early and late perioperative outcomes following radical cystectomy: 90-day readmissions, morbidity and mortality in a contemporary series. J Urol. 2010;184:1296–1300. doi: 10.1016/j.juro.2010.06.007. [DOI] [PubMed] [Google Scholar]
- 8.Goodney PP, Stukel TA, Lucas FL, et al. Hospital volume, length of stay, and readmission rates in high-risk surgery. Ann Surg. 2003;238:161–167. doi: 10.1097/01.SLA.0000081094.66659.c3. [DOI] [PMC free article] [PubMed] [Google Scholar]
- 9.Ahmad SA, Edwards MJ, Sutton JM, et al. Factors influencing readmission after pancreaticoduodenectomy: A multi-institutional study of 1302 patients. Ann Surg. 2012;256:529–537. doi: 10.1097/SLA.0b013e318265ef0b. [DOI] [PubMed] [Google Scholar]
- 10.Badgwell B, Stanley J, Chang GJ, et al. Comprehensive geriatric assessment of risk factors associated with adverse outcomes and resource utilization in cancer patients undergoing abdominal surgery. J Surg Oncol. 2013;108:182–186. doi: 10.1002/jso.23369. [DOI] [PubMed] [Google Scholar]
- 11.Barbas AS, Turley RS, Mallipeddi MK, et al. Examining reoperation and readmission after hepatic surgery. J Am Coll Surg. 2013;216:915–923. doi: 10.1016/j.jamcollsurg.2013.01.008. [DOI] [PubMed] [Google Scholar]
- 12.Clark RM, Growdon WB, Wiechert A, et al. Patient, treatment and discharge factors associated with hospital readmission within 30 days after surgical cytoreduction for epithelial ovarian carcinoma. Gynecol Oncol. 2013;130:407–410. doi: 10.1016/j.ygyno.2013.05.034. [DOI] [PubMed] [Google Scholar]
- 13.Fauci JM, Schneider KE, Frederick PJ, et al. Assessment of risk factors for 30-day hospital readmission after surgical cytoreduction in epithelial ovarian carcinoma. Int J Gynecol Cancer. 2011;21:806–810. doi: 10.1097/IGC.0b013e3182157a19. [DOI] [PubMed] [Google Scholar]
- 14.Freeman RK, Dilts JR, Ascioti AJ, et al. A comparison of length of stay, readmission rate, and facility reimbursement after lobectomy of the lung. Ann Thorac Surg. 2013;96:1740–1745. doi: 10.1016/j.athoracsur.2013.06.053. [DOI] [PubMed] [Google Scholar]
- 15.Grewal SS, McClaine RJ, Schmulewitz N, et al. Factors associated with recidivism following pancreaticoduodenectomy. HPB (Oxford) 2011;13:869–875. doi: 10.1111/j.1477-2574.2011.00377.x. [DOI] [PMC free article] [PubMed] [Google Scholar]
- 16.Hendren S, Morris AM, Zhang W, et al. Early discharge and hospital readmission after colectomy for cancer. Dis Colon Rectum. 2011;54:1362–1367. doi: 10.1097/DCR.0b013e31822b72d3. [DOI] [PubMed] [Google Scholar]
- 17.Hu M, Jacobs BL, Montgomery JS, et al. Sharpening the focus on causes and timing of readmission after radical cystectomy for bladder cancer. Cancer. 2014;120:1409–1416. doi: 10.1002/cncr.28586. [DOI] [PubMed] [Google Scholar]
- 18.Hyder O, Dodson RM, Nathan H, et al. Influence of patient, physician, and hospital factors on 30-day readmission following pancreatoduodenectomy in the United States. JAMA Surg. 2013;148:1095–1102. doi: 10.1001/jamasurg.2013.2509. [DOI] [PMC free article] [PubMed] [Google Scholar]
- 19.Kim YD, Kim MC, Kim KH, et al. Readmissions following elective radical total gastrectomy for early gastric cancer: A case-controlled study. Int J Surg. 2014;12:200–204. doi: 10.1016/j.ijsu.2013.12.010. [DOI] [PubMed] [Google Scholar]
- 20.Liang MI, Rosen MA, Rath KS, et al. Reducing readmissions after robotic surgical management of endometrial cancer: A potential for improved quality care. Gynecol Oncol. 2013;131:508–511. doi: 10.1016/j.ygyno.2013.09.033. [DOI] [PubMed] [Google Scholar]
- 21.Schneider EB, Hyder O, Brooke BS, et al. Patient readmission and mortality after colorectal surgery for colon cancer: Impact of length of stay relative to other clinical factors. J Am Coll Surg. 2012;214:390–398. doi: 10.1016/j.jamcollsurg.2011.12.025. [DOI] [PubMed] [Google Scholar]
- 22.Schneider EB, Hyder O, Wolfgang CL, et al. Patient readmission and mortality after surgery for hepato-pancreato-biliary malignancies. J Am Coll Surg. 2012;215:607–615. doi: 10.1016/j.jamcollsurg.2012.07.007. [DOI] [PMC free article] [PubMed] [Google Scholar]
- 23.McDevitt J, Kelly M, Comber H, et al. A population-based study of hospital length of stay and emergency readmission following surgery for non-small-cell lung cancer. Eur J Cardiothorac Surg. 2013;44:e253–e259. doi: 10.1093/ejcts/ezt389. [DOI] [PMC free article] [PubMed] [Google Scholar]
- 24.Clarke CN, Sussman JJ, Abbott DE, et al. Factors affecting readmission after pancreaticoduodenectomy. Adv Surg. 2013;47:99–110. doi: 10.1016/j.yasu.2013.02.006. [DOI] [PubMed] [Google Scholar]
- 25.Tsai TC, Joynt KE, Orav EJ, et al. Variation in surgical-readmission rates and quality of hospital care. N Engl J Med. 2013;369:1134–1142. doi: 10.1056/NEJMsa1303118. [DOI] [PMC free article] [PubMed] [Google Scholar]
- 26.Fortney J, Rost K, Warren J. Comparing alternative methods of measuring geographic access to health services. Health Serv Res Outcomes Method. 2000;1:173–184. [Google Scholar]
- 27.Haynes R, Jones A, Sauerzapf V, et al. Validation of travel times to hospital estimated by GIS. Int J Health Geogr. 2006;5:40. doi: 10.1186/1476-072X-5-40. [DOI] [PMC free article] [PubMed] [Google Scholar]
- 28.Lawson EH, Louie R, Zingmond DS, et al. A comparison of clinical registry versus administrative claims data for reporting of 30-day surgical complications. Ann Surg. 2012;256:973–981. doi: 10.1097/SLA.0b013e31826b4c4f. [DOI] [PubMed] [Google Scholar]