

Abstract
Objective
To investigate whether acute total sleep deprivation (TSD) leads to decreased cognitive control when food cues are presented during a task requiring active attention, by assessing the ability to cognitively inhibit prepotent responses.
Methods
Fourteen males participated in the study on two separate occasions in a randomized, crossover within-subject design: one night of TSD versus normal sleep (8.5 hours). Following each nighttime intervention, hunger ratings and morning fasting plasma glucose concentrations were assessed before performing a go/no-go task.
Results
Following TSD, participants made significantly more commission errors when they were presented “no-go” food words in the go/no-go task, as compared with their performance following sleep (+56%; P<0.05). In contrast, response time and omission errors to “go” non-food words did not differ between the conditions. Self-reported hunger after TSD was increased without changes in fasting plasma glucose. The increase in hunger did not correlate with the TSD-induced commission errors.
Conclusions
Our results suggest that TSD impairs cognitive control also in response to food stimuli in healthy young men. Whether such loss of inhibition or impulsiveness is food cue-specific as seen in obesity—thus providing a mechanism through which sleep disturbances may promote obesity development—warrants further investigation.
Keywords: acute total sleep deprivation, cognitive control, food intake, impulsive, inhibition, selective attention, shift work
Introduction
A globally widespread decrease in habitual sleep length and the percentage of people reporting sleeping enough has paralleled an increase in obesity prevalence during the last 3–4 decades. Today, more than 50% of inhabitants in countries such as the USA, the UK and Germany report obtaining insufficient amounts of sleep during working days 1. At the same time, more than 500 million people are currently obese 2. Epidemiological evidence supports a link between sleep duration and obesity 3, and insufficient sleep has been linked to cognitive and metabolic mechanisms promoting weight gain (4–8).
At the cognitive level, acute loss of sleep has been found to decrease activity in prefrontal brain regions 9,10, areas that are responsible for cognitive inhibition and which also show reduced activity in those that are afflicted by obesity 11, although there is also evidence to the contrary 12. Previous studies have found that both acute sleep deprivation and obesity reduce the ability to inhibit prepotent responses (13–15) —that is, obese as well as sleep-deprived humans exhibit impulsive-like behavior—and that this decline is correlated with reduced activity in the right ventral prefrontal cortex in the setting of sleep deprivation 13. Sleepiness has also been related to the prefrontal regulation of eating behavior, with similar involvement of the aforementioned prefrontal brain region 16. Furthermore, impulsivity has been found to be a defining trait of obese subjects (17–19).
Even though these separate lines of evidence exist for these two inter-related phenomena, no study has so far examined whether acute sleep deprivation reduces the ability to inhibit prepotent responses upon presentation of food-related stimuli. Against this background, the aim of this study was to determine if sleep deprivation also alters the ability to withhold impulsive responses to food stimuli in healthy young men. As especially effortful executive tasks have been linked to changes in glucose availability 20, we also analyzed fasting glucose values to examine whether this may account for any observed effects following acute sleep deprivation. Given that sleep deprivation has been shown to decrease the activity of brain regions counteracting impulsive responses to food stimuli (e.g. the right anterior cingulate cortex) 10 and impairs humans' ability to suppress a prepotent response to non-food stimuli 13,14, in the present study it was hypothesized that one night of total sleep deprivation (TSD) would reduce the ability to exert cognitive inhibition in response to food-related stimuli.
Methods
Participants
Out of 15 male student participants taking part in both session of the study, 14 were eligible for analysis (age 22.3 ± 0.5 years; BMI 22.4 ± 0.5 kg/m2; 12 were right-handed; two left-handed). One subject had improperly recorded data from the go/no-go task. Thus, this participant was not considered eligible for the present analysis. All participants were non-smokers, of self-reported good health, and had normal sleeping habits (7–9 hours of sleep/night; Pittsburgh Sleep Quality Index score ≤5) 21. None of the participants had any physical, neurological, or psychiatric diseases and all were free of chronic medication. All participants gave written informed consent, following which they were screened by a medical doctor (J.C.) who also assessed health and sleep questionnaires and recorded anthropomorphic data. Participants also completed one-week-long pre-study diaries detailing their sleep and eating habits as part of the screening for participation in the study. Similar diaries were also completed prior to each of the two study sessions. The presence of sleep disturbances was further excluded by EEG monitoring in a separate adaptation night that served to habituate subjects to the experimental setting. The study was conducted in accordance with the Helsinki Declaration and was approved by the Regional Ethical Review Board in Uppsala (EPN 2012/477). Participants were financially reimbursed for their participation in the study, which is registered on ClinicalTrials.gov, number NCT01800253.
Study design and procedure
The experiment described herein was a component of a larger study investigating sleep deprivation in relation to metabolism in peripheral organs. Importantly, these metabolic measures were collected after the go/no-go task was completed. All participants described herein partook in two conditions (Sleep vs. TSD) of a within-subject, randomized crossover study, in which each condition was separated by at least 4 weeks. For each condition, participants came to the lab two evenings before the experimental morning, and stayed in the lab until the experiments were conducted. During this baseline period, participants were provided with a dinner, and slept the first night between 2230 and 0700 h. This was followed by breakfast, lunch and dinner, with each meal providing 1/3 of each participant's calculated daily energy requirement (based on the Harris–Benedict equation, factored 1.2 for light physical activity). Two 15-min supervised walks were scheduled during the day and participants were otherwise free to engage in activities in their rooms under sedentary conditions. Participants were blinded to the experimental condition (i.e. Sleep vs. TSD) until being informed of the respective condition 90 minutes in advance of intervention onset. As illustrated (Figure 1), the nighttime intervention spanned 2230 to 0700 h (Sleep or TSD). Lights were off 2230-0700 h in the sleep condition, during which Embla A10 recorders (Flaga hf, Reykjavik, Iceland) were used to monitor sleep [with electroencephalography (EEG), electrooculography (EOG), and electromyography (EMG)]. Standard criteria were used by a scorer blinded to the hypothesis of the study to assess sleep stages (J-E.B.) 22. In the TSD condition, participants were supervised to ensure wakefulness and sedentary activity levels, and no food items were provided. In the morning following each sleep intervention, hunger was rated, at 0700 and 0800 h. In addition, the participants' fasting plasma glucose was analyzed at 0730 h. Following these assessments, the go/no-go task was performed at 0815 h.
Figure 1.
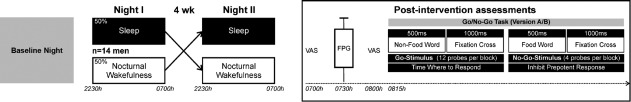
Experimental scheme. In a randomized crossover design, participants took part in two sessions, comprising normal sleep and nocturnal wakefulness as the nighttime intervention (2230-0700 h; left panel). The sessions were separated by at least four weeks, and each session also comprised a baseline night and day. In the morning following each intervention, hunger was rated with visual analog scales (VAS) at 0700 and 0800 h, and fasting plasma glucose (FPG) values were obtained at 0730 h (right panel). Following these assessments, participants performed the go/no-go task. The task consisted of 10 blocks that alternated between non-food (Go-Stimuli, 12 probes per block) and food words (No-Go Stimuli, 4 probes per block). Of the 12 Go probes per block, a non-food word from each of the 12 categories was used. For the four No-Go probes per block, these alternated between blocks between either healthy food words (odd blocks) or unhealthy food words (even blocks). The Go and No-Go stimuli were presented for 500 ms, followed by a fixation cross for 1000 ms. Subjects were instructed to press a predefined button when Go stimuli were presented, and to inhibit their prepotent response upon presentation of No-Go stimuli. The task was given in two matched versions (A/B), in a counterbalanced order, and the number of commission and omission errors as well as the response times were recorded. Abbreviations: ms, milliseconds; wk, weeks.
Go/no-go task
To assess the ability to inhibit prepotent responses, a go/no-go association task with food and non-food words was used 23. This task has previously been linked to inhibition and activation of cortical brain regions associated with cognitive control 24,25 and has been linked to maladaptive eating behaviors, although there is also evidence to the contrary 26. Non-food and food-related words represented go and no-go trials, respectively, and each word was presented for 500 ms. Food word occurrence constituted a quarter of the total words in the task and these words represented food items whose consumption—as indicated by Likert scales—was either considered as healthy (e.g. apple) or unhealthy (e.g. chocolate) with respect to body weight, by young men and women in a survey preceding the present study (data not shown). Importantly, these subjects were of similar age (between 20 and 30 yrs) and body weight (20 < BMI < 25 kg/m2) as the participants of the main study. Non-food words were selected from 12 different categories, such as clothing, office items, and music instruments. Each of the 10 blocks in the task contained 16 words, with 1 non-food word from each of the 12 categories and 4 food words, which between blocks alternated between either healthy foods (odd blocks) or unhealthy foods (even blocks). The words for healthy and unhealthy food items are described in Supporting Information (Table S1). Each trial (appearance of a word) was followed by a fixation cross that appeared for 1000 ms. Subjects were instructed to use their dominant hand to press a predefined keyboard button when words not related to food appeared on the screen, but to withhold their responses upon presentation of food-related words. They were further instructed that the task was about both accuracy and speed, and that they should only press after having perceived the whole word. Response times were measured from the start of the word presentation, and were analyzed for correct trials and errors of commission and omission made (both expressed as percentage of total possible errors) 26. Participants were monitored throughout the task to ensure full attention in both conditions. Two versions of the task were used in a randomized counterbalanced crossover manner, with half of the participants starting with version A and half starting with version B in their first experimental session, and vice versa in the second experimental session. Each version (A/B) was matched for individual word content and presentation order of food and non-food items. The task utilized the Presentation software package (Version 9, Neurobehavioral Systems, Davis, CA) for laptop-based visual task presentation.
Biochemical analyses
Plasma glucose analysis was carried out on a chemistry analyzer (Architect C16000, Abbott Laboratories).
Data analysis
Normal-distribution criteria of collected data were assessed with Kolmogorov-Smirnov's test of normality. As all variables were found to be normally distributed, repeated measures analysis of variance (ANOVA; Within-Subject factor: Sleep; plus Time for the hunger variable; plus food category for the go/no-go parameters commission errors and response time to no-go food stimuli) was used to analyze the data. The investigated parameters related to the performance on the go/no-go task (commission errors, omission errors, response time) reflect different cognitive processes (commission errors representing conflict-monitoring processes; omission errors and response time instead reflecting active attention). Thus, no correction for multiple comparisons was done. Previous TSD studies have shown increased hunger ratings 4,7,27 as well as impaired decision making in response to food stimuli and decreased alertness under conditions of TSD 6,28,29. Further, previous experiments has shown that participants kept awake for one to two nights perform worse on a go/no-go task using non-food paradigms 13,14. Thus, planned contrasts were used for comparisons of hunger and performance on the go/no-go task between the sleep and TSD conditions. In contrast, when analyzing fasting plasma levels of glucose, no planned contrasts were used, as previous studies have not reported differences for this variable between sleep and TSD 4,9,30. Pearsons's correlation analysis of individual ratios between conditions (i.e. TSD divided by Sleep) was calculated to detect associations between TSD-induced changes in hunger and the number of commission errors. All data analysis was done using the SPSS software (Version 21, SPSS Inc., Chicago, IL) and P-values below 0.05 were considered significant. Data are presented as means ± SEM.
Results
Go/no-go task and hunger ratings following sleep interventions
For the go/no-go task, the number of commission errors—defined when the participant failed to inhibit their prepotent response to food stimuli—was significantly higher following TSD than following normal sleep (25.4 ± 5.6 vs. 16.3 ± 4.1% of total food words; P = 0.03 for the Sleep main effect, Figure 2). There was no interaction between the sleep intervention and the interaction term food category (healthy- vs. unhealthy food stimuli, P = 0.16). The number of omission errors—defined when the participant failed to respond to non-food stimuli—was not significantly different between the two conditions (1.73 ± 0.52 vs. 1.07 ± 0.52% of total non-food words; P = 0.17 for the Sleep main effect). The average response time (i.e. time from stimulus presentation to pressing the button) was not significantly different between the two conditions, even when comparing go (610 ± 39 vs. 623 ± 38 ms; P = 0.32 for the Sleep main effect) and no-go responses (642 ± 61 vs. 605 ± 51 ms; P = 0.22 for the Sleep main effect; P = 0.91 for the Sleep × food category interaction effect).
Figure 2.
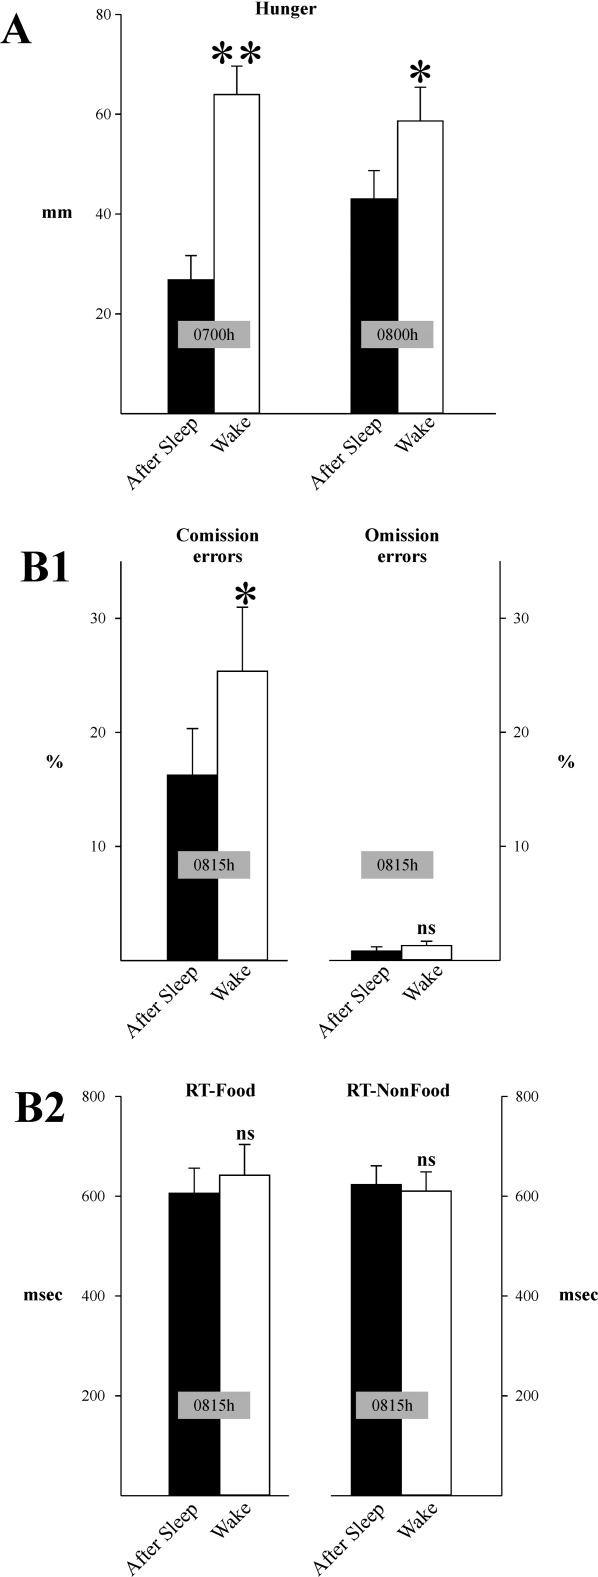
Results from the go/no-go task. Hunger (rated at 0700 and 0800 h) (A) and the rate of commission errors (B1; left panel) was significantly higher following the wake condition (total sleep deprivation) than after sleep. In contrast, the rate of omission errors (B1; right panel) and the response time to food and non-food words (B2) were not significantly different between the conditions. Abbreviations: *P < 0.05; **P < 0.01; msec, milliseconds; ns, not significant; RT, response time.
Hunger ratings were significantly different between the two conditions, with subjects displaying higher hunger at both 0700 and 0800 h following TSD vs. Sleep (63 ± 6 vs. 27 ± 5 mm at 0700 h; 59 ± 7 vs. 43 ± 6 mm at 0800 h, P < 0.001 for the Sleep main effect, P < 0.004 for the Sleep × Time interaction). There were however no significant correlations between the ratio of hunger ratings at 0800 h—the rating closest to the go/no-go task—and the ratio of commission errors (r = –0.10, P = 0.72).
Glucose values
There were no significant differences between the conditions TSD and sleep in glucose values (5.2 ± 0.1 vs. 5.4 ± 0.1 mmol/l; P = 0.14 for the Sleep main effect) at 0730 h on the morning of the go/no-go task.
Sleep data
Sleep during the intervention night of the sleep condition was typical for laboratory sleep. Participants' sleep data were as follows: total sleep time: 484 ± 3 min; time awake after sleep onset: 19 ± 3 min; latency to sleep-onset was 25 ± 3 min; sleep efficiency was 96.1 ± 0.5%. Time in sleep stage 1: 11 ± 3 min; sleep stage 2: 229 ± 6 min; slow-wave sleep (SWS): 104 ± 8 min; rapid eye movement (REM) sleep: 121 ± 6 min. Baseline period sleep recordings had similar characteristics and did not differ between the two conditions (data not shown).
Discussion
Sleep-deprived healthy young men were more likely to make commission errors in a go/no-go task. As this task requires participants to pay active attention to avoid prepotent answers when food-related words are presented, our findings therefore suggest that acute sleep loss in normal-weight men reduces the ability to exert cognitive inhibition toward food stimuli. Importantly, no differences were seen in the rate of omission errors or response times for food (no-go) and non-food related (go) stimuli, which reinforces the notion that the observed differences were not due to differences in participants' motivational state or active attention to the task. Impaired performance on this task has previously been found in obese versus normal-weight subjects 15. Based on previous studies showing that sleep deprivation and restriction predispose individuals to gain weight 4,5,16,31,32, as well as make poor choices specifically in relation to food exposure 6,7,33, our findings provide an additional potential cognitive mechanism for such associations. Importantly, a version with non-food related words as no-go stimuli was not utilized in the present study. However, others have shown that sleep loss also lowers inhibitory capacity to non-food stimuli in humans 13,14. Thus, it must be borne in mind that our study findings might be elicited by a generally, and not food-specific, lower inhibitory capacity following sleep loss.
Impulsivity as a trait—measured by self-reported assessments and a behavioral task—has been linked to increased food intake even in subjects of normal weight 17. Sleep deprivation has not only been linked to increased feelings of hunger 5,7,27, but also to increased portion sizes and food purchasing 6,7. The latter could serve as a proxy for increased impulsive-like or riskier behavior following sleep loss, especially in light of other findings of altered and increased risk behavior following TSD 28. Together with increased sensitivity toward reward-generating food stimuli as a consequence of sleep loss 8–10, even a general increase in impulsive-like behavior could be of relevance for increasing the risk of making poor food choices following sleep loss, via reduced “top-down” or inhibitory control 6,20. Accordingly, a meta-analysis on obese vs. lean subjects and other findings examining the go/no-go task, would argue for an increased cognitive demand to achieve successful inhibition in both obesity and perhaps following sleep loss 12,24. With this line of reasoning, in the setting of sleep deprivation, whether acute or chronic, individuals may exhibit more impulsive-like behavior, seeking out more high-calorie rewarding foods to consume directly 7, or purchase more calories for later consumption 6. Coupled with decreased energy expenditure by sleep deprivation in and of itself 4, such behaviors may ultimately result in a shift in energy balance that leads to an increased risk of becoming obese.
Several studies have shown that obese subjects show impaired inhibition, as compared with healthy-weight subjects 17–19. In a prospective study of obese women performing a task examining executive functions, decreased activity in frontal regions was linked to an increased rate of weight gain over a 1.3-2.9-year period 34. Interestingly, studies have also shown that obese subjects exhibit selective attentional bias toward food-related stimuli 35–37. Yokum et al. found that BMI correlated positively with response time to food vs. non-food related images in adolescent girls ranging from lean to obese 36. Sleep deprivation may therefore induce an obesity-like behavioral phenotype. In this scenario, attentional bias to food stimuli in sleep-deprived participants would make them respond more (albeit inaccurately) to no-go food stimuli, which in combination with lower executive functioning would impair their cognitive inhibitory capacity, leading to an increase in commission errors. Adding further grist to the mill, studies utilizing functional magnetic resonance imaging (fMRI) have found that sleep loss alters the activity of frontal lobe brain regions that play an important role for response inhibition in humans 9,10,13. To which extent such changes may contribute to the observed reduced inhibitory capacity in response to food cues warrants further investigation.
The increased rate of commission errors in sleep-deprived subjects upon exposure to food-related words could also potentially be related to the availability of systemic glucose for the brain. Especially effortful executive tasks have been linked to changes in glucose availability 20. No differences in blood glucose levels were however found in fasting blood samples from the participants. It should however be noted that a reduced glucose sensitivity can also impair performance on executive tasks 20. As previous studies have shown that sleep deprivation—even just a single night—reduces systemic insulin sensitivity, this explanation can therefore not be ruled out 31.
Strengths and limitations
A strength of our findings was that while we observed an increased rate of commission errors, there were no significant differences in the rate of omission errors or the response time to the go and no-go blocks of our go/no-go task, suggesting that differences in the performance on the task were not due to differences in the motivational state between the two tested conditions. Nevertheless, our study has several limitations. Participants were sleep-deprived for an entire night, which is more similar to the experience of shift workers, which nevertheless constitute up to 20% of today's workforce 38,39. We did furthermore not contrast the go/no-go paradigm with one without food-related stimuli as no-go trials; and studies have indicated that both obese and normal-weight people may show differences when these opposing paradigms are used 40. However, other studies have shown that sleep deprivation can even impair response inhibition to simple letters or symbols 13,14. The effects of sleep deprivation on cognitive inhibitory control was not specific toward the food category, as observed, for example, in obese vs. healthy subjects 15. Possible explanations for this could be the sample size or a possible mismatch for the chosen food words, which were divided into the categories “healthy” and “unhealthy” food items, rather than e.g. low- and high-calorie food items, respectively. Individual food preferences, which were not tested, could also have played a role. Furthermore, as we did not test the participants' food choice and food intake following the go/no-go task, we cannot make inferences as to what extent their enhanced impulsive-like response to food stimuli would predispose them to poor food choices.
Conclusions
Our study extends previous findings of reduced inhibitory capacity in sleep-deprived subjects 13,14 to also include reduced inhibitory control in response to food-related stimuli. The present findings thereby add further evidence to the involvement of higher cognitive functions in the previously found associations between sleep loss and increased food intake. In the setting of chronically insufficient sleep, such impaired cognitive inhibition or attentional bias to food stimuli may thereby in the long run predispose even healthy young individuals to gain weight. While this study provides evidence that sleep-deprived men show impulsive-like behavior when viewing food-related stimuli, an important next step is to verify in an fMRI-setting, whether this effect is driven by an increased bottom-up response, decreased or impaired cognitive control, or both. Finally, whether these findings extend to other conditions, such as postprandially, under partial sleep deprivation or chronically poor sleep habits, or in females or older participants, is currently unknown and would be worth investigating.
Acknowledgments
We would like to thank all participants, and Nataly Perez, Victor Nilsson and Erasmus Cedernaes for their help in carrying out the study. The study was supported by the Swedish Brain Foundation, the Novo Nordisk Foundation, the Åke Wiberg Foundation, the Swedish Society for Sleep Research and Sleep Medicine, the Swedish Research Council and NWO Rubicon. Dr. Cedernaes is the recipient of a grant from the Swedish Brain Foundation. He has neither any relevant affiliation nor financial involvement with the Swedish Brain Foundation. The funders had no role in study design, data collection and analysis, or preparation of the manuscript. The authors declare no conflict of interest.
Additional Supporting Information may be found in the online version of this article.
References
- National Sleep Foundation. 2013. 2013 International Bedroom Poll http://www.sleepfoundation.org/: National Sleep Foundation.
- Finucane MM, Stevens GA, Cowan MJ, Danaei G, Lin JK, Paciorek CJ, et al. National, regional, and global trends in body-mass index since 1980: systematic analysis of health examination surveys and epidemiological studies with 960 country-years and 9.1 million participants. Lancet. 2011;377(9765):557–567. doi: 10.1016/S0140-6736(10)62037-5. [DOI] [PMC free article] [PubMed] [Google Scholar]
- Cappuccio FP, Taggart FM, Kandala NB, Currie A, Peile E, Stranges S, et al. Meta-analysis of short sleep duration and obesity in children and adults. Sleep. 2008;31(5):619–626. doi: 10.1093/sleep/31.5.619. [DOI] [PMC free article] [PubMed] [Google Scholar]
- Benedict C, Hallschmid M, Lassen A, Mahnke C, Schultes B, Schioth HB, et al. Acute sleep deprivation reduces energy expenditure in healthy men. Am J Clin Nutr. 2011;93(6):1229–1236. doi: 10.3945/ajcn.110.006460. [DOI] [PubMed] [Google Scholar]
- Spiegel K, Tasali E, Penev P, Van Cauter E. Brief communication: sleep curtailment in healthy young men is associated with decreased leptin levels, elevated ghrelin levels, and increased hunger and appetite. Ann Intern Med. 2004;141(11):846–850. doi: 10.7326/0003-4819-141-11-200412070-00008. [DOI] [PubMed] [Google Scholar]
- Chapman CD, Nilsson EK, Nilsson VC, Cedernaes J, Rangtell FH, Vogel H, et al. Acute sleep deprivation increases food purchasing in men. Obesity. 2013;21(12):E555–E560. doi: 10.1002/oby.20579. [DOI] [PubMed] [Google Scholar]
- Hogenkamp PS, Nilsson E, Nilsson VC, Chapman CD, Vogel H, Lundberg LS, et al. Acute sleep deprivation increases portion size and affects food choice in young men. Psychoneuroendocrinology. 2013;38(9):1668–1674. doi: 10.1016/j.psyneuen.2013.01.012. [DOI] [PubMed] [Google Scholar]
- St-Onge MP, McReynolds A, Trivedi ZB, Roberts AL, Sy M, Hirsch J. Sleep restriction leads to increased activation of brain regions sensitive to food stimuli. Am J Clin Nutr. 2012;95(4):818–824. doi: 10.3945/ajcn.111.027383. [DOI] [PMC free article] [PubMed] [Google Scholar]
- Benedict C, Brooks SJ, O'Daly OG, Almen MS, Morell A, Aberg K, et al. Acute sleep deprivation enhances the brain's response to hedonic food stimuli: an fMRI study. J Clin Endocrinol Metab. 2012;97(3):E443–E447. doi: 10.1210/jc.2011-2759. [DOI] [PubMed] [Google Scholar]
- Greer SM, Goldstein AN, Walker MP. The impact of sleep deprivation on food desire in the human brain. Nat Commun. 2013;4:2259. doi: 10.1038/ncomms3259. [DOI] [PMC free article] [PubMed] [Google Scholar]
- Volkow ND, Wang GJ, Telang F, Fowler JS, Thanos PK, Logan J, et al. Low dopamine striatal D2 receptors are associated with prefrontal metabolism in obese subjects: possible contributing factors. NeuroImage. 2008;42(4):1537–1543. doi: 10.1016/j.neuroimage.2008.06.002. [DOI] [PMC free article] [PubMed] [Google Scholar]
- Brooks SJ, Cedernaes J, Schioth HB. Increased prefrontal and parahippocampal activation with reduced dorsolateral prefrontal and insular cortex activation to food images in obesity: a meta-analysis of fMRI studies. PloS one. 2013;8(4):e60393. doi: 10.1371/journal.pone.0060393. [DOI] [PMC free article] [PubMed] [Google Scholar]
- Chuah YM, Venkatraman V, Dinges DF, Chee MW. The neural basis of interindividual variability in inhibitory efficiency after sleep deprivation. J Neurosci: Offic J Soc Neurosci. 2006;26(27):7156–7162. doi: 10.1523/JNEUROSCI.0906-06.2006. [DOI] [PMC free article] [PubMed] [Google Scholar]
- Drummond SP, Paulus MP, Tapert SF. Effects of two nights sleep deprivation and two nights recovery sleep on response inhibition. J Sleep Res. 2006;15(3):261–265. doi: 10.1111/j.1365-2869.2006.00535.x. [DOI] [PubMed] [Google Scholar]
- Batterink L, Yokum S, Stice E. Body mass correlates inversely with inhibitory control in response to food among adolescent girls: an fMRI study. NeuroImage. 2010;52(4):1696–1703. doi: 10.1016/j.neuroimage.2010.05.059. [DOI] [PMC free article] [PubMed] [Google Scholar]
- Killgore WD, Schwab ZJ, Weber M, Kipman M, Deldonno SR, Weiner MR, et al. Daytime sleepiness affects prefrontal regulation of food intake. NeuroImage. 2013;71:216–223. doi: 10.1016/j.neuroimage.2013.01.018. [DOI] [PubMed] [Google Scholar]
- Guerrieri R, Nederkoorn C, Stankiewicz K, Alberts H, Geschwind N, Martijn C, et al. The influence of trait and induced state impulsivity on food intake in normal-weight healthy women. Appetite. 2007;49(1):66–73. doi: 10.1016/j.appet.2006.11.008. [DOI] [PubMed] [Google Scholar]
- Nederkoorn C, Smulders FT, Havermans RC, Roefs A, Jansen A. Impulsivity in obese women. Appetite. 2006;47(2):253–256. doi: 10.1016/j.appet.2006.05.008. [DOI] [PubMed] [Google Scholar]
- Sutin AR, Ferrucci L, Zonderman AB, Terracciano A. Personality and obesity across the adult life span. J Person Social psychology. 2011;101(3):579–592. doi: 10.1037/a0024286. [DOI] [PMC free article] [PubMed] [Google Scholar]
- Gailliot MT, Baumeister RF. The physiology of willpower: linking blood glucose to self-control. Person Soc Psychol Rev: An Offic J Soc Person Soc Psychol. 2007;11(4):303–327. doi: 10.1177/1088868307303030. [DOI] [PubMed] [Google Scholar]
- Buysse DJ, Reynolds CF, 3rd, Monk TH, Berman SR, Kupfer DJ. The Pittsburgh Sleep Quality Index: a new instrument for psychiatric practice and research. Psych Res. 1989;28(2):193–213. doi: 10.1016/0165-1781(89)90047-4. [DOI] [PubMed] [Google Scholar]
- Rechtschafen A, Kales A. A Manual of Standardized Terminology, Techniques and Scoring System for Sleep Stages of Human Subjects. BIS/BRI: UCLA: Los Angeles; 1968. [DOI] [PubMed] [Google Scholar]
- Nosek B, Banaji M. The go/no-go association task. Soc Cogn. 2001;19(6):625–666. [Google Scholar]
- Huster RJ, Enriquez-Geppert S, Lavallee CF, Falkenstein M, Herrmann CS. Electroencephalography of response inhibition tasks: functional networks and cognitive contributions. Intern J Psychophysiol: Offic J Intern Organ Psychophysiol. 2013;87(3):217–233. doi: 10.1016/j.ijpsycho.2012.08.001. [DOI] [PubMed] [Google Scholar]
- Watson TD, Garvey KT. Neurocognitive correlates of processing food-related stimuli in a Go/No-go paradigm. Appetite. 2013;71:40–47. doi: 10.1016/j.appet.2013.07.007. [DOI] [PubMed] [Google Scholar]
- Vainik U, Dagher A, Dube L, Fellows LK. Neurobehavioural correlates of body mass index and eating behaviours in adults: a systematic review. Neurosci Biobehav Rev. 2013;37(3):279–299. doi: 10.1016/j.neubiorev.2012.11.008. [DOI] [PMC free article] [PubMed] [Google Scholar]
- Schmid SM, Hallschmid M, Jauch-Chara K, Born J, Schultes B. A single night of sleep deprivation increases ghrelin levels and feelings of hunger in normal-weight healthy men. J Sleep Res. 2008;17(3):331–334. doi: 10.1111/j.1365-2869.2008.00662.x. [DOI] [PubMed] [Google Scholar]
- McKenna BS, Dickinson DL, Orff HJ, Drummond SP. The effects of one night of sleep deprivation on known-risk and ambiguous-risk decisions. J Sleep Res. 2007;16(3):245–252. doi: 10.1111/j.1365-2869.2007.00591.x. [DOI] [PubMed] [Google Scholar]
- Wu JC, Gillin JC, Buchsbaum MS, Hershey T, Hazlett E, Sicotte N, et al. The effect of sleep deprivation on cerebral glucose metabolic rate in normal humans assessed with positron emission tomography. Sleep. 1991;14(2):155–162. [PubMed] [Google Scholar]
- Hogenkamp PS, Nilsson E, Chapman CD, Cedernaes J, Vogel H, Dickson SL, et al. Sweet taste perception not altered after acute sleep deprivation in healthy young men. Somnologie: Schlafforschung und Schlafmedizin = Somnology: Sleep Res Sleep Med. 2013;17(2):111–114. doi: 10.1007/s11818-013-0606-0. [DOI] [PMC free article] [PubMed] [Google Scholar]
- Donga E, van Dijk M, van Dijk JG, Biermasz NR, Lammers GJ, van Kralingen KW, et al. A single night of partial sleep deprivation induces insulin resistance in multiple metabolic pathways in healthy subjects. J Clin Endocrinol Metab. 2010;95(6):2963–2968. doi: 10.1210/jc.2009-2430. [DOI] [PubMed] [Google Scholar]
- St-Onge MP, Roberts AL, Chen J, Kelleman M, O'Keeffe M, RoyChoudhury A, et al. Short sleep duration increases energy intakes but does not change energy expenditure in normal-weight individuals. Am J Clin Nutr. 2011;94(2):410–416. doi: 10.3945/ajcn.111.013904. [DOI] [PMC free article] [PubMed] [Google Scholar]
- Nedeltcheva AV, Kilkus JM, Imperial J, Kasza K, Schoeller DA, Penev PD. Sleep curtailment is accompanied by increased intake of calories from snacks. Am J Clin Nutr. 2009;89(1):126–133. doi: 10.3945/ajcn.2008.26574. [DOI] [PMC free article] [PubMed] [Google Scholar]
- Kishinevsky FI, Cox JE, Murdaugh DL, Stoeckel LE, Cook EW, 3rd, Weller RE. fMRI reactivity on a delay discounting task predicts weight gain in obese women. Appetite. 2012;58(2):582–592. doi: 10.1016/j.appet.2011.11.029. [DOI] [PubMed] [Google Scholar]
- Castellanos EH, Charboneau E, Dietrich MS, Park S, Bradley BP, Mogg K, et al. Obese adults have visual attention bias for food cue images: evidence for altered reward system function. Intern J Obes. 2009;33(9):1063–1073. doi: 10.1038/ijo.2009.138. [DOI] [PubMed] [Google Scholar]
- Yokum S, Ng J, Stice E. Attentional bias to food images associated with elevated weight and future weight gain: an fMRI study. Obesity. 2011;19(9):1775–1783. doi: 10.1038/oby.2011.168. [DOI] [PMC free article] [PubMed] [Google Scholar]
- Nijs IM, Muris P, Euser AS, Franken IH. Differences in attention to food and food intake between overweight/obese and normal-weight females under conditions of hunger and satiety. Appetite. 2010;54(2):243–254. doi: 10.1016/j.appet.2009.11.004. [DOI] [PubMed] [Google Scholar]
- Haus EL, Smolensky MH. Shift work and cancer risk: potential mechanistic roles of circadian disruption, light at night, and sleep deprivation. Sleep Med Rev. 2013;17(4):273–284. doi: 10.1016/j.smrv.2012.08.003. [DOI] [PubMed] [Google Scholar]
- Eurofound. Fifth European Working Conditions Survey. Luxembourg: Publications Office of the European Union; 2012. [Google Scholar]
- Loeber S, Grosshans M, Korucuoglu O, Vollmert C, Vollstadt-Klein S, Schneider S, et al. Impairment of inhibitory control in response to food-associated cues and attentional bias of obese participants and normal-weight controls. Intern J Obes. 2012;36(10):1334–1339. doi: 10.1038/ijo.2011.184. [DOI] [PubMed] [Google Scholar]
Associated Data
This section collects any data citations, data availability statements, or supplementary materials included in this article.