Abstract
In this paper, we propose a method to model the shear wave propagation in transversely isotropic, viscoelastic and incompressible media. The targeted application is ultrasound-based shear wave elastography for viscoelasticity measurements in anisotropic tissues such as the kidney and skeletal muscles. The proposed model predicts that if the viscoelastic parameters both across and along fiber directions can be characterized as a Voigt material, then the spatial phase velocity at any angle is also governed by a Voigt material model. Further, with the aid of Taylor expansions, it is shown that the spatial group velocity at any angle is close to a Voigt type for weakly attenuative materials within a certain bandwidth. The model is implemented in a finite element code by a time domain explicit integration scheme and shear wave simulations are conducted. The results of the simulations are analyzed to extract the shear wave elasticity and viscosity for both the spatial phase and group velocities. The estimated values match well with theoretical predictions. The proposed theory is further verified by an ex vivo tissue experiment measured in a porcine skeletal muscle by an ultrasound shear wave elastography method. The applicability of the Taylor expansion to analyze the spatial velocities is also discussed. We demonstrate that the approximations from the Taylor expansions are subject to errors when the viscosities across or along the fiber directions are large or the maximum frequency considered is beyond the bandwidth defined by radii of convergence of the Taylor expansions.
Keywords: transversely isotropic, viscoelastic, incompressible, finite element, shear wave, ultrasound elastography
1. Background and Motivation
There are a number of soft tissues that are anisotropic including skeletal muscle [1], cardiac muscle [2], kidneys [3], tendons [4], arteries [5], and skin [6]. In particular, many tissues such as kidneys [3] and skeletal muscles [7, 8] have been modeled as transversely isotropic. Ultrasound shear wave elastography has been used to investigate the shear wave propagation in some of these anisotropic tissues. One consistent finding that has been reported is that a higher shear wave speed is observed when the wave propagates along the fibers in comparison to across the fibers or tissue structures, indicating a higher shear modulus along that parallel direction [8].
It is also known that soft tissues are viscoelastic [9]. As a result, their mechanical responses are time dependent [10, 11] and shear waves propagating in soft tissues experience velocity dispersion [12, 13]. Therefore, although a linear elastic model is simple and usually assumed in elastography, it may be inaccurate because the inherent viscosity is ignored [14].
The tissues’ transversely isotropic and viscoelastic characteristics are rooted in their structural composition, which is closely related to an organ's physiological functions. For example, skeletal muscles consist of cylindrical fibers organized parallel to each other in clusters called fasciculi. The muscle fibers stabilize the stretch or contraction movements by their intrinsic viscoelastic properties [15, 16]. The structure of muscle bundles causes directional and attenuative wave propagation, as well as its wave velocity dispersion behaviors related to tissue viscoelasticity [16-18]. The kidney has nephrons that are radially oriented in the cortex, filtering the blood, and emptying into the renal pelvis.
Because of the specialized structure of these organs, a variation with direction, or anisotropy, in the shear wave propagation occurs depending on the polarization of the wave with respect to these structures such as the muscle fibers in a skeletal muscle.
For shear wave-based elastography imaging methods, such as shearwave dispersion ultrasound vibrometry (SDUV) [13] and magnetic resonance elastography (MRE) [19], it is important to apply a proper constitutive model for the tissue under study. Yet, for tissue types that are transversely isotropic and viscoelastic, a model that accounts for both properties have been rarely studied. Table 1 lists the reported shear elasticities and viscosities measured along (μ∥1 and μ∥2) and across (μ⊥ and μ⊥2) the muscle fibers from 6 selected reports. Among these studies, [12], [8], [20], [21] measured both shear wave elasticity and viscosity while [7] and [22] only considered an elastic model. They show that both the shear wave speed and the shear wave attenuation in muscles are transversely isotropic.
Table 1.
Reported shear elasticity and viscosity measured along and across the muscle fibers.
| Muscle | μ1⊥ (kPa) | μ2⊥ (Pa·s) | μ2∥ (kPa) | μ2∥ (Pa·s) | Reference | Ex vivo /In vivo |
|---|---|---|---|---|---|---|
| Beef | 25 | 3.3 | 49 | 15 | [12] | Ex vivo |
| Porcine | 5.12 | 0.98 | 12.84 | 2.73 | [8] | Ex vivo |
| Porcine | 4.99-5.11 | 1.26-1.57 | 11.98-12.50 | 2.92-3.51 | [20] | Ex vivo |
| Canine | ~9 | - | ~25 | - | [7] | Ex vivo |
| Human | 5.5 | - | 29.3 | - | [22] | In vivo |
| Human | 1.58-1.97 | 0.92-2.89 | 5.86-100.80 | 0.65-6.72 | [21] | In vivo |
Besides biomedical applications, there are a number of studies related to wave propagation in anisotropic media from the seismology community, such as [23], but they are usually more focused in modeling longitudinal waves than shear waves and the materials are compressible compared to nearly incompressible for soft tissues. In this paper, we propose a model that applies to transversely isotropic, viscoelastic and incompressible media and verify it with numerically simulated results and an ex vivo tissue experiment.
There are a number of constitutive models for viscoelasticity. For example, Voigt and Maxwell models are rheological models that use parallel or serial connected spring and dashpot elements to model elasticity and viscosity [12], respectively. The generalized Maxwell model takes into account multiple relaxation times by including a number of Maxwell elements [24]. More recently, fractional models were proposed to better fit experimental data with a smaller number of parameters [25, 26]. In this paper, we limit the viscoelastic behaviors to the dynamic responses of a Voigt material because it has been proven to be effective in modeling tissue dynamic behaviors [12] while maintaining a relatively simple form.
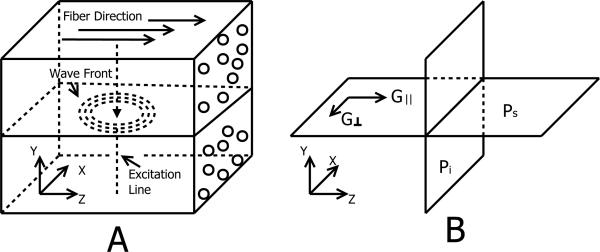
Because the scope of this paper is to facilitate the reconstruction of material properties in ultrasound shear wave elastography, we limit our study to shear wave propagations in the plane of symmetry. As shown in Fig. 1, a transversely isotropic tissue sample is positioned in a Cartesian coordinate system, so that its fibers are aligned with the z axis. In this setup, the x-y plane is defined as the plane of isotropy because the material is isotropic in the plane. The x-z and y-z planes are defined as the planes of symmetry because material properties are symmetric about the z axis in both planes. We further define two principle shear moduli G∥ and G⊥. The subscripts ’∥’ and ’⊥’ represent along and across fiber direction, respectively. Additionally, note that G∥ and G⊥ will be replaced by G*∥ and G*⊥ to represent complex viscoelastic shear moduli in the following sections.
Figure 1.
(A): A transversely isotropic muscle-like medium in a Cartesian coordinate system. Tissue fibers are aligned with the z axis. The wave front of the shear wave being studied in this paper is annotated. The excitation is applied along a vertical line, so the induced shear wave is a cylindrical wave. (B): x-y plane is the plane of isotropy (Pi) and x-z and y-z planes are the planes of symmetry (Ps). Such materials have two principle shear moduli: G∥ and G⊥ and they determine the shear wave speed along and across the tissue fibers, respectively.
In this paper, we will discuss two different velocities of shear wave propagation: group velocity and phase velocity. The direction of the group velocity is the direction of energy transport while the direction of phase velocity is always perpendicular to the wave front. In Fig. 1, the group velocity is always aligned along the line defined by connecting the source incidence point to the point of measurement on the wave front. For a transversely isotropic medium, group and phase velocities generally do not have the same directions and amplitudes. They are identical only if the material is nondispersive and isotropic or if the wave is a pure plane wave. Please refer to [7] for a schematic description of the differences between the spatial group and phase velocity. A mathematical description of the differences between the two physical variables are given in [27] in the context of electromagnetic wave propagation. In experimental studies shown in Fig. 1, where the excitation is a line source along the y axis, the group velocity is much easier to measure compared to the phase velocity, which requires the exact wave front to be estimated. To make a distinction from the wave speed dispersion as a function of frequency, from this point on, we will refer the phase and group velocities as spatial phase and group velocities.
For acoustic radiation force induced shear waves, such as in many shear wave elastography methods, because the acoustic radiation force is distributed along and near the push axis, in the lateral plane where the material receives the greatest radiation force, the shear waves can be approximated by cylindrical waves [28, 29]. When the material is transversely isotropic, the direct shear wave speed measurement corresponds to the spatial group velocity instead of spatial phase velocity. As shown in Table 1, in transversely isotropic and viscoelastic materials such as skeletal muscles, most studies focus on measuring the material properties in the two principle directions: along and across the fiber directions. In this paper, we propose a theory that models the angular dependency of shear wave viscoelasticity in the plane of symmetry. The theory and numerical simulations presented in this study can help improve understanding and interpretation of ultrasound elastography measurements in transversely isotropic tissues.
2. Theory
Based on the theory of elastodynamics, a propagating plane wave in a source-free, homogeneous and anisotropic medium can be described by the Christoffel equation [23, 30],
| (1) |
where ρ is the mass density, Vw is the spatial phase velocity at which the wave front of a plane wave travels. The vector represents the direction of particle motion, which defines the polarization of the plane wave, Wiknjnl is a 3 × 3 Christoffel matrix in Einstein notation, where cijkl is the fourth-order stiffness matrix of the material, and is a unit vector that defines the propagation direction of the phase velocity.
Equation (1) can be solved by finding the eigenvalues and eigenvectors of the matrix Wik. Its eigenvalues and eigenvectors give the magnitude of the spatial phase velocity and its polarization direction, respectively. The direction of the wave propagation is set by choosing the vector in the expression of Wik.
For a transversely isotropic material, its Christoffel matrix is symmetric, so there are 6 independent variables. But to study the shear waves that propagate in the plane of symmetry as shown in Fig. 1, only the two principle shear moduli, G∥ and G⊥, are needed. Then the eigenproblem of the Christoffel matrix can be reduced to the following equations [7].
| (2) |
| (3) |
We can use Equation (2) to calculate the shear velocity at a given phase angle Equation (3) shows that the particle motion polarizes in the y direction. The vector is an eigenvector to Wik, so the variable γ is an arbitrary constant and its value does not influence the solution. Besides this particular solution, there are two other solutions. One solution corresponds to the compressional wave, which is too fast for the ultrasound shear wave elastography to capture; the other is so called “quasi-” shear or longitudinal wave, whose particle movements are in the x-z plane. To measure these waves, it would require placing a probe on the y-z surface, along the z axis. The study of these two modes is outside of the scope of this paper. The analytical solution of the quasi-shear wave is rather complicated; but fortunately if the excitation force is perpendicular to the plane of symmetry, such as that are generated using acoustic radiation force in many shear wave elastography methods, the quasi-shear wave will be minimized [7]. For details about solving the complete solutions to the Christoffel equation in anisotropic material, please refer to [30].
When a material is linear viscoelastic, the Christoffel matrix becomes a complex matrix and G∥ and G⊥ in Equation (2) should be substituted with their corresponding complex shear moduli G*∥ and G*⊥ [23]. When both moduli are Voigt types, their complex moduli can be expressed as functions of the angular frequency ω,
| (4) |
| (5) |
where μ∥1, μ∥2, μ⊥1 and μ⊥2 are the shear elasticities and viscosities along and across the fiber directions, respectively. From Equations (2), (4) and (5) the complex phase modulus Gw* can be derived,
| (6) |
where and and they are defined as the apparent shear elasticity and viscosity of spatial phase velocity for a given phase angle θw, at a frequency . The details about the derivation are included in Appendix A. The complex wave number of the spatial phase velocity, , is related to the spatial phase velocity by . We can see if G*∥ and G*⊥ are Voigt types of materials, the shear wave behaviors for any phase angle θw will be Voigt types as well.
Note that in ultrasound shear wave elastography, the shear waves induced by acoustic radiation force are generally not plane waves, so Equation (6) cannot be applied directly. Instead, because the spatial group velocity can be measured more easily than the spatial phase velocity, we also would like to derive the complex modulus for the spatial group velocity. For elastic media, applying the conversion between the spatial phase and group velocities, the spatial group velocity, Vr, has the following relation to group angle θr [7].
| (7) |
When the media is viscoelastic, G⊥ and G∥ are substituted by their complex counterparts (Equation (4) and (5)), then the complex group modulus G*r can be expressed as,
| (8) |
where k*r is the complex wave number for spatial group velocity. The real and imaginary parts of Equation (8) are:
| (9) |
| (10) |
| (11) |
We can see that unlike G*r, the real part of G*r is not a constant and its imaginary part is not a linear function of ω. Therefore strictly speaking, for any angles other than 0° and 90°, G*r does not exhibit Voigt types of shear wave behaviors.
Applying Taylor expansions to Equations (9) and (10) around ω = 0 and keeping their first terms lead to,
| (12) |
| (13) |
It can be shown that Equation (12) only has even terms and its first term is a constant. Equation (13) only has odd terms and its first term is a linear function of ω. If the higher order terms of the Taylor expansions are truncated, we can define the apparent shear elasticity μr1 and viscosity μr2 of complex spatial group modulus G*r as:
| (14) |
| (15) |
| (16) |
We can see by truncating the Taylor expansions, group velocity measurements may obey the properties of a Voigt material. It would be valuable to investigate under what conditions the approximation in Equation (14) is valid. To analyze the convergence of the Taylor expansions, we can estimate the radius of convergence ω by finding the following limit [31],
| (17) |
where dn and dn+2 are the two adjacent nonzero coefficients of a Taylor expansion. The radius of convergence r needs to be squared so both sides of Equation (17) have the same unit. Solving Equation (17) analytically is rather complex so a numerical approximation was carried out instead. Practically, we can calculate the ratio for a number of terms and then estimate the limit by extrapolating the curve to infinity. As an example, when we use the material properties: , at θr = 45° the value of for both elasticity and viscosity stabilize around 3.21 × 10⁷ for n ≤ 31. It is reasonable to approximate the radii of convergence for both elasticity and viscosity as . Then the upper limit of the frequency bandwidth is . This set of material parameters is in the normal range of muscles as listed in Table 1.
Note that the radius of convergence is subject to the material properties and the angle θr. Numerical tests suggest that increasing the viscosity will decrease the radius of convergence. For example if is increased to 5 Pa·s, the radii of convergence of the shear elasticity and viscosity decrease to 3.40 × 10³ rad·s−1 with an upper frequency limit of 541.13 Hz We can also find that as long as the values of and stay within the normal range of biological tissues such as 10 Pa·s, the radius of convergence is on the order of 103~104 rad·s−1. More analyses on this topic are included in the discussion section.
The radius of convergence represents a region beyond which something dramatic may happen. Indeed it is determined by the first pole of a power series. It is more a safety measure than a guarantee of accuracy. Within the radius of convergence, a power series can converge but it does not necessarily imply Equations (15) and (16) are accurate.
Equations (14), (15) and (16) provide a way to estimate the shear elasticity and viscosity using the spatial group velocity. However, it requires the complex moduli to be measured, which need both shear wave speed and attenuation. While both can be experimentally acquired, the attenuation measurements are challenging because of the degraded signal-to-noise ratio (SNR) in tissues and the need for a geometric compensation [28, 29]. In this paper, we rely on the spatial group velocity Vr and fit it with a Voigt model dispersion curve to estimate the shear viscoelastic parameters [12].
| (18) |
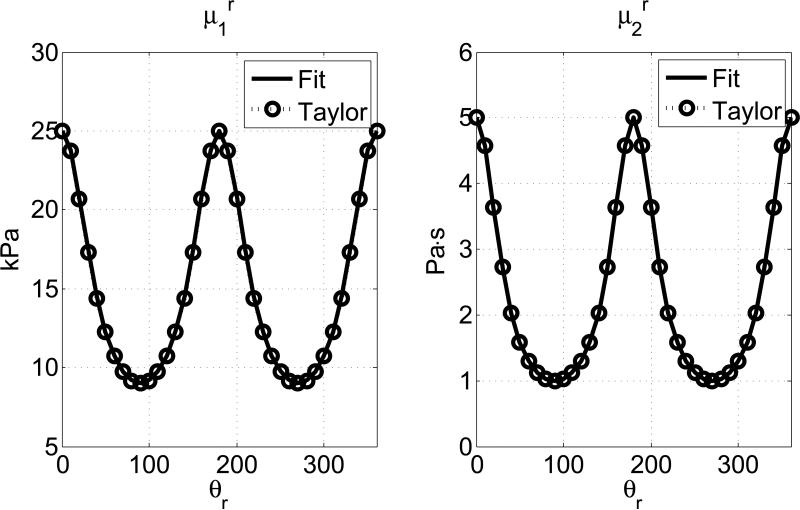
Fig. 2 shows a comparison between the μr1 and μr2 estimated from Equation (18) and those obtained from Equations (14), (15) and (16). We can see they match well. We define the mean percentage of error e as,
| (19) |
Then the mean percentage of error for μr1 and μr2 are 0.16% and 0.11%, respectively. The material properties in Fig. 2 are μ⊥1 = 9 kPa, μ⊥2 = 1 Pa·s, μ∥1 = 25 kPa, μ∥2 = 5 Pa·s. measurements θr in degrees. The value of 0° corresponds to along the fiber direction. The frequency range of the curve fitting is 200-800 Hz.
Figure 2.
Apparent shear elasticity μr1 and viscosity μr2 estimated from fitting the spatial group velocity with a Voigt model (Equation (18)) are compared to theoretical values obtained from the Taylor expansions in Equations (14), (15) and (16). The horizontal axes are the angle for spatial group velocity
3. Numerical Modeling
Setting up solver
In order to simulate three-dimensional wave propagation problems, a full stiffness matrix was implemented. For a transversely isotropic, viscoelastic and incompressible material, its stiffness matrix can be defined by three independent material properties [32]. In this paper, the three given parameters are , and , where E⊥ and E∥ are the Young's moduli along and across the fiber direction, respectively. Following Chadwick's method [33], the stiffness matrix can be given by as,
| (20) |
where and the values of λ and ξ are related by,
| (21) |
| (22) |
where k is the bulk modulus. By adjusting the bulk modulus k and keeping the shear moduli fixed, we can adjust the compressibility of the material. As k → ∞, the material approaches incompressible. In this paper, k is set to a number so that vtp = −[c−1]1,3Et < 0.499, where [c−1]1,3 denotes the (1,3) element of the matrix inverse of c and Et = 1/[c−1]3,3. There are other proposed methods for setting up the stiffness matrix for transversely isotropic, incompressible materials [22, 34].
The stiffness matrix defined by Equation (20) only considers the shear components to be viscoelastic. Therefore, the compressional wave is elastic. This is adequate for this paper since we are focusing on the shear wave propagation. To model the viscoelasticity for both shear and compressional waves, all the elements in Equation (20) need to be set to be complex.
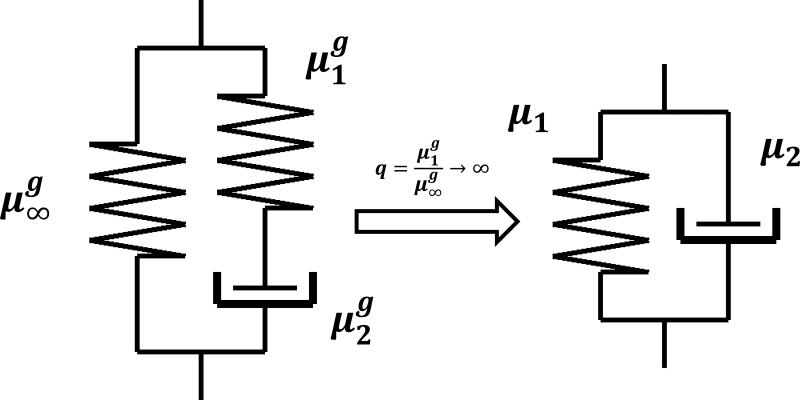
A Voigt material has an infinite instantaneous stiffness response to a strain step function. Numerically, this is not feasible. In this paper, instead of implementing a Voigt model directly, we approximated a Voigt model with a one-branch generalized Maxwell model as shown in Fig. 3. Appendix B shows that as , the complex modulus of the model approaches that of an equivalent Voigt material. In practice, we set q to a large number between 100 to 1000, for both numerical stability and efficiency. This approximation is applied to implement both G*⊥ and G*∥.
Figure 3.
The Voigt model is approximated by a one-branch generalized Maxwell model. As θ → ∞, the complex modulus of a one-branch generalized Maxwell model approaches that of a Voigt model. Typically q = [100, 1000] for numerical stability and efficiency.
The governing one-dimensional partial differential equation for the generalized Maxwell model in Fig. 3 is,
| (23) |
where σ and ε are the stress and strain, respectively and the time constant is . To step forward in time explicitly, a midpoint rule of differentiation was applied to Equation (23) to estimate the stress increment from the current time step to the next [35]. The material was implemented in the finite element (FE) software package Abaqus/Explicit (version 6.12-1, Dassault Systems, Waltham, MA) with a user defined material subroutine VUMAT [35].
Shear Wave Simulations
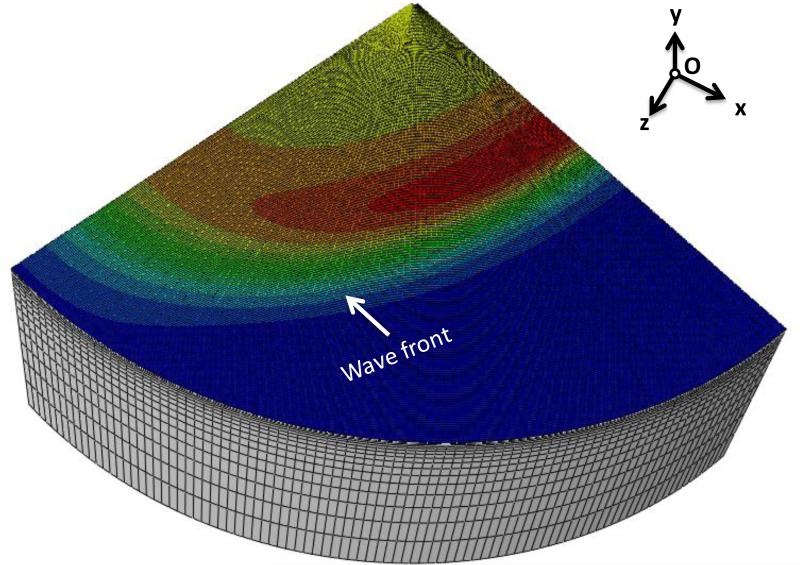
Shear wave simulations were carried out in a cylindrical model as shown in Fig. 4. Taking advantage of the symmetry, only a quarter of the domain was modeled. The radius of the cylinder was 50 mm and the height of the cylinder was 50 mm. An impulse traction force was applied along the center of the cylinder, and the duration of the step impulse was 400 μs. The radius of the rod-shaped source was 0.5 mm. The size of the source is small enough so the generated wave can be regarded as a cylindrical wave. The particle velocity in the y direction was extracted and analyzed. The model was meshed with 267,840 8-node elements (C3D8R) with enhanced hourglass control and reduced integration, to minimize shear locking and hourglass effects [36]. The mesh density was finer for the region near the source. Mesh convergence tests were carried out so that maximum of 2% difference in the displacement in +y was achieved.
Figure 4.
Finite element model of the shear wave propagation simulations. A traction force in -y direction is applied along the center line of the model. The resulting shear waves propagate from the center to the perimeter of the cylinder.
In the finite element simulations, we used μ∥1 = 25 kPa, μ∥2 = 8 Pa·s, μ⊥1 = 9 kPa, μ⊥2 = 3 Pa·s. This set of parameters is in the range of an ex vivo tissue experiment that will be discussed in the next section.
Data processing and results
Two data processing methods were performed. In the first method, the dispersion of the shear wave spatial group velocity Vr was estimated by a k-space method [37] for group angles θr from 0-360°, with 5° increments. Then Vr was converted to the spatial phase velocity Vw as a function of the phase angle θw by,
| (24) |
| (25) |
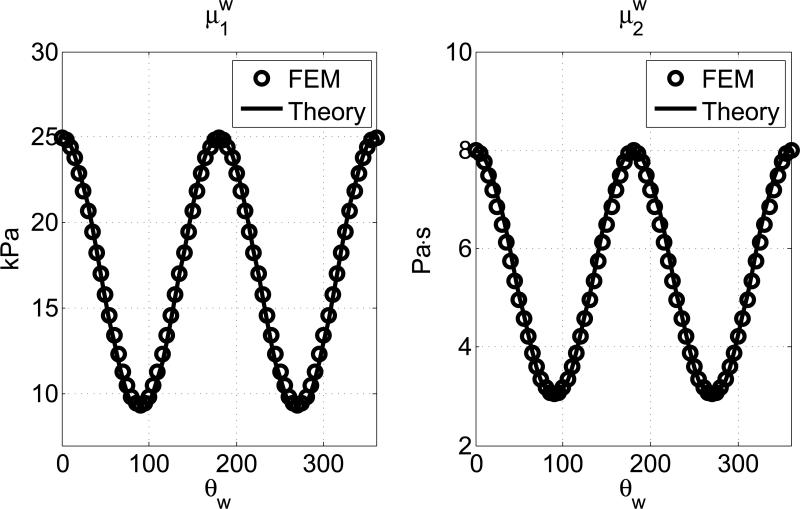
Then the apparent shear elasticity and viscosity for the spatial phase velocity were estimated from a nonlinear curve fit as shown in Equation (18). In Fig. 5, the estimated apparent shear elasticity μw1 and shear viscosity μw2 for the spatial phase velocity are plotted with their theoretical values as defined in Equation (6). The frequency range of the curve fitting is 100-480 Hz. The mean percentage of error are 0.30% and 0.36% for μw1 and μw2, respectively.
Figure 5.
The estimated values of μw1 and μw1 from FEM (circles) are compared to the theoretical predictions in Equation (6) (solid lines). The material properties are μ∥1 = 25 kPa, μ∥2 = 8 Pa·s, μ⊥1 = 9 kPa, μ⊥2 = 3 Pa·s.
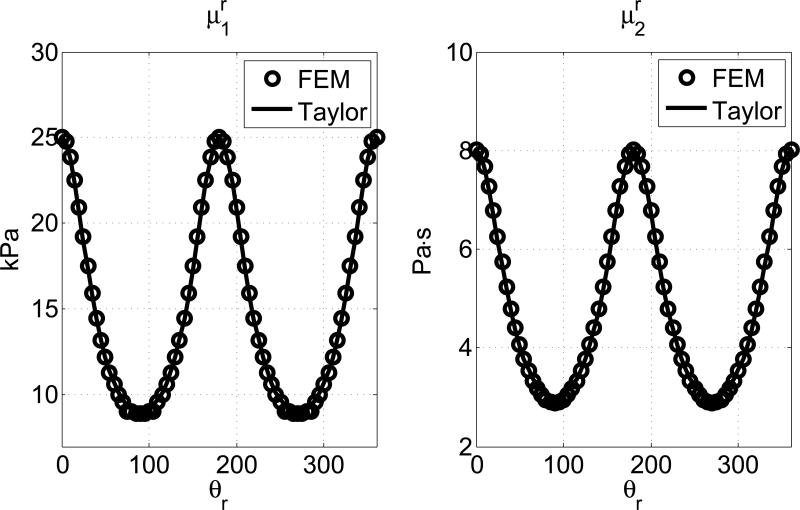
For the second method, the apparent shear elasticity μr1 and viscosity μr2 of the spatial group velocity were estimated directly from the spatial group velocity Vr by curve fittings. The same frequency range (100-480 Hz) was used as in the first method. Then the fitted values were compared with the first terms of the Taylor expansions in Equation (14). The mean percentage of errors are 0.64% and 0.78% for μr1 and μr2, respectively. The results are plotted in Fig. 6.
Figure 6.
The estimated values of μr1 and μr2 from FEM (circles) are compared to the approximated predictions in Equation (14) (solid lines). The material properties are μ∥1 = 25 kPa, μ⊥2 = 8 Pa·s, μ⊥1 = 9kPa, μ⊥2 = 3 Pa·s.
To clarify any potential confusions, the results of the first data processing method shown in Fig. 5 are the apparent elasticity and viscosity if the shear wave is a plane wave. Because the excited waves are cylindrical waves, equations 24 and 25 are therefore necessary to convert the measured group velocities to the equivalent phase velocities. This is not needed in the second data processing method, because the Voigt model fit was applied directly to the group velocities.
4 Tissue Experiment Validation
An ex vivo tissue experiment was carried out to validate the model as described by Aristizabal, et al [38]. A porcine tenderloin muscle sample was tested with ultrasound shear wave elastography on a research ultrasound scanner (Verasonics, Inc., Redmond, WA). The ultrasound system was equipped with a linear array transducer (L7-4, Philips Healthcare, Andover, MA) transmitting at 4.1 MHz center frequency. A focused radiation push of duration of 400 μs and focused at 28 mm away from the transducer was was used to induce shear wave, which was measured by a compounded plane-wave imaging method [39]. The tissue was mounted on a rotating stage with a rotation angle ranging between 0-360° every 10° steps so that shear wave propagation can be measured at multiple angles. The spatial group velocity was estimated from the distribution of particle displacement, which was estimated by a two-dimensional in-phase/quadrature auto-correlation method [40] with spatial and temporal averaging of the compounded echoes from three different angled plane waves detected at an effective frame rate of 4.16 kHz.
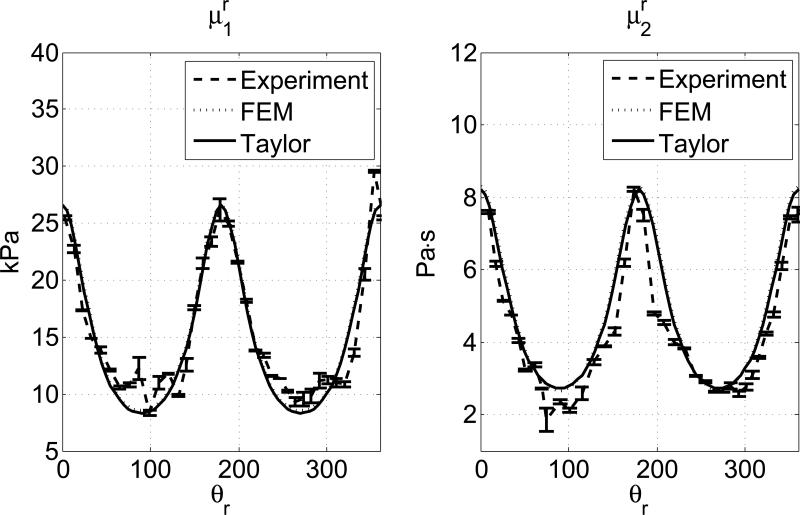
To estimate the apparent shear elasticity, μr1, and viscosity, μr2, for group velocity, the shear wave dispersion curves of the temporal phase velocity were fitted with a Voigt dispersion model at every angle in a frequency range 200-500 Hz. By nonlinear fittings, the shear viscoelastic parameters are estimated at 0° and 90°: μ∥1 = 26.54 kPa, μ∥2 = 8.21 Pa·s, μ⊥1 = 8.31 kPa, μ⊥2 = 2.73 Pa·s, respectively. Fig. 7 shows the estimated shear elasticities and viscosities compared to the truncated Taylor expansions in equation 14. The error bars represent the standard deviations of 3 independent measurements at each angle. The mean percentage errors between the experimental result and the theory for μr1 and μr2 are 0.96% and 2.98%, respectively. Fig. 7 also plots the results generated from a FEM simulation using the same material properties. The same data processing procedures are applied to the FEM data set as in experiment data set. The mean percentage errors between the FEM result and the theory for μr1 and μr2 are 0.47% and 0.24%, respectively.
Figure 7.
The estimated values of μr1 and μr2 from a tissue experiment (dashed line) are compared to the approximated predictions in Equation (14) (solid lines). The results of a FEM simulation of the same parameters are also included (dotted line). The error bars in the experimental results represent the standard deviations of 3 independent measurements.
Discussion
The Taylor expansions for approximating the shear group elasticity μr1 and viscosity μr2 are particularly useful when processing experimental data sets, because the spatial group velocity can be used directly in curve fittings, without converting to the spatial phase velocity. Note that there are derivatives taken with respect to the group angle θr in Equations (24) and (25). While this works fine for simulated data, it might be difficult for experimental results, because the angular resolution could be coarser than needed. However, we should also bear in mind that how well the Taylor expansions perform relies on the material properties and the bandwidth.
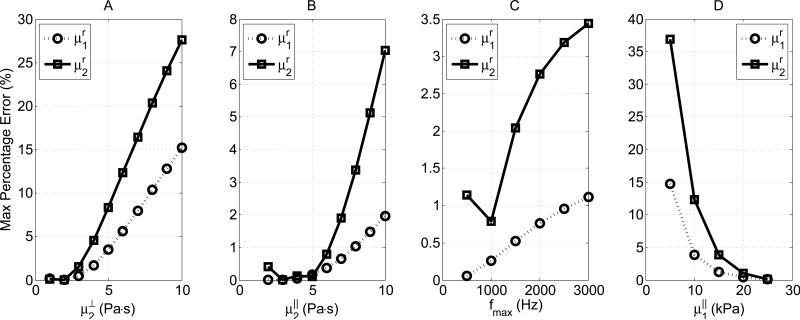
Fig. 8 shows the maximum percentage of errors for different μ⊥2, μ∥2, fmax and μ∥1. From Figs. 8A and 8B, we can see that the error is particularly sensitive to the shear viscosities. As the shear viscosity across (Fig. 8A) or along (Fig. 8B) the fiber direction increases, the Taylor expansion becomes increasingly more inaccurate. From Fig. 8C, it is shown that the error is also influenced by the maximum frequency. As the bandwidth broadens, the Taylor expansion is more and more subject to error. Indeed, as the bandwidth deviates from the expansion point (f = 0 Hz), the first terms in the Taylor series become less dominant. In this particular case, even when the maximum frequency is beyond the radius of convergence, the impact from the bandwidth is not as severe as the shear viscosity as shown in Figs. 8A and 8B. Additionally, for ultrasound based shear wave elastography, which can be limited by SNR, the maximum reliable frequency is usually less than 1000 Hz. Therefore, the error associated with bandwidth broadening may not be an issue. Fig. 8D studies the effects of shear elasticity. It shows that as μ∥1 increases, the maximum percentage difference drops quickly to a small value. The same trend is found for μ∥2. This implies that the model is more accurate when the shear elasticity is large and the shear viscosity is low. Another observation from Fig. 8 is that μr1 is always better estimated than μr2. In Equations (15) and (16), we can see μr1 is only determined by the shear elasticities while μr2 is determined by both shear elasticities and viscosities. The estimation for μr2 tends to deteriorate faster than μr1 when the shear viscosities increase. For future work, a more rigorous error analysis is needed for studying the applicability of the Taylor expansions.
Figure 8.
Maximum percentage errors between the shear group elasticity and viscosity estimated by fitting a Voigt model and the theoretical values defined by the first term of Taylor expansions (Equation (14)). A: μ⊥1 =9 kPa, μ⊥2 = 1-10 Pa·s, μ∥1 = 25 Kpa, μ∥2 = 5 Pa·s, fmax = 800 Hz. B: μ⊥1 = 9 Kpa, μ⊥2 = 1 Pa·s, μ∥1 = 25 Kpa, μ∥2 = 1-10 Pa·s fmax = 800 Hz. C: μ⊥1 = 9 Kpa, μ⊥2 = 25 Kpa, μ∥2 = 5 Pa·s, fmax = 500-3000 Hz. D: μ⊥1 = 9 Kpa, μ⊥2 = 1 Pa·s, μ∥1 = 5-25 Kpa, μ∥2 = 5 Pa·s, fmax = 800 Hz. In all plots, the minimum frequency is 200 Hz.
As was discussed, in ultrasound shear wave elastography, shear wave attenuation measurement is more challenging than the speed measurement. This is because of the existence of noise and the fact that the generated shear wave is not a plane wave. Instead, the shear wave behaves more like a cylindrical wave near the focal depth. Thereby, geometric correction might need to be included [8]. A number of papers have discussed how to recover the shear wave attenuation. For example, attenuation can be estimated by an algebraic inversion of the Helmholtz equation [41]. Attenuation can also be estimated by fitting the shear wave amplitude and propagation distance with an exponential decaying function [8, 42]. More recently, we discovered that shear wave attenuation can be estimated from a k-space analysis directly [43]. Knowing the shear wave attenuation, the complex modulus of the group velocity can be calculated and the complex modulus for the spatial phase velocity might be found by a conversion similar to Equations (24) and (25). This way, the shear wave elasticity μw1 and viscosity μw2 for the spatial phase velocity can be extracted directly from it complex modulus without curve fitting. This topic is reserved for future studies.
Even though for simplicity and relevance to realistic tissues, in this work, we only considered implementing Voigt material properties in across and along the fiber directions. The same approach can be easily extended to simulate other viscoelastic models that can be expressed analytically cin a partial differential equation form. Actually, the generalized Maxwell model is already implemented if is not set to a large number.
This simulation framework provides a very flexible platform to explore the behavior of viscoelastic, transversely isotropic media. Simulations of these materials can assist in designing and optimizing techniques for measuring these parameters in ex vivo and in vivo soft tissues. A feedback loop between the simulations and measurements can be used to inform the choice of rheological models to be used for implementation in the FE simulations.
A limitation of the proposed model is that it ignores the influences from the theoretically possible quasi-shear wave. Experimentally, it requires the excitation beam perpendicular to the tissue fiber direction. In our ex vivo tissue experiment, this is ensured by positioning the probe at a right angle with regard to the plane of symmetry at all times. This condition might be challenging when taking an in vivo measurement in muscles. In such cases, the measured wave motion becomes a superposition of the shear and quasi-shear waves. In [22], the authors showed that the quasi-shear wave speed should be well-separated from shear wave and faster than that of the shear wave. However, the relative amplitudes between the two modes remain unknown. Empirical results suggest that the energy of the shear wave mode might dominate [7]. This topic should be reserved for future studies.
The ex vivo tissue experiment was conducted with a linear array probe and for each different angle the probe or the tissue sample has to be rotated. This procedure works well for ex vivo setups but would not be practical because of the long time needed to adjust the angle. This problem can be solved by using 2D ultrasound imaging probes with adequate angular resolutions and SNRs [7]. Another potential advantage of using 2D probes is that plane waves might be able to generated and monitored by careful beamforming and sequence design [44]. In this case, at any wave propagation angle, a Voigt model can be applied directly (Equation (6)) without using the Taylor approximation.
6. Conclusion
In this paper, we proposed a transversely isotropic, viscoelastic model for modeling shear wave propagations in incompressible materials. Such a model is useful when applying ultrasound based shear wave elastography in fibrous soft tissues such as skeletal muscles. The theory is based on extending the transversely isotropic, elastic model to cover viscoelasticity by substituting elastic shear moduli with their complex counterparts. The proposed model was implemented with a commercially available finite element package and validated. Then shear wave propagations were simulated and analyzed to find the shear elasticity and viscosity predictions for both the spatial phase and group velocities. An ex vivo tissue experiment was also conducted to validate the proposed model. In both the numerical simulations and the tissue experiment, the estimated shear elasticity and viscosity values matched well with theory.
Acknowledgements
The authors would like to thank Dr. Max Denis, Dr. Llya Tsvankin and Dr. Wilkins Aquino for their valuable inputs. This work was supported by grant R01DK092255 from the National Institute of Diabetes and Digestive and Kidney Diseases (NIDDK) and National Institutes of Health (NIH). The content is solely the responsibility of the authors and does not necessarily represent the official views of the NIDDK and NIH.
Appendix A
Equation (A1) shows the derivation of Equation (6).
| (A1) |
Appendix B
This appendix proves that a one-branch generalized Maxwell model approaches a Voigt model as . For the one-branch generalized Maxwell model shown in Fig. 3, the storage modulus GS and loss modulus GL are:
| (B1) |
| (B2) |
Taking the limit as q → ∞ and applying L'Hopital's rule,
| B3) |
| (B4) |
Comparing to the complex modulus of a Voigt material, as q → ∞, the one-branch generalized Maxwell model converges to a Voigt model with μg∞ → μ1 and μg2 → μ2, where μ1 and μ2 are the shear elasticity and viscosity of the Voigt model, respectively.
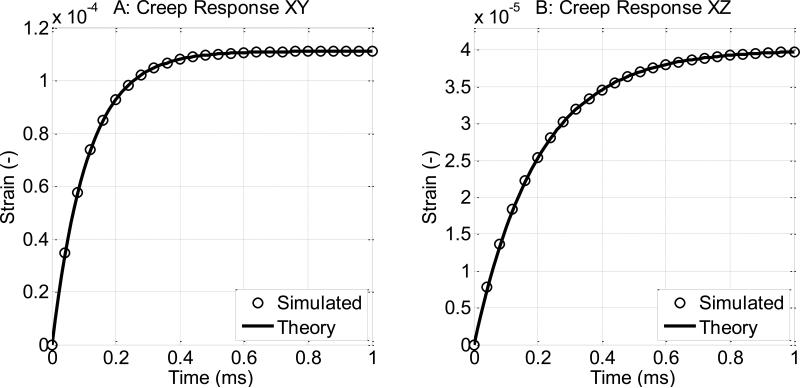
For validation, a single-element creep test was carried out. The size of the element was 1 × 1 × 1 m3. Boundary conditions and appropriate loading were applied to the element so the element was subject to a shear loading of 1 Pa. The resulting strain was extracted from the model and compared to the theoretical responses as shown in Fig. B1. We can see the simulated creep responses match with theory well. In Fig. B1, the material properties are μ⊥1 = 9 kPa, μ⊥2 = 1 Pa·s, μ∥1 = 25 kPa, μ∥2 = 5 Pa·s. To minimize the influences from inertia, the mass density is set to a small number p = 1×10⁻¹⁰ kg/m3. For the shear wave simulations in section 3, the mass density is set to 1000 kg/m3. The theoretical creep curves of a Voigt material are calculated by: .
Figure B1.
Validation results of the single-element creep tests. Dimension of the element is 1 × 1 × 1 m3. A: y-z surface is subjected to a 1 Pa shear stress in +y direction. B: y-z surface is subjected to a 1 Pa shear stress in +z direction. The material properties are μ⊥1 = 9 Kpa, μ⊥2, = 1 Pa·s, μ∥1 = 25 Kpa, μ∥2 = 5 Pa·s.
References
- 1.Gennisson JL, Catheline S, Chaffai S, Fink M. Transient elastography in anisotropic medium: application to the measurement of slow and fast shear wave speeds in muscles. The Journal of the Acoustical Society of America. 2003 Jul;114:536–41. doi: 10.1121/1.1579008. [DOI] [PubMed] [Google Scholar]
- 2.Lee W-N, Pernot M, Couade M, Messas E, Bruneval P, Bel A, Hagege AA, Fink M, Tanter M. Mapping myocardial fiber orientation using echocardiography-based shear wave imaging. IEEE transactions on medical imaging. 2012;31:554–62. doi: 10.1109/TMI.2011.2172690. [DOI] [PubMed] [Google Scholar]
- 3.Amador C, Urban MW, Chen S, Greenleaf JF. Shearwave dispersion ultrasound vibrometry (SDUV) on swine kidney. IEEE transactions on ultrasonics, ferroelectrics, and frequency control. 2011;58:2608–19. doi: 10.1109/TUFFC.2011.2124. [DOI] [PMC free article] [PubMed] [Google Scholar]
- 4.Brum J, Bernal M, Gennisson JL, Tanter M. In vivo evaluation of the elastic anisotropy of the human Achilles tendon using shear wave dispersion analysis. Physics in medicine and biology. 2014;59:505–23. doi: 10.1088/0031-9155/59/3/505. [DOI] [PubMed] [Google Scholar]
- 5.Dobrin PB, Doyle JM. Vascular smooth muscle and the anisotropy of dog carotid artery. Circulation research. 1970 Jul;27:105–19. doi: 10.1161/01.res.27.1.105. [DOI] [PubMed] [Google Scholar]
- 6.Vexler A, Polyansky I, Gorodetsky R. Evaluation of skin viscoelasticity and anisotropy by measurement of speed of shear wave propagation with viscoelasticity skin analyzer. The Journal of investigative dermatology. 1999 Nov;113:732–9. doi: 10.1046/j.1523-1747.1999.00751.x. [DOI] [PubMed] [Google Scholar]
- 7.Wang M, Byram B, Palmeri M, Rouze N, Nightingale K. Imaging transverse isotropic properties of muscle by monitoring acoustic radiation force induced shear waves using a 2-D matrix ultrasound array. IEEE transactions on medical imaging. 2013 Sep;32:1671–84. doi: 10.1109/TMI.2013.2262948. [DOI] [PMC free article] [PubMed] [Google Scholar]
- 8.Urban MW, Greenleaf JF. A Kramers-Kronig-based quality factor for shear wave propagation in soft tissue. Physics in medicine and biology. 2009 Oct 7;54:5919–33. doi: 10.1088/0031-9155/54/19/017. [DOI] [PMC free article] [PubMed] [Google Scholar]
- 9.Urban MW, Chen S, Fatemi M. A Review of Shearwave Dispersion Ultrasound Vibrometry (SDUV) and its Applications. Current medical imaging reviews. 2012 Feb 1;8:27–36. doi: 10.2174/157340512799220625. [DOI] [PMC free article] [PubMed] [Google Scholar]
- 10.Qiang B, Greenleaf J, Oyen M, Zhang X. Estimating material elasticity by spherical indentation load-relaxation tests on viscoelastic samples of finite thickness. IEEE transactions on ultrasonics, ferroelectrics, and frequency control. 2011;58:1418–29. doi: 10.1109/TUFFC.2011.1961. [DOI] [PubMed] [Google Scholar]
- 11.Sridhar M, Insana MF. Ultrasonic measurements of breast viscoelasticity. Medical physics. 2007 Dec;34:4757–67. doi: 10.1118/1.2805258. [DOI] [PMC free article] [PubMed] [Google Scholar]
- 12.Catheline S, Gennisson JL, Delon G, Fink M, Sinkus R, Abouelkaram S, Culioli J. Measurement of viscoelastic properties of homogeneous soft solid using transient elastography: An inverse problem approach. Journal of the Acoustical Society of America. 2004 Dec;116:3734–3741. doi: 10.1121/1.1815075. [DOI] [PubMed] [Google Scholar]
- 13.Chen S, Urban MW, Pislaru C, Kinnick R, Zheng Y, Yao A, Greenleaf JF. Shearwave dispersion ultrasound vibrometry (SDUV) for measuring tissue elasticity and viscosity. IEEE transactions on ultrasonics, ferroelectrics, and frequency control. 2009 Jan;56:55–62. doi: 10.1109/TUFFC.2009.1005. [DOI] [PMC free article] [PubMed] [Google Scholar]
- 14.Bercoff J, Tanter M, Muller M, Fink M. The role of viscosity in the impulse diffraction field of elastic waves induced by the acoustic radiation force. IEEE transactions on ultrasonics, ferroelectrics, and frequency control. 2004 Nov;51:1523–36. doi: 10.1109/tuffc.2004.1367494. [DOI] [PubMed] [Google Scholar]
- 15.Taylor DC, Dalton JD, Jr., Seaber AV, Garrett WE., Jr. Viscoelastic properties of muscle-tendon units. The biomechanical effects of stretching. The American journal of sports medicine. 1990 May-Jun;18:300–9. doi: 10.1177/036354659001800314. [DOI] [PubMed] [Google Scholar]
- 16.Rudenko OV, Sarvazyan AP. Wave biomechanics of the skeletal muscle. Acoustical Physics. 2006 Dec;52:720–732. [Google Scholar]
- 17.Klatt D, Papazoglou S, Braun J, Sack I. Viscoelasticity-based MR elastography of skeletal muscle. Physics in medicine and biology. 2010;55:6445–59. doi: 10.1088/0031-9155/55/21/007. [DOI] [PubMed] [Google Scholar]
- 18.Hoyt K, Kneezel T, Castaneda B, Parker KJ. Quantitative sonoelastography for the in vivo assessment of skeletal muscle viscoelasticity. Physics in medicine and biology. 2008;53:4063–80. doi: 10.1088/0031-9155/53/15/004. [DOI] [PMC free article] [PubMed] [Google Scholar]
- 19.Muthupillai R, Ehman RL. Magnetic resonance elastography. Nature medicine. 1996 May;2:601–3. doi: 10.1038/nm0596-601. [DOI] [PubMed] [Google Scholar]
- 20.Urban MW, Chen S, Greenleaf JF. Error in estimates of tissue material properties from shear wave dispersion ultrasound vibrometry. IEEE transactions on ultrasonics, ferroelectrics, and frequency control. 2009 Apr;56:748–58. doi: 10.1109/TUFFC.2009.1097. [DOI] [PMC free article] [PubMed] [Google Scholar]
- 21.Gennisson JL, Deffieux T, Mace E, Montaldo G, Fink M, Tanter M. Viscoelastic and anisotropic mechanical properties of in vivo muscle tissue assessed by supersonic shear imaging. Ultrasound in medicine & biology, vol. 2010 May;36:789–801. doi: 10.1016/j.ultrasmedbio.2010.02.013. [DOI] [PubMed] [Google Scholar]
- 22.Papazoglou S, Rump J, Braun J, Sack I. Shear wave group velocity inversion in MR elastography of human skeletal muscle. Magnetic resonance in medicine : official journal of the Society of Magnetic Resonance in Medicine / Society of Magnetic Resonance in Medicine. 2006;56:489–97. doi: 10.1002/mrm.20993. [DOI] [PubMed] [Google Scholar]
- 23.Zhu YP, Tsvankin I. Plane-wave propagation in attenuative transversely isotropic media. Geophysics. 2006 Mar-Apr;71:T17–T30. [Google Scholar]
- 24.Findley WN, Lai JS, Onaran K. Creep and relaxation of nonlinear viscoelastic materials: with an introduction to linear viscoelasticity: Dover. 1989 [Google Scholar]
- 25.Schiessel H, Metzler R, Blumen A, Nonnenmacher TF. Generalized viscoelastic models: Their fractional equations with solutions. Journal of Physics a-Mathematical and General. 1995 Dec 7;28:6567–6584. [Google Scholar]
- 26.Meral FC, Royston TJ, Magin R. Fractional calculus in viscoelasticity: An experimental study. Communications in Nonlinear Science and Numerical Simulation. 2010 Apr;15:939–945. [Google Scholar]
- 27.Loh PR, Oskooi AF, Ibanescu M, Skorobogatiy M, Johnson SG. Fundamental relation between phase and group velocity, and application to the failure of perfectly matched layers in backward-wave structures. Physical Review E. 2009 Jun;79 doi: 10.1103/PhysRevE.79.065601. [DOI] [PubMed] [Google Scholar]
- 28.Deffieux T, Montaldo G, Tanter M, Fink M. Shear wave spectroscopy for in vivo quantification of human soft tissues visco-elasticity. IEEE Trans Med Imaging. 2009 Mar;28:313–22. doi: 10.1109/TMI.2008.925077. [DOI] [PubMed] [Google Scholar]
- 29.Zhu YP, Tsvankin I, Dewangan P, van Wijk K. Physical modeling and analysis of P-wave attenuation anisotropy in transversely isotropic media. Geophysics. 2007 Jan-Feb;72:D1–D7. [Google Scholar]
- 30.Dellinger JA. Ph.D. Department of Geophysics; Stanford University: 1991. Anisotropic Seismic Wave Propagation. [Google Scholar]
- 31.Mahan GD. Applied Mathematics. Springer; US: 2001. [Google Scholar]
- 32.Destrade M, Mac Donald B, Murphy JG, Saccomandi G. At least three invariants are necessary to model the mechanical response of incompressible, transversely isotropic materials. Computational Mechanics. 2013 Oct;52:959–969. [Google Scholar]
- 33.Chadwick P. Wave Propagation in Incompressible Transversely Isotropic Elastic Media II. Inhomogeneous Plane Waves. Proceedings of the Royal Irish Academy. Section A: Mathematical and Physical Sciences. 1994 Jul;94A:85–104. 1994. [Google Scholar]
- 34.Royer D, Gennisson J-L, Deffieux T, Tanter M. On the elasticity of transverse isotropic soft tissues (L) The Journal of the Acoustical Society of America. 2011;129:2757–60. doi: 10.1121/1.3559681. [DOI] [PubMed] [Google Scholar]
- 35.ABAQUS Documentation. Dassault Systems; Providence, RI, USA: 2011. [Google Scholar]
- 36.Palmeri ML, Sharma AC, Bouchard RR, Nightingale RW, Nightingale KR. A finite- element method model of soft tissue response to impulsive acoustic radiation force. IEEE transactions on ultrasonics, ferroelectrics, and frequency control. 2005 Oct;52:1699–712. doi: 10.1109/tuffc.2005.1561624. [DOI] [PMC free article] [PubMed] [Google Scholar]
- 37.Bernal M, Nenadic I, Urban MW, Greenleaf JF. Material property estimation for tubes and arteries using ultrasound radiation force and analysis of propagating modes. Journal of the Acoustical Society of America. 2011 Mar;129:1344–1354. doi: 10.1121/1.3533735. [DOI] [PMC free article] [PubMed] [Google Scholar]
- 38.Aristizabal S, Amador C, Qiang B, Kinnick RR, Nenadic IZ, Greenleaf JF, Urban MW. Shear wave vibrometry evaluation in transverse isotropic tissue mimicking phantoms and skeletal muscle. Physics in Medicine and Biology. doi: 10.1088/0031-9155/59/24/7735. In press. [DOI] [PMC free article] [PubMed] [Google Scholar]
- 39.Montaldo G, Tanter M, Bercoff J, Benech N, Fink M. Coherent plane-wave compounding for very high frame rate ultrasonography and transient elastography. IEEE transactions on ultrasonics, ferroelectrics, and frequency control. 2009;56:489–506. doi: 10.1109/TUFFC.2009.1067. [DOI] [PubMed] [Google Scholar]
- 40.Loupas T, Peterson RB, Gill RW. Experimental evaluation of velocity and power estimation for ultrasound blood flow imaging, by means of a two-dimensional autocorrelation approach. Ultrasonics, Ferroelectrics and Frequency Control, IEEE Transactions on. 1995;42:689–699. [Google Scholar]
- 41.Papazoglou S, Hamhaber U, Braun J, Sack I. Algebraic Helmholtz inversion in planar magnetic resonance elastography. Physics in medicine and biology. 2008 Jun 21;53:3147–58. doi: 10.1088/0031-9155/53/12/005. [DOI] [PubMed] [Google Scholar]
- 42.Zhao H, Urban M, Greenleaf J, Shigao C. Ultrasonics Symposium (IUS) IEEE; 2010. Elasticity and viscosity estimation from shear wave velocity and attenuation: A simulation study; pp. 1604–1607. 2010. [Google Scholar]
- 43.Nenadic I, Urban MW, Qiang B, Chen S, Greenleaf J. Model-free quantification of shear wave velocity and attenuation in tissues and its in vivo application. The Journal of the Acoustical Society of America. 2013 Nov;134:4011. [Google Scholar]
- 44.Provost J, Papadacci C, Arango JE, Imbault M, Fink M, Gennisson JL, Tanter M, Pernot M. 3D ultrafast ultrasound imaging in vivo. Physics in medicine and biology. 2014 Oct 7;59:L1–L13. doi: 10.1088/0031-9155/59/19/L1. [DOI] [PMC free article] [PubMed] [Google Scholar]


