

Abstract
Serous borderline tumor (SBT) also known as atypical proliferative serous tumor (APST) is the precursor of ovarian low-grade serous carcinoma (LGSC). In this study, we correlated the morphologic and immunohistochemical phenotypes of 71 APSTs and 18 LGSCs with the mutational status of KRAS and BRAF, the most common molecular genetic changes in these neoplasms. A subset of cells characterized by abundant eosinophilic cytoplasm (EC), discrete cell borders and bland nuclei was identified in all (100%) 25 BRAF mutated APSTs but in only 5 (10%) of 46 APSTs without BRAF mutations (p<0.0001). Among the 18 LGSCs, EC cells were found in only 2 and both contained BRAF mutations. The EC cells were present admixed with cuboidal and columnar cells lining the papillae and appeared to be budding from the surface, resulting in individual cells and clusters of detached cells “floating” above the papillae. Immunohistochemistry showed that the EC cells always expressed p16, a senescence-associated marker, and had a significantly lower Ki-67 labeling index than adjacent cuboidal and columnar cells (p=0.02). In vitro studies supported the interpretation that these cells were undergoing senescence as the same morphologic features could be reproduced in cultured epithelial cells by ectopic expression of BRAFV600E. Senescence was further established by markers such as SA-β-gal staining, expression of p16 and p21, and reduction in DNA synthesis. In conclusion, this study sheds light on the pathogenesis of this unique group of ovarian tumors by showing that BRAF mutation is associated with cellular senescence and the presence of a specific cell type characterized by abundant eosinophilic cytoplasm. This “oncogene-induced senescence” phenotype may represent a mechanism that prevents impedes progression of APSTs to LGSC.
Introduction
Serous carcinoma, the most common and lethal ovarian cancer, is composed of two types, low-grade serous carcinoma (LGSC) and high-grade serous carcinoma (HGSC), which are characterized by distinctly different clinicopathological and molecular features 1, 2,3–5. It has been proposed that the immediate precursor of many HGSCs is an intraepithelial carcinoma in the fallopian tube, so-called “serous tubal intraepithelial carcinoma”, whereas the immediate precursor of most LGSCs is a noninvasive ovarian LGSC, also termed “serous borderline tumor, micropapillary variant”. The latter develops from a serous borderline tumor (SBT) also known as “atypical proliferative serous tumor (APST)”. While the majority of SBTs behave in a benign fashion, approximately 5% progress to LGSC which has a poor outcome for those with measurable disease after cytoreductive surgery 6. At present, there are no markers that reliably predict progression to LGSC and some pathologists, therefore, prefer the designation SBT to draw attention to this possibility, whereas other pathologists prefer the designation APST to emphasize the benign nature of most of these tumors recognizing that some benign tumors have the potential to progress to malignant neoplasms. The recent WHO Classification of Tumors of the Female Reproductive Organs considers both terms synonymous 7. In this manuscript the term APST is used.
In view of the uncertainty regarding the behavior of APSTs, patients and their physicians face a difficult dilemma in planning subsequent management, particularly for those women who present with advanced stage disease, as even the majority of these tumors do not progress to LGSC. The options are adjuvant chemotherapy, with its attendant potential complications, versus observation. In either case the anxiety associated with the uncertainty of the behavior of this tumor takes a significant emotional toll on the patient and her family. Accordingly, identification of a marker that reliably predicts outcome would be highly beneficial.
APST and LGSC are characterized by very low levels of DNA copy number changes as compared to other gynecologic tumors, reflecting relative genomic stability during tumor evolution8, 9. The most prominent molecular alterations so far described are somatic activating mutations of KRAS and BRAF, leading to their constitutive kinase activation. Approximately two thirds of APSTs contain either mutant KRAS or BRAF as the mutations are mutually exclusive10–12. Since KRAS and BRAF are involved in the MEK signaling pathway, it is believed that aberrant signaling activity of MEK, due to activating mutations in either KRAS or BRAF, plays a major role in the development of most APSTs13.
We have previously identified a population of cells in APSTs with abundant eosinophilic cytoplasm (EC) that showed a significant decrease in steroid hormone receptors (ER and PR), WT 1 and Ki-67 proliferation index compared to neighboring cuboidal and columnar cells lacking abundant eosinophilic cytoplasm, suggesting that the EC cells were senescent12,14. The current study presents immunohistochemical and molecular genetic evidence showing that the EC cells occur preferentially in tumors harboring mutant BRAF. Moreover, in vitro studies demonstrated that ectopic expression of BRAFV600E in epithelial cells induces cellular senescence, thereby providing compelling evidence that APSTs with mutant BRAF are undergoing senescence and that EC cells are a useful morphologic marker.
Materials and Methods
Identification and selection of cases
The study group consists of 89 cases of APSTs (n=71) and LGSC (n=18) derived from two study sets. Most APSTs (n=49) were selected from the files of the nationwide Danish Pathology Data Bank as previously described 12. The study was approved by the Danish Data Protection Agency and the Danish Scientific Ethical Committee. The remaining cases (22 cases of APST and 18 LGSC) were obtained from the pathology files of the Johns Hopkins Hospital. Acquisition of tissues specimen was approved by Institutional Review Board at the Johns Hopkins Hospital, Baltimore, Maryland. In addition to the primary ovarian tumor, sufficient tumor tissue was available from implants or metastatic lesions for 40 APSTs and 4 LGSCs. Bilateral APSTs were analyzed in 11 cases. This resulted in a total of 160 tumor lesions that were examined. Of the 71 APSTs 56 were advanced stage (FIGO II–IV), 6 were FIGO stage I and for 9 cases the information about FIGO stage was not accessible.
Morphologic evaluation and immunohistochemistry analysis
Sections of all 160 lesions were reviewed independently by two investigators (IMS, FZ) who were blinded to the clinical and mutational data. The number of cells with abundant eosinophilic cytoplasm (as previously described12, 14) was semi-quantitatively scored as a percentage of the total number of epithelial cells in a specimen as follows: not detectable (n.d.), <1 %, 1–25 %, and >25 % of epithelial tumor cells. Only cases with a sufficient amount of tumor cells (at least 400 tumor cells) were included. A subset of cases was selected for further immunohistochemical analysis. Sections were stained with anti-Ki-67 antibody (Ventana Medical Systems, Tucson, AZ; prediluted) and an anti-p16 antibody (Ventana Medical Systems, prediluted) and counterstained with either hematoxylin or eosin. The Ki-67 proliferation index was scored in a similar semi-quantitative manner by counting at least 400 cells and determining the percentage of positive cells. The EC and cuboidal/columnar cell populations were counted separately. p16 immunoreactivity in EC cells was reported as positive (both nuclear and cytoplasmic) or negative. Immunostaining with the mouse monoclonal VE1 antibody was used to detect mutant BRAF protein (V600E) as described previously (Spring Bioscience, Pleasanton, California, USA; 1:250) 12. It has been shown that APSTs with BRAF V600E mutations were all positive for VE1 immunoreactivity while none of the wild-type BRAF specimens were positive for VE112. VE1 immunohistochemistry was applied to determine the BRAF mutation status in six cases of which the mutational analysis was unsuccessful.
Mutational analysis
Mutational analysis was performed using the conventional Sanger sequencing technique in KRAS at exon 2 including codons 12–13 and BRAF at exon 15 including codon 600 as previously described11. PCR amplification was performed using genomic DNA from micro-dissected FFPE tissue with the following primers for exon 15 of BRAF: forward 5′-TGCTTGCTCTGATAGGAAAATGA-3′ and reverse 5′-CCACAAAATGGATCCAGACAAC-3′; for exon 2–3 of KRAS: forward 5′-TAAGGCCTGCTGAAAATGACTG-3′ and KRAS reverse 5′-TGGTCCTGCACCAGTAATATGC-3′. Amplified PCR products were sequenced at the Beckman Coulter, Inc., (Danvers, MA, USA) and analyzed with the Mutation Surveyor DNA Variant Analysis Software. Mutational analysis was successful in 83 cases. In additional six APSTs, that could not be analyzed for their mutational status, positive BRAF VE1 staining was used as a surrogate for BRAFV600E mutation.
Cell culture and Transduction
Primary human ovarian surface epithelial cells were prepared from ovaries obtained during prophylactic oophorectomies as described previously15. The cells were cultured in medium 199 and MCDB-105 (1:1) supplemented with 4% fetal bovine serum and 0.2 units/ml of insulin16. pBABE-puro and pBABE-puro-BRAFV600E were obtained from Addgene (Cambridge, MA). Retrovirus production and transduction were performed as described17, using Phoenix cells to package the viruses (a gift from Dr. Gary Nolan, Stanford University). Cells infected with viruses encoding drug resistant gene to puromycin were selected in 1μg/ml. FG12-CMV-Lenti-GFP and FG12-CMV-Lenti-GFP-BRAFV600E were kindly provided by Dr. Daniel Peeper. Lentivirus was packaged using Virapower Kit from Invitrogen following manufacturer’s instruction as described previously18.
Immunofluorescence, BrdU labeling and SA-β-gal staining
The following antibodies were obtained from indicated suppliers: mouse anti-BrdU FITC (BD Bioscience), mouse anti-p21 (Santa Cruz), mouse anti-BRAF (Santa Cruz), mouse anti-β-actin (Abcam)19, and mouse anti-p16 was a gift from Dr. Greg Enders. Immunofluorescence staining and BrdU labeling for cultured cells were performed as previously described using the antibodies listed above16,18. SA-β-Gal staining was performed as previously described20.
Statistical analysis
All calculations were done using the statistical software environment R, version 3.1.0 and Graph Pad Prism Version 5.0. Statistical significance was set at the level of 0.05.
Results
Morphologic examination of 71 APSTs including 25 with BRAF mutations, 29 with KRAS mutations and 17 with wild-type BRAF and KRAS revealed a population of epithelial cells containing abundant eosinophilic cytoplasm and discrete cell borders (EC) cells. The nuclei tended to be round with a smooth nuclear membrane and contained faintly staining chromatin. Mitotic figures were not observed in these cells. These cells were adjacent to cuboidal and columnar cells with round to oval nuclei in which the nuclear chromatin was more distinct and coarser and which were devoid of abundant eosinophilic cytoplasm. The EC cells appeared to bud from the overlying epithelial layer of the APST (Fig. 1). They were often detached from the epithelium, floating freely above the epithelial layer of the tumor and in one case in the underlying stroma of the tumor, so-called “microinvasion”. Using >1% EC cells as a cut point, it was found that they were present in all 25 APSTs harboring mutant BRAF, in 4 (14%) of 29 APSTs with KRAS mutation and in one (6%) of 17 APSTs with wild-type KRAS and BRAF (Table 1). The mutation status of APST according to clinical stages is summarized in Table 2. Because mutations of KRAS and BRAF are mutually exclusive, we combined the mutant KRAS and wild type KRAS/BRAF groups into one group, designated the “BRAF wild-type” group, and observed that EC cells were significantly more often present in the BRAF mutated than the wild-type group (p< 0.0001, Fisher’s exact test, two-tailed).
Fig. 1.

Fig. 1A. Eosinophilic cells (EC) in an APST with mutant BRAFV600E are present on the surface of papillae along with cuboidal and columnar cells. Many EC cells are detached (arrows), floating above the surface of papillae. They are characterized by abundant eosinophilic cytoplasm and discrete cell borders. The nuclei are mostly round with a smooth nuclear membrane and contain faintly staining chromatin. EC cells appear to bud from cuboidal/columnar epithelial cells on the surface of the papillae. 1B. Another APST without BRAF mutation does not demonstrate any EC cells.
Table 1.
Summary of APST cases showing cells with abundant eosinophilic cytoplasm (EC).
| Mutational Status | EC cells present | EC cells absent | Total | |
|---|---|---|---|---|
| BRAF-mutα |
 * *
|
25 | 0 | 25 |
| BRAF-wt | 5 | 41 | 46 | |
| KRAS-mut | (4) | (25) | (29) | |
| BRAF/KRAS-wt | (1) | (16) | (17) |
P< 0.0001, Fisher’s exact test, two-tailed
for 6 APST, BRAF mutation was assumed after mutational analysis failed, but VE1 IHC stained positive
mut: mutant, wt: wild-type
Table 2.
Mutational status and FIGO stage of APST (n=71)
| BRAF-Mut | KRAS-Mut | WT | ||
|---|---|---|---|---|
| FIGO STAGE | n.a. | 7 | 1 | 1 |
| I | 6 | - | - | |
| II | 5 | 12 | 5 | |
| III | 6 | 16 | 11 | |
| IV | 1 | - | - |
Mut: somatic mutation; WT: wild-type KRAS and BRAF; n.a. not accessible.
Immunohistochemical staining revealed that the EC cells in contrast to the adjacent cuboidal/columnar cells were intensely stained for both nuclear and cytoplasmic p16, a senescence-associated marker21, 22 and were essentially negative for Ki-67, a proliferative marker (Fig. 2 and Fig. 3). EC cells had a significantly lower Ki-67 index than the cuboidal/columnar cells (p=0.02, paired two-tailed t-test). Occasional apoptotic cells adjacent to EC cells were also observed (Fig. 2B). They were positive for M30 staining, an apoptotic marker.
Fig. 2.

An APST harboring mutant BRAFV600 showing expression of Ki-67 and p16 A. EC cells tend to be Ki-67 negative and strongly and diffusely p16 positive. B. EC cells (arrows) showing senescent features characterized by nuclei with washed out indistinct chromatin (arrows). Apoptotic cells (Apo) are positive for an apoptotic marker, M30.
Fig. 3.
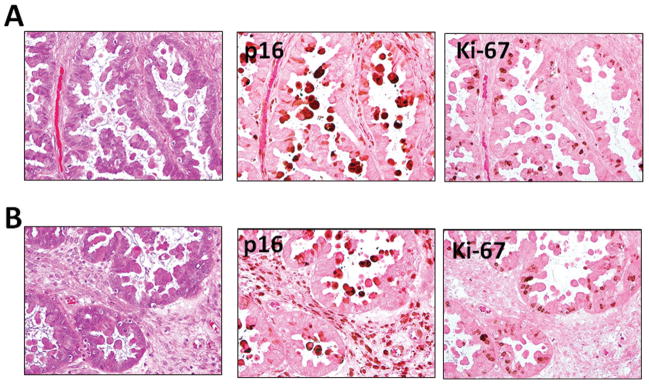
Immunostaining pattern of p16 and Ki-67 in an APST. EC cells that are positive for p16 and are devoid of Ki-67 immunoreactivity. A and B represents two different areas from the same case and the slides were counterstained with eosin only to reveal the abundant cytoplasm in EC cells.
In our previous study, almost all primary APSTs and their concurrent implants were found to have the same mutation status of KRAS and BRAF 12. In this study, there were 40 APSTs with at least one concurrent peritoneal implant that were available for study. Among them, 37 (92.5%) showed the same morphologic features in the primary tumor and implant in terms of the presence or absence of EC cells. Similar concordance of EC cells was observed in 10 (91%) of 11 bilateral APSTs. Two implants, one with many EC cells positive for VE1 and another without EC cells negative for VE1 are shown in Fig. 4. Interestingly, the cases in which there was discordance of EC cells between the primary tumors and implants occurred only in tumors and implants with mutant KRAS (3 of 23 cases). Those discordant cases include two with EC cells in the primary tumors but not in the implants and one case in which the primary tumor lacked EC cells, but they were present in the implants. All the cases with mutant BRAF and wild-type KRAS and BRAF showed concordant morphologic features in both the primary tumor and implants (17 of 17 cases), i.e. presence of EC cells in mutant BRAF cases and absent EC cells in both primary tumor and corresponding implant(s) in cases wild-type for KRAS and BRAF.
Fig. 4.

A. VE1 positive desmoplastic non-invasive implant contains many EC cells, identical to the EC cells in foci of “microinvasion” (arrows). B. VE1 negative implant does not contain EC cells.
The above findings suggest that mutant BRAF protein may induce changes resulting in the development of EC cells that we interpreted on morphologic grounds as evidence of cellular senescence. To test this hypothesis, we ectopically expressed mutant BRAFV600E in human ovarian surface epithelial (HOSE) cells (Fig. 5). HOSE cells expressing BRAFV600E had a greater percentage of cells that were positive for SA-β-gal stain, a conventional marker of cellular senescence, than the control cells (27% vs. 3%). Immunofluorescent staining, also demonstrated that compared to control cells, HOSE cells expressing BRAFV600E, had a much greater number of cells positive for p16 and p21, two proteins that are upregulated during cellular senescence. In contrast, in a BrdU incorporation study BRAFV600E transfected cells showed a decrease in DNA synthesis as compared to control cells (Fig. 5).
Fig. 5.

A. Western blot analysis shows expression of mutant BRAF protein in primary human ovarian surface epithelial (HOSE) cells transduced with the BRAFV600E expressing construct. B. SA-β-gal activity in primary HOSE cells expressing BRAFV600E. Arrows point to large, flat SA-β gal positive senescent cells. C. BrdU incorporation is decreased in primary HOSE cells expressing BRAFV600E as compared to control non-transduced cells. Arrows point to BrdU positive cells (BrdU in red and cell nuclei counterstained with DAPI in blue). D. Expression of BRAFV600E in HOSE cells in culture results in an increase in p16 and p21. Cells were engineered to co-express nuclear GFP when they were transfected with the expression plasmids. The fluorescence images were merged in the rightmost panel.
Discussion
Cellular senescence is a fundamental biological phenomenon involved in embryogenesis, tissue development and various pathobiological conditions 23. While it has been extensively studied in cell culture, microscopic characterization of senescence in tissue sections has not been well described. In this study, we identified a population of epithelial cells in APSTs characterized by abundant eosinophilic cytoplasm (EC), distinct cell borders, nuclei with faintly staining chromatin, strong expression of p16 and loss of proliferative activity as evidenced by essentially no Ki-67 immunoreactivity. These features are commonly seen in senescent cells in vitro. The EC cells, along with cuboidal and columnar cells, comprise the cellular population that lines the papillae of the APSTs. The latter two cell types have relatively scant cytoplasm, bland, round to oval nuclei and are frequently ciliated. The EC cells tend to be rounder, less frequently ciliated and are closely apposed to the cuboidal and columnar cells. When there is cellular stratification they tend to be at a slightly higher level than the cuboidal/columnar cells, approaching the surface of the papillae and then detaching, acquiring more abundant eosinophilic cytoplasm and losing their cilia in the process. As a consequence they appear to “float” above the papillae and occasionally are present in the underlying stroma, so-called “microinvasion”. Mitotic figures are present only in the cuboidal and columnar cells. Occasional apoptotic cells adjacent to the EC cells are also evident. The entire process appears to reflect senescence manifested by transformation of cuboidal and columnar cells to EC cells. This interpretation is supported by a previous study in which we demonstrated that compared to the cuboidal and columnar cells, the EC cells showed a significant decrease in ER, PR, WT1 and Ki-67 labeling index 14. In the present study we found that the EC cells are specifically associated with BRAF mutations as they were detected in 100% of APSTs with BRAF mutations but in only 10% of APSTs with wild-type BRAF and KRAS or KRAS mutations, suggesting that they are a morphologic marker of BRAF mutation in these tumors. The above finding was confirmed by our in vitro cell culture studies showing that mutant BRAF leads to the development of senescent cells with similar morphologic features. Expression of p16 and absence of Ki-67 labeling has been previously reported in senescent cells in colorectal adenomatous polyps with BRAF mutations22.
The findings in this study are reminiscent of “oncogene-induced senescence”, a well-established mechanism that impedes cancer development in humans24, 25 in which oncogenic stress induced by an oncogenic protein such as mutant BRAF protein leads to DNA double strand breaks in non-transformed epithelial cells. This activates the DNA damage response that is responsible for growth inhibition and induction of senescence through activation of p53-p21 and p16 pathways21, 26–29. As TP53 mutations are exceptionally rare in APSTs, the intact p53 protein may serve as the upstream checkpoint control that triggers the senescence pathway in BRAF mutated APSTs.
Our study raises a number of intriguing questions. First, if BRAF mutations result in cellular senescence in APSTs, why is this genotype clonally selected in many of them? We postulate that BRAF mutation, like KRAS mutation, is required for tumor initiation, because mutations in both genes have multiple tumor-promoting effects including upregulation of glucose transporter-1 (GLUT1), an essential surface protein that results in an increase in glucose metabolism required for tumor transformation 27. Once an APST develops, the epithelial cells may initiate a mechanism to restrain tumor progression as occurs in many benign human neoplasms, including colorectal adenomatous polyps and melanocytic nevi30–32. This may account for why BRAF mutated advanced stage LGSCs are much less common than BRAF mutated advanced stage APSTs 33,34,12,35.
Second, how do tumors that progress to LGSC overcome the senescence induced by BRAF mutations? We suspect that as with the progression of precursor lesions to frankly malignant tumors, for example as occurs in melanoma and lung cancer36, 37, additional molecular genetic alterations occur during progression from an APST to an LGSC, that abolish the checkpoint control by the p53-p21 and p16 pathways. We have previously analyzed the genome-wide copy number alterations in ovarian low-grade serous neoplasms and reported that hemizygous ch1p36 deletion and ch9p21 homozygous or hemizygous deletions are much more common in ovarian LGSCs than in APSTs8. The ch1p36 region contains several candidate tumor suppressors including miR-34a which is required for DNA damage response and is the direct p53 target that mediates its tumor suppressor functions38, 39. Likewise, the ch9p21 region corresponding to the CDKN2A/B locus encodes three well-known tumor suppressor proteins, p14 (Arf), p16 and p15 that inhibit cyclin-dependent kinase. Thus, deletions or silencing of miR-34a and CDKN2A/B loci may abrogate the p53 checkpoint on BRAF mutations and permit APSTs to escape senescence and progress to LGSC. In this regard, it has been reported that p16 expression levels are significantly decreased in LGSCs as compared to APSTs40. Finally, why are EC cells more commonly detected in BRAF mutated than KRAS mutated APSTs? It has been demonstrated that KRAS and BRAF kinases may form their own unique signaling networks in addition to the shared function in activating MEK signaling41–43. Therefore, in APSTs it is likely that although mutations of KRAS and BRAF contribute equally to tumor initiation, they may have different functions after the tumor has developed. Tumors with mutant BRAF undergo senescence, characterized by the presence of EC cells, whereas APSTs with mutant KRAS or wild type BRAF and KRAS are less likely to undergo senescence and therefore do not express the EC phenotype. Furthermore, after cytoreductive surgery occult implants harboring mutant BRAF are likely to undergo cellular senescence and have a reduced risk for recurrence and progression. In conclusion, this study provides new evidence that mutation of BRAF appears to have a paradoxical effect, acting as a driver mutation for initiation of an APST while also apparently inhibiting progression to LGSC. This finding sheds light on the pathogenesis of this unique group of ovarian tumors which has perplexed pathologists and gynecologists for over half a century. The study also has important clinical implications by correlating a specific morphologic phenotype, namely, EC cells with BRAF mutation, thereby providing pathologists with the ability to identify a group of APSTs that are likely to behave in a benign fashion from those that are more likely to progress to LGSC. This would allow gynecologists to target a group of patients for close surveillance and possibly further treatment while sparing another group of patients additional, and potentially harmful treatment. Although highly provocative, our conclusions must be validated by larger clinicopathologic studies.
Acknowledgments
This study was supported by a research grant, RO1CA116184, from NIH/NCI. F.Z. was supported by the Rotation Program of the Medical Faculty RWTH Aachen, Germany, Katie Oppo Research Fund and Colleen’s Dream Foundation. L.A. was supported by Fondazione Beretta (Brescia, Italy) and by the International Society of Gynecologic Pathologists Hernando Salazar Fellowship Award 2011. RZ is supported by NIH/NCI grants: R01CA160331 and R01CA163377.
Footnotes
Conflict of interest statement: There is no conflict of interest in any of the authors.
References
- 1.Shih Ie M, Kurman RJ. Molecular pathogenesis of ovarian borderline tumors: new insights and old challenges. Clin Cancer Res. 2005;11:7273–9. doi: 10.1158/1078-0432.CCR-05-0755. [DOI] [PubMed] [Google Scholar]
- 2.Cho KR, Shih IM. Ovarian cancer. Annu Rev Pathol Mech Dis. 2009;4:287–313. doi: 10.1146/annurev.pathol.4.110807.092246. [DOI] [PMC free article] [PubMed] [Google Scholar]
- 3.Shih Ie M, Chen L, Wang CC, Gu J, Davidson B, Cope L, Kurman RJ, Xuan J, Wang TL. Distinct DNA methylation profiles in ovarian serous neoplasms and their implications in ovarian carcinogenesis. Am J Obstet Gynecol. 2010;203:584, e1–22. doi: 10.1016/j.ajog.2010.08.003. [DOI] [PMC free article] [PubMed] [Google Scholar]
- 4.Fader AN, Java J, Krivak TC, Bristow RE, Tergas AI, Bookman MA, Armstrong DK, Tanner EJ, Gershenson DM. The prognostic significance of pre- and post-treatment CA-125 in grade 1 serous ovarian carcinoma: A Gynecologic Oncology Group study. Gynecologic Oncology. 2013 doi: 10.1016/j.ygyno.2013.11.016. [DOI] [PMC free article] [PubMed] [Google Scholar]
- 5.May T, Shoni M, Crum CP, Xian W, Vathipadiekal V, Birrer M, Rosen B, Tone A, Murphy KJ. Low-grade and high-grade serous Mullerian carcinoma: review and analysis of publicly available gene expression profiles. Gynecologic Oncology. 2013;128:488–92. doi: 10.1016/j.ygyno.2012.12.009. [DOI] [PubMed] [Google Scholar]
- 6.Fader AN, Java J, Ueda S, Bristow RE, Armstrong DK, Bookman MA, Gershenson DM. Survival in women with grade 1 serous ovarian carcinoma. Obstet Gynecol. 2013;122:225–32. doi: 10.1097/AOG.0b013e31829ce7ec. [DOI] [PMC free article] [PubMed] [Google Scholar]
- 7.Seidman JD, Bell DA, Crum CP, Gilks B, Kurman R, Levine DA, Longacre TA, Pacini B, Riva C, Sherman ME, Shih IM, Singer G, Soslow R, Vang R. Tumors of the ovary- Serous borderline tumor/atypical proliferative serous tumor. In: Kurman RJ, Carcangiu ML, Herrington S, Young RH, editors. WHO Classification of Tumors of Female Reproductive Organs. Lyon: IARC; 2014. pp. 17–24. [Google Scholar]
- 8.Kuo KT, Guan B, Feng Y, Mao TL, Chen X, Jinawath N, Wang Y, Kurman RJ, Shih IM, Wang TL. Analysis of DNA copy number alterations in ovarian serous tumors identifies new molecular genetic changes in low-Grade and high-grade carcinomas. Cancer Res. 2009;69:4036–42. doi: 10.1158/0008-5472.CAN-08-3913. [DOI] [PMC free article] [PubMed] [Google Scholar]
- 9.Kuhn E, Wu RC, Guan B, Wu G, Zhang J, Wang Y, Song L, Yuan X, Wei L, Roden RB, Kuo KT, Nakayama K, Clarke B, Shaw P, Olvera N, Kurman RJ, Levine DA, Wang TL, Shih Ie M. Identification of Molecular Pathway Aberrations in Uterine Serous Carcinoma by Genome-wide Analyses. J Natl Cancer Inst. 2012;104:1503–13. doi: 10.1093/jnci/djs345. [DOI] [PMC free article] [PubMed] [Google Scholar]
- 10.Singer G, Oldt R, 3rd, Cohen Y, Wang BG, Sidransky D, Kurman RJ, Shih Ie M. Mutations in BRAF and KRAS characterize the development of low-grade ovarian serous carcinoma. J Natl Cancer Inst. 2003;95:484–6. doi: 10.1093/jnci/95.6.484. [DOI] [PubMed] [Google Scholar]
- 11.Jones S, Wang TL, Kurman RJ, Nakayama K, Velculescu VE, Vogelstein B, Kinzler KW, Papadopoulos N, Shih Ie M. Low-grade serous carcinomas of the ovary contain very few point mutations. J Pathol. 2012;226:413–20. doi: 10.1002/path.3967. [DOI] [PMC free article] [PubMed] [Google Scholar]
- 12.Ardighieri L, Zeppernick F, Hannibal CG, Vang R, Cope L, Junge J, Kjaer SK, Kurman RJ, Shih IM. Mutational Analysis of BRAF and KRAS in Ovarian Atypical Proliferative Serous (Borderline) Tumors and Associated Peritoneal Implants. J Pathol. 2014;232:19–22. doi: 10.1002/path.4293. [DOI] [PMC free article] [PubMed] [Google Scholar]
- 13.Pohl G, Ho CL, Kurman RJ, Bristow R, Wang TL, Shih Ie M. Inactivation of the mitogen-activated protein kinase pathway as a potential target-based therapy in ovarian serous tumors with KRAS or BRAF mutations. Cancer Res. 2005;65:1994–2000. doi: 10.1158/0008-5472.CAN-04-3625. [DOI] [PubMed] [Google Scholar]
- 14.Maniar KP, Wang Y, Visvanathan K, Shih IM, Kurman RJ. Evaluation of Microinvasion and Lymph Node Involvement in Ovarian Serous Borderline/Atypical Proliferative Serous Tumors: A Morphologic and Immunohistochemical Analysis of 37 Cases. Am J Surg Pathol. 2014 doi: 10.1097/PAS.0000000000000155. [DOI] [PMC free article] [PubMed] [Google Scholar]
- 15.Dyck HG, Hamilton TC, Godwin AK, Lynch HT, Maines-Bandiera S, Auersperg N. Autonomy of the epithelial phenotype in human ovarian surface epithelium: changes with neoplastic progression and with a family history of ovarian cancer. Int J Cancer. 1996;69:429–36. doi: 10.1002/(SICI)1097-0215(19961220)69:6<429::AID-IJC1>3.0.CO;2-6. [DOI] [PubMed] [Google Scholar]
- 16.Bitler BG, Nicodemus JP, Li H, Cai Q, Wu H, Hua X, Li T, Birrer MJ, Godwin AK, Cairns P, Zhang R. Wnt5a suppresses epithelial ovarian cancer by promoting cellular senescence. Cancer Res. 2011;71:6184–94. doi: 10.1158/0008-5472.CAN-11-1341. [DOI] [PMC free article] [PubMed] [Google Scholar]
- 17.Zhang R, Poustovoitov MV, Ye X, Santos HA, Chen W, Daganzo SM, Erzberger JP, Serebriiskii IG, Canutescu AA, Dunbrack RL, Pehrson JR, Berger JM, Kaufman PD, Adams PD. Formation of MacroH2A-containing senescence-associated heterochromatin foci and senescence driven by ASF1a and HIRA. Dev Cell. 2005;8:19–30. doi: 10.1016/j.devcel.2004.10.019. [DOI] [PubMed] [Google Scholar]
- 18.Aird KM, Zhang G, Li H, Tu Z, Bitler BG, Garipov A, Wu H, Wei Z, Wagner SN, Herlyn M, Zhang R. Suppression of nucleotide metabolism underlies the establishment and maintenance of oncogene-induced senescence. Cell Rep. 2013;3:1252–65. doi: 10.1016/j.celrep.2013.03.004. [DOI] [PMC free article] [PubMed] [Google Scholar]
- 19.Zhang R, Chen W, Adams PD. Molecular dissection of formation of senescence-associated heterochromatin foci. Mol Cell Biol. 2007;27:2343–58. doi: 10.1128/MCB.02019-06. [DOI] [PMC free article] [PubMed] [Google Scholar]
- 20.Dimri GP, Lee X, Basile G, Acosta M, Scott G, Roskelley C, Medrano EE, Linskens M, Rubelj I, Pereira-Smith O, et al. A biomarker that identifies senescent human cells in culture and in aging skin in vivo. Proc Natl Acad Sci U S A. 1995;92:9363–7. doi: 10.1073/pnas.92.20.9363. [DOI] [PMC free article] [PubMed] [Google Scholar]
- 21.Michaloglou C, Vredeveld LC, Soengas MS, Denoyelle C, Kuilman T, van der Horst CM, Majoor DM, Shay JW, Mooi WJ, Peeper DS. BRAFE600-associated senescence-like cell cycle arrest of human naevi. Nature. 2005;436:720–4. doi: 10.1038/nature03890. [DOI] [PubMed] [Google Scholar]
- 22.Kriegl L, Neumann J, Vieth M, Greten FR, Reu S, Jung A, Kirchner T. Up and downregulation of p16(Ink4a) expression in BRAF-mutated polyps/adenomas indicates a senescence barrier in the serrated route to colon cancer. Mod Pathol. 2011;24:1015–22. doi: 10.1038/modpathol.2011.43. [DOI] [PubMed] [Google Scholar]
- 23.Hayflick L, Moorhead PS. The serial cultivation of human diploid cell strains. Exp Cell Res. 1961;25:585–621. doi: 10.1016/0014-4827(61)90192-6. [DOI] [PubMed] [Google Scholar]
- 24.Collado M, Gil J, Efeyan A, Guerra C, Schuhmacher AJ, Barradas M, Benguria A, Zaballos A, Flores JM, Barbacid M, Beach D, Serrano M. Tumour biology: senescence in premalignant tumours. Nature. 2005;436:642. doi: 10.1038/436642a. [DOI] [PubMed] [Google Scholar]
- 25.Collado M, Serrano M. Senescence in tumours: evidence from mice and humans. Nat Rev Cancer. 2010;10:51–7. doi: 10.1038/nrc2772. [DOI] [PMC free article] [PubMed] [Google Scholar]
- 26.Haffner MC, De Marzo AM, Meeker AK, Nelson WG, Yegnasubramanian S. Transcription-induced DNA double strand breaks: both oncogenic force and potential therapeutic target? Clin Cancer Res. 2011;17:3858–64. doi: 10.1158/1078-0432.CCR-10-2044. [DOI] [PMC free article] [PubMed] [Google Scholar]
- 27.Sheu JJ, Guan B, Tsai FJ, Hsiao EY, Chen CM, Seruca R, Wang TL, Shih Ie M. Mutant BRAF induces DNA strand breaks, activates DNA damage response pathway, and up-regulates glucose transporter-1 in nontransformed epithelial cells. Am J Pathol. 2012;180:1179–88. doi: 10.1016/j.ajpath.2011.11.026. [DOI] [PMC free article] [PubMed] [Google Scholar]
- 28.KCS, Carcamo JM, Golde DW. Antioxidants prevent oxidative DNA damage and cellular transformation elicited by the over-expression of c-MYC. Mutation Res. 2006;593:64–79. doi: 10.1016/j.mrfmmm.2005.06.015. [DOI] [PubMed] [Google Scholar]
- 29.Vogelstein B, Lane D, Levine AJ. Surfing the p53 network. Nature. 2000;408:307–10. doi: 10.1038/35042675. [DOI] [PubMed] [Google Scholar]
- 30.Bartkova J, Horejsi Z, Koed K, Kramer A, Tort F, Zieger K, Guldberg P, Sehested M, Nesland JM, Lukas C, Orntoft T, Lukas J, Bartek J. DNA damage response as a candidate anti-cancer barrier in early human tumorigenesis. Nature. 2005;434:864–70. doi: 10.1038/nature03482. [DOI] [PubMed] [Google Scholar]
- 31.Bartkova J, Rezaei N, Liontos M, Karakaidos P, Kletsas D, Issaeva N, Vassiliou LV, Kolettas E, Niforou K, Zoumpourlis VC, Takaoka M, Nakagawa H, Tort F, Fugger K, Johansson F, Sehested M, Andersen CL, Dyrskjot L, Orntoft T, Lukas J, Kittas C, Helleday T, Halazonetis TD, Bartek J, Gorgoulis VG. Oncogene-induced senescence is part of the tumorigenesis barrier imposed by DNA damage checkpoints. Nature. 2006;444:633–7. doi: 10.1038/nature05268. [DOI] [PubMed] [Google Scholar]
- 32.Gorgoulis VG, Vassiliou LV, Karakaidos P, Zacharatos P, Kotsinas A, Liloglou T, Venere M, Ditullio RA, Jr, Kastrinakis NG, Levy B, Kletsas D, Yoneta A, Herlyn M, Kittas C, Halazonetis TD. Activation of the DNA damage checkpoint and genomic instability in human precancerous lesions. Nature. 2005;434:907–13. doi: 10.1038/nature03485. [DOI] [PubMed] [Google Scholar]
- 33.Grisham RN, Iyer G, Garg K, DeLair D, Hyman DM, Zhou Q, Iasonos A, Berger MF, Dao F, Spriggs DR, Levine DA, Aghajanian C, Solit DB. BRAF mutation is associated with early stage disease and improved outcome in patients with low-grade serous ovarian cancer. Cancer. 2013;119:548–54. doi: 10.1002/cncr.27782. [DOI] [PMC free article] [PubMed] [Google Scholar]
- 34.Wong KK, Tsang YT, Deavers MT, Mok SC, Zu Z, Sun C, Malpica A, Wolf JK, Lu KH, Gershenson DM. BRAF mutation is rare in advanced-stage low-grade ovarian serous carcinomas. Am J pathol. 2010;177:1611–7. doi: 10.2353/ajpath.2010.100212. [DOI] [PMC free article] [PubMed] [Google Scholar]
- 35.Farley J, Brady WE, Vathipadiekal V, Lankes HA, Coleman R, Morgan MA, Mannel R, Yamada SD, Mutch D, Rodgers WH, Birrer M, Gershenson DM. Selumetinib in women with recurrent low-grade serous carcinoma of the ovary or peritoneum: an open-label, single-arm, phase 2 study. Lancet Oncol. 2013;14:134–40. doi: 10.1016/S1470-2045(12)70572-7. [DOI] [PMC free article] [PubMed] [Google Scholar]
- 36.Dankort D, Filenova E, Collado M, Serrano M, Jones K, McMahon M. A new mouse model to explore the initiation, progression, and therapy of BRAFV600E-induced lung tumors. Genes & development. 2007;21:379–84. doi: 10.1101/gad.1516407. [DOI] [PMC free article] [PubMed] [Google Scholar]
- 37.Dankort D, Curley DP, Cartlidge RA, Nelson B, Karnezis AN, Damsky WE, Jr, You MJ, DePinho RA, McMahon M, Bosenberg M. Braf(V600E) cooperates with Pten loss to induce metastatic melanoma. Nature genetics. 2009;41:544–52. doi: 10.1038/ng.356. [DOI] [PMC free article] [PubMed] [Google Scholar]
- 38.Kato M, Paranjape T, Muller RU, Nallur S, Gillespie E, Keane K, Esquela-Kerscher A, Weidhaas JB, Slack FJ. The mir-34 microRNA is required for the DNA damage response in vivo in C. elegans and in vitro in human breast cancer cells. Oncogene. 2009;28:2419–24. doi: 10.1038/onc.2009.106. [DOI] [PMC free article] [PubMed] [Google Scholar]
- 39.He L, He X, Lim LP, de Stanchina E, Xuan Z, Liang Y, Xue W, Zender L, Magnus J, Ridzon D, Jackson AL, Linsley PS, Chen C, Lowe SW, Cleary MA, Hannon GJ. A microRNA component of the p53 tumour suppressor network. Nature. 2007;447:1130–4. doi: 10.1038/nature05939. [DOI] [PMC free article] [PubMed] [Google Scholar]
- 40.Schlosshauer PW, Deligdisch L, Penault-Llorca F, Fatemi D, Qiao R, Yao S, Pearl M, Yang Z, Sheng T, Dong J. Loss of p16INK4A expression in low-grade ovarian serous carcinomas. Int J Gynecol Pathol. 2011;30:22–9. doi: 10.1097/PGP.0b013e3181ed89b3. [DOI] [PubMed] [Google Scholar]
- 41.Downward J. Targeting RAS signalling pathways in cancer therapy. Nat Rev Cancer. 2003;3:11–22. doi: 10.1038/nrc969. [DOI] [PubMed] [Google Scholar]
- 42.Blasco RB, Francoz S, Santamaria D, Canamero M, Dubus P, Charron J, Baccarini M, Barbacid M. c-Raf, but not B-Raf, is essential for development of K-Ras oncogene-driven non-small cell lung carcinoma. Cancer Cell. 2011;19:652–63. doi: 10.1016/j.ccr.2011.04.002. [DOI] [PMC free article] [PubMed] [Google Scholar]
- 43.Chapman MS, Miner JN. Novel mitogen-activated protein kinase kinase inhibitors. Exp Opin Invest Drug. 2011;20:209–20. doi: 10.1517/13543784.2011.548803. [DOI] [PubMed] [Google Scholar]