

Abstract
S -Adenosyl-L-methionine (SAM) is recognized as an important cofactor in a variety of biochemical reactions. As more proteins and pathways that require SAM are discovered, it is important to establish a method to quickly identify and characterize SAM binding proteins. The affinity of S-adenosyl-L-homocysteine (SAH) for SAM binding proteins was used to design two SAH-derived capture compounds (CCs). We demonstrate interactions of the proteins COMT and SAHH with SAH–CC with biotin used in conjunction with streptavidin–horseradish peroxidase. After demonstrating SAH-dependent photo-crosslinking of the CC to these proteins, we used a CC labeled with a fluorescein tag to measure binding affinity via fluorescence anisotropy. We then used this approach to show and characterize binding of SAM to the PR domain of PRDM2, a lysine methyltransferase with putative tumor suppressor activity. We calculated the Kd values for COMT, SAHH, and PRDM2 (24.1 ± 2.2 μM, 6.0 ± 2.9 μM, and 10.06 ± 2.87 μM, respectively) and found them to be close to previously established Kd values of other SAM binding proteins. Here, we present new methods to discover and characterize SAM and SAH binding proteins using fluorescent CCs.
Keywords: Capture compound, Fluorescence anisotropy, S-Adenosyl-L-homocysteine, S-Adenosyl-L-methionine
The cofactor S-adenosyl-L-methionine (SAM)1 is used by SAMdependent methyltransferases to perform the same basic function— transfer a methyl group from SAM to a target molecule and produce S-adenosyl-L-homocysteine (SAH) as an end product [1]. SAM-dependent methyltransferases are known to mediate epigenetic regulation via DNA and histone methylation. The resulting modifications to DNA and histones are strongly associated with gene regulation as well as overall chromatin structure [2]. In addition to their function for epigenetic regulation, other members of the SAM-dependent methyltransferase superfamily have other targets that include non-histone proteins, RNA, and small molecules such as catechols, lipids, and sugars. Aside from its role in one-carbon metabolism via methylation, SAM is used for a variety of enzymatic reactions such as hydroxylation [3], formation of organohalogens [4], polyamine synthesis [5], queosine formation [6], cyclopropane fatty acid synthesis [7], and radical chemistry [8–10]. A review by Dalhoff and Weinhold highlighted several of these unique reactions [1]. Given the necessity of SAM binding proteins in epigenetics, metabolism, and messenger RNA translation among many other pathways, it is important to identify and characterize the multiple superfamilies of SAM binding proteins.
Capture compound mass spectrometry was recently developed to discover and identify binding partners for drug molecules in complex cell lysates [11]. The capture compounds (CCs) contain three moieties: a small molecule to specifically interact with the binding pocket(s) of a protein, a photoreactive group to form a covalent crosslink, and biotin to capture the CC–protein conjugates using streptavidin-coated magnetic beads. Following crosslinking and sorting, the CC–protein conjugates were digested and identified by mass spectrometry. After this technique was first used to isolate carbonic anhydrase from erythrocytes [11], additional compounds were designed to capture cyclic AMP binding proteins [12], matrix metalloproteinases [13], and kinases [14].
CCs may be used to circumvent and/or supplement lysate fractionation for functional assays to characterize protein binding and activity and may be a viable alternative to radiolabeling. Because SAM is unstable in aqueous solution, the ability of SAH to bind to the SAM binding pocket of SAM-dependent methyltransferases was exploited to create an SAH-derived CC. Interactions have been demonstrated between SAH–CC and bacterial methyltransferases [15]. Biotin–SAH–CC (Fig. 1) was also used to measure binding affinity. In that study, a titration with biotin–SAH–CC was performed to measure the binding affinity of modification methylase TaqI (M.TaqI), a bacterial methyltransferase. M.TaqI was photo-crosslinked with the biotin–SAH–CC under two conditions: increasing concentrations of biotin–SAH–CC and increasing concentrations of the competitor SAH with constant biotin–SAH–CC. The crosslinked M.TaqI was visualized by sodium dodecyl sulfate– polyacrylamide gel electrophoresis (SDS–PAGE) and silver staining. The binding constants for biotin–SAH–CC and SAH were determined by measuring the amount of crosslinked protein as visualized by silver stain. This technique can be used to measure binding constants; however, nonspecific crosslinking, inconsistent silver staining, and low crosslinking efficiency can lead to significant errors in measurement. To avoid the problems due to crosslinking and staining, a technique that measures binding affinity without the requirement of crosslinking is needed.
Fig. 1.
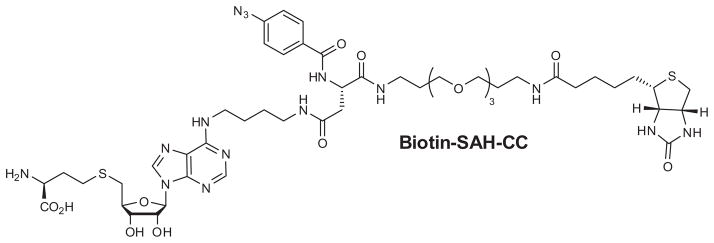
Biotin–SAH–CC with phenylazide moiety used for previous study [15] and the current study.
Fluorescence anisotropy measures changes in incident polarized light as a tumbling fluorophore binds to a larger molecule. A measurable increase in incident polarized light directly corresponds to the amount of bound fluorophore in equilibrium. Binding constants can be calculated from this measurement [16]. Here, we present a technique that uses a fluorescein isothiocyanate (FITC)-tagged SAH–CC to measure binding affinity via fluorescent anisotropy without crosslinking. The flexibly designed FITC–SAH– CC (Scheme 1) contains three moieties like its biotinylated counterpart: SAH to bind to the catalytic pocket, a photoactive group to form a covalent crosslink when needed (e.g., fluorescence readout of labeled proteins in SDS–PAGE; see Supplemental Fig. 1 in online supplementary material), and an FITC derivative for fluorescence detection.
Scheme 1.

Synthesis of FITC–SAH–CC from published core amine [15].
In this study, we present a new methodology using CC technology to examine interactions between proteins and SAM without the use of radiolabeled reagents [17].We used an SAH-derived biotin-tagged CC to evaluate specific labeling of catechol-O-methyltransferase (COMT), a known SAM-dependent methyltransferase, and S-adenosylhomocysteine hydrolase (SAHH), an SAH binding protein. We also determined Kd values of these proteins for FITC– SAH–CC using fluorescence anisotropy. Crosslinking was not needed or used for the anisotropy measurements. After verifying the suitability of these small-molecule probes for these purposes, we tested the binding interactions and affinity for PR domain zinc finger protein 2 (PRDM2), a lysine methyltransferase with an unmapped binding site for SAM/SAH. These results demonstrate the effective use of the SAH-derived CCs for characterizing SAM/SAH binding proteins.
Materials and methods
Synthesis of FITC–SAH–CC
FITC–scaffold
Diisopropylethylamine (DIPEA, 251 μl, 1.5 mmol) was added to a cold solution (0 °C) of core amine (194 mg, 293 μmol) [15] and FITC (114 mg, 293 μmol) in dimethylformamide (DMF, 5.8 ml) under light protection. After warming up to room temperature, the reaction mixture was stirred overnight. Full conversion was determined by liquid chromatography–mass spectrometry (LC– MS). After removing the solvent under reduced pressure and purification of the residue via basic medium-pressure liquid chromatography (MPLC, 0 → 30% MeOH), the product, FITC–scaffold, was obtained in 72% yield (198 mg, 211 μmol) as an orange amorphous solid.
1H NMR, MeOH-d4 δ: 8.13 (br. d, J = 2.0, 1H, HFlu), 7.95/7.33 (AA′/BB′, J = 8.3, 4H, Harom.), 7.77 (dd, J = 1.8, 8.2, 1H, HFlu), 7.14 (br. d, J = 8.3, 1H, HFlu), 6.81 (s, 1H, HFlu), 6.79 (s, 1H, HFlu), 6.68 (s, 1H, HFlu), 6.67 (s, 1H, HFlu), 6.59 (d, J = 2.4, 1H, HFlu), 6.57 (d, J = 2.4, 1H, HFlu), 4.78 (t, J = 6.4, 1H, C(18)-H), 3.72 (br. s, 2H, C(3)H2), 3.63–3.52 (m, 10H, C(5)H2–C(11)H2), 3.50 (t, J = 6.1, 2H, C(13)H2), 3.29–3.26 (m, 2H, C(15)H2), 2.72 (dd, J = 3.7, 6.5, 2H, C(1′)H2), 1.93 (quint, 2H, J = 6.3, C(4)H2), 1.74 (quint, 2H, J = 6.4, C(14)H2); 13C NMR, MeOH-d4 δ: 182.5 (C(1)), 177.5 (C(2′)), 173.8 (C(17)), 171.6 (CFlu), 168.4 (C(20)), 164.0, 155.1, 142.5 (3× CFlu), 136.7 (C(24)), 133.2 (C(21)), 130.8 (CFlu), 129.0 (C(22)), 127.6 (C(23)), 126.5 (CFlu), 123.4 (q, J = 274, C(26)), 115.1, 112.4, 103.6 (3× CFlu), 71.3 (C(8), C(10)), 71.1 (C(7), C(11)), 70.3 (C(5)), 69.8 (C(13)), 53.2 (C(18)), 43.6 (C(3)), 39.6 (C(1′)), 38.0 (C(15)), 30.2 (C(14)), 29.9 (C(4)), 29.4 (q, J = 41, C(25)); ESI–MS, m/z: 323 (10), 424 (5), 445 (21), 865 (100), 893 (34), 917 (11), 937 (18); exact mass, m/z calcd. for C44H43F3N6O12S [M+H]+ 937.26901, found 937.26642.
Protected FITC–SAH–CC
DIPEA (2 μl, 12 μmol) was added to a solution of FITC–scaffold (10 mg, 11 μmol) and protected SAH (8 mg, 12 μmol, Caprotec Bioanalytics) [15] in dimethylacetamide (DMA, 2.0 ml). After the addition of O-(7-azabenzotriazol-1-yl)-N,N,N′,N′-tetramethyluronium hexafluorophosphate (HATU, 5 mg, 12 μmol), the reaction mixture was stirred at room temperature under light protection. After 30 min, full conversion was detected by LC–MS and the solvent was removed under reduced pressure. Purification of the residue was carried out via basic MPLC (0 → 40% MeCN). Pure protected FITC–SAH–CC was obtained in 54% yield (9 mg, 6 μmol) as orange amorphous solid.
1H NMR, MeOH-d4 δ: 8.24 (s, 1H, HPurin), 8.21 (s, 1H, HPurin), 7.97 (br. s, 1H, HFlu), 7.94/7.27 (AA′/BB′, J = 8.3, 4H, Harom.), 7.73 (br. d, J = 7.8, 1H, HFlu), 7.19 (d, J = 8.2, 1H, HFlu), 7.08 (d, J = 5.0, 1H, HFlu), 7.06 (d, J = 5.1, 1H, HFlu), 6.65 (d, J = 2.3, 1H, HFlu), 6.64 (d, J = 2.2, 1H, HFlu), 6.60 (m, 2H, HFlu), 6.16 (d, J = 2.4, 1H, C(14′)-H), 5.50 (dd, J = 1.9, 6.2, 1H, C(15′)-H), 5.07 (dd, J = 2.9, 6.4, 1H, C(16′)-H), 4.87 (m, 1H, C(18)-H), 4.33 (m, 1H, C(17′)-H), 4.09 (dd, J = 4.7, 9.1, 1H, C(22′)-H), 3.73 (br. s, 2H, C(3)H2), 3.61–3.45 (m, 12H, C(5)H2–C(11)H2, C(7′)H2), 3.47 (t, J = 6.1, 2H, C(13)H2), 3.30–3.27 (m, 2H, C(15)H2), 3.24–3.10 (m, 2H, C(4′)H2), 2.85–2.75 (m, 2H, C(18′)H2), 2.75 (dd, J = 5.7, 14.7, 1H, C(1′)-Ha), 2.67 (dd, J = 8.0, 14.7, 1H, C(1′)-Hb), 2.58 (m, 1H, C(20′)-Ha), 2.51 (m, 1H, C(20′)- Hb), 1.92 (m, 1H, C(21′)-Ha), 1.92 (quint, J = 6.3, 2H, C(4)H2), 1.79 (m, 1H, C(21′)-Hb), 1.72 (quint, J = 6.4, 2H, C(14)H2), 1.67–1.60 (m, 2H, C(6′)H2), 1.56–1.47 (m, 2H, C(5′)H2), 1.59 (s, 3H, iPr), 1.42 (s, 18H, 2× tBu), 1.38 (s, 3H, iPr); 13C NMR, MeOH-d4 δ: 182.1 (C(1)), 173.3 (C(17)), 172.3 (C(2′)), 168.4 (C(20)), 156.3 (CFlu), 155.4 (CFlu), 154.2 (CPurin), 141.2 (CPurin), 136.5 (C(24)), 133.3 (C(21)), 132.2 (2× CFlu), 129.4 (C(22), (CFlu)), 127.6 (C(23)), 124.8 (CFlu), 122.8 (CFlu), 120.1 (CFlu), 115.5 (C(iPr)), 111.9 (CFlu), 103.9 (2× CFlu), 91.6 (C(14′)), 88.0 (C(17′)), 85.2 (C(15′)), 85.1 (C(16′)), 82.7, 80.5 (2× C(tBu)), 71.4 (C(8), C(10)), 71.2, 71.1 (C(7), C(11)), 69.9 (C(5), C(13)), 54.6 (C(22′)), 53.0 (C(18)), 44.1 (C(3)), 38.7 (C(1′)), 41.2 (C(7′)), 40.1 (C(4′)), 38.1 (C(15)), 34.9 (C(18′)), 32.7 (C(21′)), 30.3 (C(14)), 29.9 (C(4)), 29.5 (C(20′)), 28.7, 28.3 (2× C(tBu)), 27.7 (C(5′), C(6′)), 27.4, 25.5 (2× C(iPr)); ESI-MS, exact mass, m/z calcd. for C74H90F3N13O18S2 [M+H]+ 1570.59931, found 1570.60163.
FITC–SAH–CC
The protected FITC–SAH–CC (27 mg, 17 μmol) was dissolved in dichloromethane (DCM, 24.0 ml). After the addition of H2O (8μl, 430 μmol), the reaction mixture was cooled to −20 °C. A solution of 4 M HCl in dioxane (430 μl, 1.7 mmol) was added, and the reaction mixture was stirred overnight at −20 °C. Full conversion was detected by LC–MS. The solvent was carefully removed at −20 °C under reduced pressure, and triethylamine (1.0 ml) was added to the residue. The base was removed under reduced pressure, and the remainder was purified by basic MPLC (10 → 50% MeOH, 20 → 35% MeOH, and 25% MeOH). Pure FITC–SAH–CC was obtained in 31% yield (7 mg, 5 μmol) as an orange amorphous solid.
1H NMR, DMSO-d6 δ: 9.36 (br. s, 1H, N(2)-H), 8.82 (d, 1H, J = 7.7, N(19)-H), 8.38 (br. s, 1H, HFlu), 8.35 (s, 1H, HPurin), 8.21 (s, 1H, HPurin), 7.98–7.94 (m, 1H, N(3′)-H), 7.97/7.37 (AA′/BB′, J = 8.3, 4H, Harom.), 7.92 (t, 1H, J = 5.7, N(16)-H), 7.88 (dd, J = 1.9, 8.3, 1H, HFlu), 7.76 (br. s, 1H, N(8′)-H), 7.14 (d, J = 8.3, 1H, HFlu), 6.68 (br. d, J = 2.1, 2H, HFlu), 6.59 (d, J = 8.6, 2H, HFlu), 6.55 (dd, J = 2.1, 8.6, 2H, HFlu), 5.89 (d, J = 5.7, 1H, C(14′)-H), 4.79 (br. s, 1H, C(15′)-H), 4.69 (dd, J = 7.1, 14.6, 1H, C(18)-H), 4.16 (br. t, J = 4.1, 1H, C(16′)-H), 4.02 (m, 1H, C(17′)-H), 3.55–3.49 (m, 2H, C(3)H2), 3.48–3.43 (m, 6H, C(8)H2, C(9)H2, C(7′)), 3.42–3.33 (m, 7H, C(5)H2, C(7)H2, C(11)H2, C(22′)-H), 3.35–3.31 (m, 2H, C(13)H2), 3.10–3.01 (m, 4H, C(15)H2, C(4′)H2), 2.93 (dd, J = 6.0, 13.8, 1H, C(18′)-Ha), 2.81 (dd, J = 6.9, 13.8, 1H, C(18′)-Hb), 2.64 (t, J = 7.6, 2H, C(20′)H2), 2.60–2.54 (m, 2H, C(1′)H2), 2.04 (m, 1H, C(21′)-Ha), 1.86 (m, 1H, C(21′)-Hb), 1.79 (quint, 2H, J = 6.8, C(4)H2), 1.58 (quint, 2H, J = 6.7, C(14)H2), 1.57– 1.51 (m, 2H, C(6′)H2), 1.44–1.34 (m, 2H, C(5′)H2); 13C NMR, DMSO-d6 δ: 171.4 (C(23′)), 170.6 (C(17)), 169.4 (C(2′)), 168.6 (CFlu), 164.9 (C(20)), 159.8 (CFlu), 152.0 (CPurin), 148.6 (CPurin), 142.1 (CFlu), 139.9 (CPurin), 135.7 (C(24)), 133.2 (CFlu), 132.4 (CFlu), 130.3 (C(21)), 129.3 (CFlu), 129.1 (CFlu), 129.0 (CFlu), 128.7 (C(22)), 126.5 (CFlu), 126.3 (C(23)), 123.7 (CFlu), 120.4 (CFlu), 119.4 (CPurin), 115.8 (CFlu), 112.4 (CFlu), 102.3 (CFlu), 87.5 (C(14′)), 83.7 (C(17′)), 72.6 (C(15′), C(16′)), 69.7 (C(8), C(10)), 69.5 (C(7), C(11)), 68.1, 68.0 (C(5), C(13)), 52.9 (C(22)), 51.1 (C(18)), 41.1 (C(3)), 38.4 (C(4′)), 37.5 (C(1′)), 36.0 (C(15)), 33.7 (C(18′)), 30.4 (C(21′)), 29.4 (C(4)), 28.6 (C(14)), 27.8 (C(20′)), 26.4 (C(6′)), 25.8 (C(5′)); ESI–MS, m/z: 444 (100), 468 (21), 519 (349), 541 (68), 578 (42), 648 (32), 732 (60), 779 (24), 833 (40), 872 (22), 956 (45), 1109 (31), 1301 (82); exact mass, m/z calcd. for C62H70F3N13O16S2 [M+H]+ 1374.45353, found 1374.45555. The purity of FITC–SAH–CC was determined to be greater than 99% by LC–MS (ultraviolet [UV] 254 nm, 270 nm, and MS–BPI [base peak intensity]) (see Supplemental Fig. 2 in supplementary material).
Protein subcloning and purification
COMT
Human-soluble COMT open reading frame (Invitrogen, cat. no. IOH45773) was recombined into pDEST-15 (Invitrogen) via LR recombination. Protein expression was induced by treating BL21-AI cells with 2% arabinose overnight at 16 °C. After induction, the cells were spun at 10,000g for 10 min, washed twice in phosphate-buffered saline (PBS), frozen in liquid nitrogen, and stored at −80 °C until protein purification. Frozen pellets of induced bacterial culture were thawed on ice in lysis buffer (20 mM Hepes [pH 8.2], 500 mM NaCl, 2 mM MgCl2, 1mM β-mercaptoethanol, and 0.1% NP-40) supplemented with rLysozyme (Novagen) and Benzonase (Sigma). After 30 min of incubation at 4 °C, the lysate was sonicated via Branson sonicator (duty cycle 90%, output 5). The lysate was centrifuged at 4 °C and 10,000g for 20 min. The protein was purified via glutathione S-transferase (GST)–agarose (Pierce). After elution in buffer (20 mM Hepes [pH 8.2], 150 mM NaCl, 2 mM MgCl2, 1mM β-mercaptoethanol, 0.1% NP-40, and 20 mM glutathione), buffer exchange via Centricon filtration (Millipore) was performed to remove glutathione. The protein was quantified via BCA (bisinchoninic acid) assay (Pierce) and stored at −80 °C until use.
SAHH
The human SAHH open reading frame (Invitrogen, cat. no. IOH14308) was subcloned into pTXB1 vector (NEB) using NdeI and SapI restriction sites. SAHH was expressed in Escherichia coli BL21(DE3) cells and grown at 37 °C, followed by induction with 0.5 mM isopropyl β-D-1-thiogalactopyranoside (IPTG) at 16 °C for 16 to 20 h before harvest. Following bacterial cell lysis by French press in 25 mM Hepes (pH 7.5), 500 mM NaCl, 1 mM ethylenediaminetetraacetic acid (EDTA), 1 mM tris(2-carboxyethyl)phosphine, and 10% glycerol, SAHH protein was purified according to the standard protocol from the IMPACT (Intein Mediated Purification with an Affinity Chitin-binding Tag) kit (NEB). The resin-bound SAHH–intein–CBD (chitin binding domain) fusion protein was washed with 50 mMHepes, 150 to 500 mMNaCl, and 0.1 mMEDTA (pH 7.5). The purified resin-bound SAHH–intein–CBD fusion was then treated with 50 mM dithiothreitol (DTT) in cleavage buffer (50 mM Hepes, 150 mM NaCl, and 0.1 mM EDTA, pH 7.5) for 16 h at room temperature to release intact SAHH from intein–CBD. Eluted SAHH was dialyzed against 10 mM K2HPO4 and 1 mM EDTA (pH 7.2). Purified SAHH (>1 mg/ml) was judged to be greater than 90% pure by Coomassie stain SDS–PAGE and stored at −80 °C. Tetrameric SAHH was purified via high-performance liquid chromatography. SAHH catalytic activity was confirmed by 5.5′-dithiobis(2-nitro-benzoic acid (DTNB)-based assay in the S-adenosylhomocysteine hydrolytic direction as described in Ref. [18].
PRDM2
Due to the problems with solubility of the full-length protein, two fragments of PRDM2, residues 2–148 and 3–200, were amplified from a complementary DNA clone (Fisher) (forward: 5′-ACGCGCGATCGCCCAGAACACTACTGAGCCTGTG-3′; 148 reverse: 5′-TGGGGAAGACAACCCTGAGATAGTTTAAACTAAA-3′; 200 reverse: 5′-GTTTAAACTGCAGAGGTGAAATCTGGCTCACTTGTC-3′) and subcloned into pFN2A vector (Promega). Protein expression was induced in BL21(RIL) cells (Agilent) overnight at 18 °C with 1 mM IPTG (Fermentas). After induction, the cells were spun down and stored at −80 °C until protein purification. The protein was purified as described previously [19] and stored at −80 °C until use.
Streptavidin–HRP blot
Recombinant proteins were photo-crosslinked using biotin– SAH–CC in their respective buffers except PRDM2. The PRDM2 photo-crosslinking reaction buffer contained 20 mM Tris (pH 8.0), 400 mM NaCl, and 10 mM EDTA. Competitors were added in 100- fold excess to the CC concentration. After 1 h of incubation at 4 °C, the reaction was photo-crosslinked for 3 min in the caproBox (λmax = 310 nm, Caprotec Bioanalytics). Loading buffer (Invitrogen) supplemented with 500 mM DTT was added to the crosslinking reaction, and the mixture was then heated to 100 °C for SDS–PAGE. After electrophoresis in a 12% Bis–Tris gel (Invitrogen), the proteins were transferred to a nitrocellulose membrane via iBlot (Invitrogen). The membrane was incubated with streptavidin–horseradish peroxidase (HRP) 1:2000 (Pierce) in Tris-buffered saline with Tween 20 (TBST) protein-free block (Pierce). The level of biotinylation was measured using enhanced chemiluminescence (ECL, GE Amersham) and a GelDoc camera (Bio-Rad).
Fluorescence anisotropy
FITC–SAH–CC (100 nM) was added to serially diluted protein, and the mixture was incubated for 1 h at 4 °C. To avoid errors in measuring binding affinity, the mixture was not crosslinked. Anisotropy was measured at room temperature using a POLARstar Omega plate reader (BMG Labtech) with excitation at 485 nm and emission at 520 nm. Using GraFit 5, the binding constants were calculated from the anisotropy data using the equation Fb = (− m[L]/Kd + [L]) + c. For competition, SAM was added in 1000-fold excess with respect to the FITC–SAH–CC.
Computational methods
Docking model
Modeling of COMT (PDB: 3BWM) was performed using Surflex–Dock [20].
Protein alignment
Annotated human PRDM proteins (see Supplemental Table 1 in supplementary material) were downloaded from UniProt and aligned using the default settings in Clustal Omega [21,22]. PRDM2 SET domain (24–148) and functional domain (1–200) were included as separate sequences.
Results
Photo-crosslinking of COMT and SAHH
We chose COMT and SAHH to demonstrate specific binding of the SAH-derived compounds biotin–SAH–CC [15] (Fig. 1) and FITC–SAH–CC for both photo-crosslinking and anisotropy, respectively. Both COMT and SAHH are well-characterized SAM and SAH binding proteins. Computer modeling shows the interaction between FITC–SAH–CC and the deep SAM binding site of COMT (Fig. 2). Using this model, we predicted that the SAM binding site in COMT can interact with the SAH moiety in both CCs. This indicates that the CCs could be suitable to demonstrate interactions with the SAM binding site. We incubated biotin–SAH–CC with recombinant GST–COMT and SAHH for the streptavidin–HRP blot assay. Because SAH and SAM can occupy the same binding site, they were both used to compete for binding. Using the biotin– SAH–CC compound, recombinant GST-tagged COMT and SAHH were photo-crosslinked and visualized by streptavidin–HRP blot followed by ECL (Fig. 3A and B). Excess SAH and SAM caused a reduction of crosslinked protein as measured by ECL. In each instance, the addition of adenosine triphosphate (ATP) had no significant effect on protein photo-crosslinking. This indicates that SAM and SAH are competing with biotin–SAH–CC for the same binding site, and there is no appreciable inner filter effect at approximately 1 mM SAH or SAM to inhibit photoactivation of the phenylazide group by these competitors. Despite the addition of the specific competitors, a measurable amount of biotinylation still occurred, most likely due to nonspecific crosslinking between the protein and the phenylazide group. After photo-crosslinking of a known methyltransferase and a known SAH binding protein, we then determined whether we could measure binding affinity using FITC–SAH–CC.
Fig. 2.
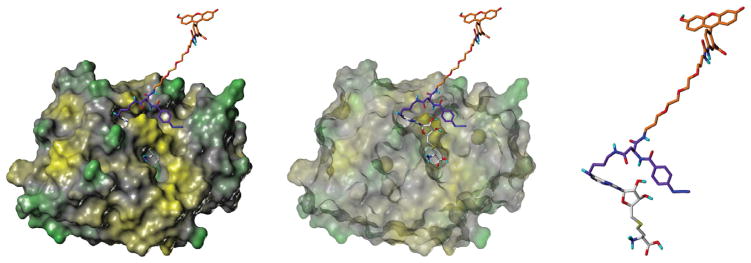
Computer model of interactions between photoactivated FITC–SAH–CC and COMT. The left image shows how the compound fits into the COMT crystal structure. The center image shows the compound fitting into the catalytic pocket with the surface removed. The right image shows the arrangement of the SAH moiety of the carbene compound without protein.
Fig. 3.
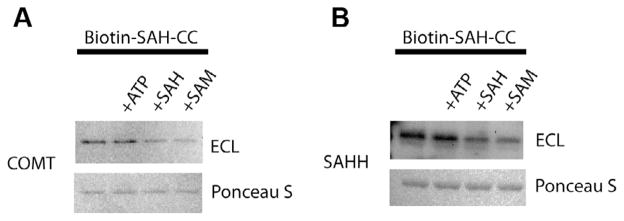
Photo-crosslinking of SAM and SAH binding proteins. GST-tagged COMT (A) and tetrameric SAHH (B) were photo-crosslinked to biotin–SAH–CC with additions as indicated. The top row shows chemiluminescence, and the bottom row shows Ponceau S staining as a loading control. The biotin–SAH–CC concentration was 10 μM. The concentration of ATP, SAH, and SAM was 1 mM.
Fluorescence anisotropy of SAHH and COMT
Increasing concentrations of COMT were titrated against 100 nM FITC–SAH–CC without crosslinking because crosslinking prevents the protein–ligand dissociation required to accurately measure binding thermodynamics. Binding affinity was measured by fluorescence anisotropy. We calculated an average Kd of 24.1 ± 2.2 μM (Fig. 4A), which is close to the previously published value of 20.2 μM for SAH [23] (Table 1). The semi-log plot shows that the addition of 100 μMSAM decreased the affinity for the fluorescent compound 3-fold (Fig. 4B). We performed a similar titration with the tetrameric form of SAHH with 100 nM of the fluorescent SAH–CC without crosslinking and measured an average Kd of 6.0 ± 2.9 μM (Fig. 5A). Although we used the tetrameric form of SAHH, the data were fitted presuming independent binding [24].
Fig. 4.

COMT binding curves. GST–COMT was titrated against a constant concentration of fluorescent compound. (A) Protein concentration is plotted against normalized anisotropy. The averages of two independent experiments done in triplicate are shown. A single site binding isotherm was fitted to the data to measure Kd. (B) To show competition, 0.1 mM SAM was added to serially diluted COMT. The fluorescent probe was added afterward. (C) FITC–SAH–CC (100 nM) was added to COMT (5 μM) in the presence of increasing amounts of SAM. Anisotropy was measured after 1 h of incubation at room temperature.
Table 1.
Binding constants measured by fluorescence anisotropy and comparison with previous measurements.
| Protein | Anisotropy Kd (μM) | Previous measurement |
|---|---|---|
| COMT | 24.1 ± 2.2 | 20.2 [23] |
| SAHH | 6.0 ± 2.9 | N/A |
| PRDM2 | 10.06 ± 2.87 | N/A |
Fig. 5.

SAHH binding curves. SAHH was titrated against a constant concentration of fluorescent compound. Protein concentration is plotted against normalized anisotropy. The graph shows averages of two independent experiments done in triplicate. The concentrations correspond to the binding site concentration, not the tetramer concentration (see Materials and methods).
PRDM2 photo-crosslinking and anisotropy
Next, we turned to the SET domain of the SAM-dependent methyltransferase, PRDM2. We subcloned a portion of PRDM2 that contained the annotated SET domain (2–148). We were unable to measure any interaction between the GST-tagged PRDM2 SET domain and biotin–SAH–CC via streptavidin–HRP blot (data not shown). Previous reports stated that PR domain proteins are related to SET domain methyltransferases, and this implies that this conserved SET domain in PRDM2 is required for activity [25]. However, when we examined the sequence homology between PRDM2 and other PR domain-containing proteins, we found conserved residues within the PR domain [26] that flank the annotated SET domain of PRDM2 (Fig. 6A; see also Supplemental Fig. 4 in supplementary material). We subcloned a larger portion of PRDM2 (3– 200) containing these additional conserved residues and successfully photo-crosslinked the GST-tagged PRDM2 PR domain using biotin–SAH–CC (Fig. 6B). The streptavidin–HRP blot of the GSTtagged PRDM2 PR domain was similar to the blots of COMT and SAHH. The addition of ATP did not disrupt interactions between the GST-tagged PRDM2 PR domain and biotin–SAH–CC. The addition of SAM and SAH inhibited photo-activated crosslinking by biotin– SAH–CC, presumably by competing for the same SAM binding site.
Fig. 6.
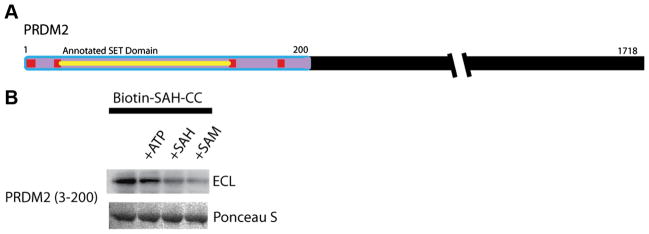
(A) PRDM catalytic domain and PRDM2 (3–200) capture. The domain associated with methyltransferase activity is in purple. The annotated SET domain is highlighted in yellow. The additional conserved residues are in red. (B) Crosslinking of PRDM2 (residues 3–200). The top row shows chemiluminescence, and the bottom row shows Ponceau S staining as a loading control. The biotin–SAH–CC concentration was 10 μM. The concentration of ATP, SAH, and SAM was 1 mM. (For interpretation of the references to color in this figure legend, the reader is referred to the Web version of this article.)
Using the buffer conditions for capturing the PRDM2 PR domain, we performed the fluorescence anisotropy experiments without crosslinking. As with COMT, PRDM2–PR (3–200) was titrated against 100 nM FITC–SAH–CC. We measured an average Kd of 10.06 ± 2.87 μM (Fig. 7).
Fig. 7.

PRDM2 binding curves. GST–PRDM2 (3–200) was titrated against a constant concentration of fluorescent compound. Protein concentration is plotted against normalized anisotropy. The averages of two independent experiments done in triplicate are shown. A single site binding isotherm was fitted to the data.
Discussion
Known SAM and SAH binding proteins
In this study we photo-crosslinked COMT and SAHH using the SAH-derived CC, biotin–SAH–CC. We also showed that SAM and SAH, but not ATP, can inhibit this interaction. With this implication of binding to the SAM/SAH binding site, we measured the binding affinity of these binding sites for FITC–SAH–CC via fluorescence anisotropy. In previous attempts to measure binding constants, increasing amounts of radiolabeled SAM were UV-crosslinked to putative methyltransferases [17]. The resulting autoradiograph was used to calculate binding affinity. Additional work with the biotinylated CC described a method to measure the Kd of M.TaqI for SAH. Although small amounts of protein are used, this technique can be subject to technical errors in crosslinking and staining. Like its biotinylated counterpart, FITC–SAH–CC can be crosslinked to target proteins (Supplemental Fig. 1). However, crosslinking alters protein–ligand interaction, which needs to be taken into consideration when calculating binding affinity [15]. As an alternative, we used fluorescence anisotropy because this technique allows natural protein–ligand association and dissociation needed to accurately measure binding affinity. We performed fluorescence anisotropy using FITC–SAH–CC and COMT with increasing amounts of SAM. We found that the anisotropy decreased under higher concentrations of SAM, which implies that FITC–SAH–CC is binding to the SAM binding site of COMT without crosslinking (Supplemental Fig. 3). We calculated a Kd of 24.1 ± 2.2 μM for the SAM-dependent methyltransferase COMT. Our measurement is similar to the previously published estimation based on the Km using radiolabeled SAM [23].We calculated a Kd of 6.0 ± 2.9 μM for SAHH. Previous work measured a Km of 7.9 μM for SAH hydrolysis [18]. The binding constant we calculated is in the range of previous measurements of adenosine and small adenosine analogues that inhibit SAHH activity [24,27,28].
Novel SAM and SAH binding proteins
PRDM2 and other PR domain proteins have been grouped with SET domain proteins due to amino acid sequence homology [25,29]. It was previously established that PRDM2 has methyltransferase activity when truncation mutants of PRDM2 (1–322, 1–200, and 1–161) were tested for enzymatic activity. Despite containing the annotated SET domain, the smallest fragment of PRDM2 (1–161) did not have methyltransferase activity, whereas the larger fragments (1–322 and 1–200) did [30]. When we examined sequence homology among PR domain-containing proteins, it was apparent that residues outside of the putative SET domain are also conserved (Fig. 6A; see also Supplemental Fig. 4). Previous analysis of protein homology between PRDM proteins and SET domain proteins also shows conserved residues among PRDM proteins within the annotated SET domain that are absent in known SET domain methyltransferases [26]. Our success in crosslinking PRDM2 (3–200) and not PRDM2 (1–148) with SAH–CC implies that these conserved residues outside of the annotated SET domain may be crucial for folding, stability, and activity for PR domain proteins. We also measured affinity of PRDM2 (3–200) by fluorescence anisotropy using FITC–SAH–CC (10.06 ± 2.87 μM), which was within the range of binding affinities of other characterized methyltransferases for SAM/SAH. Our findings support the idea that the PRDM family of methyltransferases may be distinct from SET domain methyltransferases.
In conclusion, we have established a protocol to examine interactions between SAM-dependent methyltransferases and a SAH binding protein with SAH-derived CCs. The crosslinking protocol can be used to quickly determine whether a protein can interact with SAM or SAH. With the fluorophore-conjugated CCs, fluorescence anisotropy can be used to quickly measure binding affinity without the use of radiolabeled ligands and without crosslinking, improving on previous methods that use CC technology. These techniques can be used not only to confirm binding to known SAM and SAH binding proteins but also to verify and identify novel SAM and SAH binding proteins.
Supplementary Material
Acknowledgments
We thank Andrew Feinberg for his idea for the fluorophorelabeled capture compound. We also thank Carolyn Machamer and Mathias Dreger for helpful discussions and insight, and we thank Christian Dalhoff for determination of the purity of FITC– SAH–CC. This work was supported during the early stages by the Human Frontier Science Program.
Appendix A. Supplementary data
Supplementary data associated with this article can be found, in the online version, at http://dx.doi.org/10.1016/j.ab.2014.08.013.
Footnotes
Abbreviations used: SAM, S-adenosyl-L-methionine; SAH, S-adenosyl-L-homocysteine; CC, capture compound; M.TaqI, modification methylase TaqI; SDS–PAGE, sodium dodecyl sulfate–polyacrylamide gel electrophoresis; FITC, fluorescein isothiocyanate; COMT, catechol-O-methyltransferase; SAHH, S-adenosylhomocysteine hydrolase; PRDM2, PR domain zinc finger protein 2; DIPEA, diisopropylethylamine; DMF, dimethylformamide; LC–MS, liquid chromatography–mass spectrometry; MPLC, medium-pressure liquid chromatography; DMA, dimethylacetamide; HATU, O-(7-azabenzotriazol-1-yl)-N,N,N′,N′-tetramethyluronium hexafluorophosphate; DCM, dichloromethane; UV, ultraviolet; PBS, phosphate-buffered saline; GST, glutathione S-transferase; IPTG, isopropyl β-D-1-thiogalactopyranoside; EDTA, ethylenediaminetetraacetic acid; CBD, chitin binding domain; dithiothreitol; HRP, horseradish peroxidase; ECL, enhanced chemiluminescence; ATP, adenosine triphosphate.
References
- 1.Dalhoff C, Weinhold E. S-Adenosyl-L-methionine and related compounds. In: Herdewijn P, editor. Modified Nucleosides in Biochemistry, Biotechnology and Medicine. Wiley–VCH; Weinheim: 2008. pp. 223–247. [Google Scholar]
- 2.Kouzarides T. Chromatin modifications and their function. Cell. 2007;128:693–705. doi: 10.1016/j.cell.2007.02.005. [DOI] [PubMed] [Google Scholar]
- 3.Jansson A, Koskiniemi H, Erola A, Wang J, Mantsala P, Schneider G, Niemi J. Aclacinomycin 10-hydroxylase is a novel substrate-assisted hydroxylase requiring S-adenosyl-L-methionine as cofactor. J Biol Chem. 2005;280:3636–3644. doi: 10.1074/jbc.M412095200. [DOI] [PubMed] [Google Scholar]
- 4.O’Hagan D, Schaffrath C, Cobb SL, Hamilton JT, Murphy CD. Biochemistry: biosynthesis of an organofluorine molecule. Nature. 2002;416:279. doi: 10.1038/416279a. [DOI] [PubMed] [Google Scholar]
- 5.Ikeguchi Y, Bewley MC, Pegg AE. Aminopropyltransferases: function, structure, and genetics. J Biochem. 2006;139:1–9. doi: 10.1093/jb/mvj019. [DOI] [PubMed] [Google Scholar]
- 6.Kinzie SD, Thern B, Iwata-Reuyl D. Mechanistic studies of the tRNA-modifying enzyme QueA: a chemical imperative for the use of AdoMet as a “ribosyl” donor. Org Lett. 2000;2:1307–1310. doi: 10.1021/ol005756h. [DOI] [PubMed] [Google Scholar]
- 7.Grogan DW, Cronan JE., Jr Cyclopropane ring formation in membrane lipids of bacteria. Microbiol Mol Biol Rev. 1997;61:429–441. doi: 10.1128/mmbr.61.4.429-441.1997. [DOI] [PMC free article] [PubMed] [Google Scholar]
- 8.Sofia HJ, Chen G, Hetzler BG, Reyes-Spindola JF, Miller NE. Radical SAM, a novel protein superfamily linking unresolved steps in familiar biosynthetic pathways with radical mechanisms: Functional characterization using new analysis and information visualization methods. Nucleic Acids Res. 2001;29:1097–1106. doi: 10.1093/nar/29.5.1097. [DOI] [PMC free article] [PubMed] [Google Scholar]
- 9.Zhang Q, van der Donk WA, Liu W. Radical-mediated enzymatic methylation: a tale of two SAMs. Acc Chem Res. 2012;45:555–564. doi: 10.1021/ar200202c. [DOI] [PMC free article] [PubMed] [Google Scholar]
- 10.Challand MR, Driesener RC, Roach PL. Radical S-adenosylmethionine enzymes: mechanism, control, and function. Nat Prod Rep. 2011;28:1696–1721. doi: 10.1039/c1np00036e. [DOI] [PubMed] [Google Scholar]
- 11.Köster H, Little DP, Luan P, Muller R, Siddiqi SM, Marappan S, Yip P. Capture compound mass spectrometry: a technology for the investigation of small molecule protein interactions. Assay Drug Dev Technol. 2007;5:381–390. doi: 10.1089/adt.2006.039. [DOI] [PubMed] [Google Scholar]
- 12.Luo Y, Blex C, Baessler O, Glinski M, Dreger M, Sefkow M, Köster H. The cAMP capture compound mass spectrometry as a novel tool for targeting cAMP-binding proteins: from protein kinase A to potassium/sodium hyperpolarization-activated cyclic nucleotide-gated channels. Mol Cell Proteomics. 2009;8:2843–2856. doi: 10.1074/mcp.M900110-MCP200. [DOI] [PMC free article] [PubMed] [Google Scholar]
- 13.Lenger J, Kaschani F, Lenz T, Dalhoff C, Villamor JG, Köster H, Sewald N, van der Hoorn RA. Labeling and enrichment of Arabidopsis thaliana matrix metalloproteases using an active-site directed, marimastat-based photoreactive probe. Bioorg Med Chem. 2012;20:592–596. doi: 10.1016/j.bmc.2011.06.068. [DOI] [PubMed] [Google Scholar]
- 14.Fischer JJ, Dalhoff C, Schrey AK, Graebner OY, Michaelis S, Andrich K, Glinski M, Kroll F, Sefkow M, Dreger M, Koester H. Dasatinib, imatinib, and staurosporine capture compounds: Complementary tools for the profiling of kinases by capture compound mass spectrometry (CCMS) J Proteomics. 2011;75:160–168. doi: 10.1016/j.jprot.2011.05.035. [DOI] [PubMed] [Google Scholar]
- 15.Dalhoff C, Huben M, Lenz T, Poot P, Nordhoff E, Köster H, Weinhold E. Synthesis of S-adenosyl-L-homocysteine capture compounds for selective photoinduced isolation of methyltransferases. ChemBioChem. 2010;11:256–265. doi: 10.1002/cbic.200900349. [DOI] [PubMed] [Google Scholar]
- 16.Rossi AM, Taylor CW. Analysis of protein–ligand interactions by fluorescence polarization. Nat Protoc. 2011;6:365–387. doi: 10.1038/nprot.2011.305. [DOI] [PMC free article] [PubMed] [Google Scholar]
- 17.Wlodarski T, Kutner J, Towpik J, Knizewski L, Rychlewski L, Kudlicki A, Rowicka M, Dziembowski A, Ginalski K. Comprehensive structural and substrate specificity classification of the Saccharomyces cerevisiae methyltransferome. PLoS ONE. 2011;6:e23168. doi: 10.1371/journal.pone.0023168. [DOI] [PMC free article] [PubMed] [Google Scholar]
- 18.Yuan CS, Ault-Riché DB, Borchardt RT. Chemical modification and site-directed mutagenesis of cysteine residues in human placental S-adenosylhomocysteine hydrolase. J Biol Chem. 1996;271:28009–28016. doi: 10.1074/jbc.271.45.28009. [DOI] [PubMed] [Google Scholar]
- 19.Wu H, Min J, Lunin VV, Antoshenko T, Dombrovski L, Zeng H, Allali-Hassani A, Campagna-Slater V, Vedadi M, Arrowsmith CH, Plotnikov AN, Schapira M. Structural biology of human H3K9 methyltransferases. PLoS ONE. 2010;5:e8570. doi: 10.1371/journal.pone.0008570. [DOI] [PMC free article] [PubMed] [Google Scholar]
- 20.Jain AN. Surflex: fully automatic flexible molecular docking using a molecular similarity-based search engine. J Med Chem. 2003;46:499–511. doi: 10.1021/jm020406h. [DOI] [PubMed] [Google Scholar]
- 21.Goujon M, McWilliam H, Li W, Valentin F, Squizzato S, Paern J, Lopez R. A new bioinformatics analysis tools framework at EMBL–EBI. Nucleic Acids Res. 2010;38:695–699. doi: 10.1093/nar/gkq313. [DOI] [PMC free article] [PubMed] [Google Scholar]
- 22.Sievers F, Wilm A, Dineen D, Gibson TJ, Karplus K, Li W, Lopez R, McWilliam H, Remmert M, Soding J, Thompson JD, Higgins DG. Fast scalable generation of high-quality protein multiple sequence alignments using Clustal Omega. Mol Syst Biol. 2011;7:539–544. doi: 10.1038/msb.2011.75. [DOI] [PMC free article] [PubMed] [Google Scholar]
- 23.Lotta T, Vidgren J, Tilgmann C, Ulmanen I, Melen K, Julkunen I, Taskinen J. Kinetics of human soluble and membrane-bound catechol O-methyltransferase: a revised mechanism and description of the thermolabile variant of the enzyme. Biochemistry. 1995;34:4202–4210. doi: 10.1021/bi00013a008. [DOI] [PubMed] [Google Scholar]
- 24.Porter DJ. S-Adenosylhomocysteine hydrolase: stereochemistry and kinetics of hydrogen transfer. J Biol Chem. 1993;268:66–73. [PubMed] [Google Scholar]
- 25.Huang S, Shao G, Liu L. The PR domain of the Rb-binding zinc finger protein RIZ1 is a protein binding interface and is related to the SET domain functioning in chromatin-mediated gene expression. J Biol Chem. 1998;273:15933–15939. doi: 10.1074/jbc.273.26.15933. [DOI] [PubMed] [Google Scholar]
- 26.Hohenauer T, Moore AW. The PRDM family: Expanding roles in stem cells and development. Development. 2012;139:2267–2282. doi: 10.1242/dev.070110. [DOI] [PubMed] [Google Scholar]
- 27.Guillerm G, Guillerm D, Vandenplas-Vitkowski C, Glapski C, De Clercq E. Inactivation of S-adenosyl-L-homocysteine hydrolase with novel 5′-thioadenosine derivatives: antiviral effects. Bioorg Med Chem Lett. 2003;13:1649–1652. doi: 10.1016/s0960-894x(03)00279-8. [DOI] [PubMed] [Google Scholar]
- 28.Kojima H, Kozaki A, Iwata M, Ando T, Kitade Y. Synthesis of 3′,4′-epoxynoraristeromycin analogs for molecular labeling probe of S-adenosyl-L-homocysteine hydrolase. Bioorg Med Chem. 2008;16:6575–6579. doi: 10.1016/j.bmc.2008.05.020. [DOI] [PubMed] [Google Scholar]
- 29.Steele-Perkins G, Fang W, Yang XH, Van Gele M, Carling T, Gu J, Buyse IM, Fletcher JA, Liu J, Bronson R, Chadwick RB, de la Chapelle A, Zhang X, Speleman F, Huang S. Tumor formation and inactivation of RIZ1, an Rb-binding member of a nuclear protein-methyltransferase superfamily. Genes Dev. 2001;15:2250–2262. doi: 10.1101/gad.870101. [DOI] [PMC free article] [PubMed] [Google Scholar]
- 30.Kim KC, Geng L, Huang S. Inactivation of a histone methyltransferase by mutations in human cancers. Cancer Res. 2003;63:7619–7623. [PubMed] [Google Scholar]
Associated Data
This section collects any data citations, data availability statements, or supplementary materials included in this article.