

Abstract
The Affordable Care Act’s Hospital Readmissions Reduction Program (HRRP) penalizes hospitals based on excess readmission rates among Medicare beneficiaries. The aim of the program is to reduce readmissions while aligning hospitals’ financial incentives with payers’ and patients’ quality goals. Many evidence-based interventions that reduce readmissions, such as discharge preparation, care coordination, and patient education, are grounded in the fundamentals of basic nursing care. Yet inadequate staffing can hinder nurses’ efforts to carry out these processes of care. We estimated the effect that nurse staffing had on the likelihood that a hospital was penalized under the HRRP. Hospitals with higher nurse staffing had 25 percent lower odds of being penalized compared to otherwise similar hospitals with lower staffing. Investment in nursing is a potential system-level intervention to reduce readmissions that policy makers and hospital administrators should consider in the new regulatory environment as they examine the quality of care delivered to US hospital patients.
Effective October 1, 2012, the Centers for Medicare and Medicaid Services (CMS) began implementing the Hospital Readmissions Reduction Program (HRRP) under the Affordable Care Act, reducing base diagnosis-related group payments by up to 1 percent for hospitals with excess thirty-day readmissions among Medicare patients with acute myocardial infarction, heart failure, or pneumonia.1 The program aims to curb the estimated $15 billion Medicare spends annually on preventable readmissions by creating a financial incentive to reduce readmissions.2,3 The fiscal year 2013 penalties have been estimated to reduce payments to hospitals by 0.3 percent—approximately $280 million.1
The logic behind the HRRP is that hospitals can reduce readmissions by implementing evidence-based standards of care.1 Many interventions designed to reduce readmissions target single disease–based patient populations (for example, patients with heart failure) or a limited component of care (for example, discharge preparation, care coordination, or post discharge care services).4–7 Research generally supports the effectiveness of these interventions, but there are also mixed findings, particularly when interventions are translated to real-world settings and circumstances.8,9
Evidence suggests that hospitals that staff for manageable nurse workloads (such as higher levels of registered nurse staffing) have lower readmissions rates.10,11 Many evidence-based interventions intended to reduce readmissions focus on processes that are fundamental to basic nursing care, such as discharge preparation, complication surveillance and prevention, knowledge assessment, care coordination, and patient education. It is known, however, that when nurses work in inadequately staffed environments, the delivery of these care processes is hampered.10–12 Nurses who work in well-staffed hospitals have the time and the resources to more effectively execute the care processes that influence readmissions. They are also better equipped than other nurses to monitor for complications and adverse events13,14 that increase readmission risk.15
In this article we examine the relationship between registered nurse staffing levels and hospital performance in the HRRP. By understanding the relationship between nurse staffing and readmissions penalties, hospital administrators will have a clearer picture of the implications of decisions regarding nurses—the principal patient care workforce of the hospital—in the post–Affordable Care Act regulatory environment. Policy makers will be better equipped to consider whether policy alternatives aimed at improving staffing levels, such as patient-to-nurse ratio limits, required staffing committees with documented staffing plans, and mandated public reporting of staffing levels, should be considered when readmissions reduction strategies are being evaluated.
Study Data And Methods
DATA AND VARIABLES
We used the CMS HRRP Supplemental Data File for fiscal year 2013 (March 2013 data release) to identify HRRP penalties. The penalty data were originally released in August 2012 but were revised in September 2012 and again, most recently, in March 2013. Our analyses focused on adult, non-federal, acute care hospitals. Maryland hospitals are excluded from the program because of Maryland’s unique all-payer hospital payment system. Per the HRRP, our sample was limited to hospitals with at least twenty-five cases of heart failure, acute myocardial infarction, or pneumonia between July 1, 2008, and June 31, 2011.
The outcome was based on the readmissions adjustment factor—that is, the percentage by which CMS would reduce each hospital’s base diagnosis-related group (DRG) payment. To determine a hospital’s adjustment factor, CMS calculates an excess readmission ratio for each of the three conditions as the sum of patients’ predicted readmission probabilities divided by expected readmission probabilities. This allows for patient-level risk adjustment for age, sex, and comorbidities based on a National Quality Forum–endorsed methodology. The percentage of payments for excess readmissions out of all payments is calculated, and the readmissions adjustment factor is this value or 1 percent, whichever is less.1
We created a binary variable to indicate whether a hospital was penalized or not penalized. We also conducted analyses with an alternative categorization: comparing hospitals that were penalized a full 1 percent to all other hospitals.
Staffing was measured as the ratio of registered nurse hours per adjusted patient day. Data came from the 2009 American Hospital Association Annual Survey. We multiplied full-time-equivalent registered nurse staffing by 1,768 and divided by adjusted patient days to determine average registered nurse hours per adjusted patient day.16 A shortcoming of this measure is that it includes nurses who work in skilled nursing facilities within a hospital. We included a covariate indicating the presence of a skilled nursing facility in our analysis to account for this.
Research has shown that the readmissions penalties vary by certain hospital characteristics; accordingly, we used numerous data sources to account for these and other potential confounders.17 From the American Hospital Association survey data, we measured hospital size based on the number of set-up and staffed hospital beds. Teaching intensity was the ratio of physician residents or fellows to beds. Market competition was measured using the Herfindahl-Hirschman Index, with market share based on adjusted hospital admissions at the county level. We used binary indicators for not-for-profit or for-profit status and urban or rural location. Hospitals were designated as high-technology hospitals if they performed open heart or organ transplant surgery. We used 2009 Medicare Cost Report data to calculate hospital operating margins as the ratio of total hospital direct patient care revenue to total hospital operating expenses.
Evidence suggests that hospital readmission rates vary based on the racial, ethnic, and socioeconomic status mix of patients served by the hospital.18,19 Linked 2009 Medicare Provider Analysis and Review (MedPAR) and Medicare Beneficiary Annual Summary files were used to determine the proportion of hospital patients who self-identified as black or Hispanic (separately). We also determined the proportion of hospital admissions with Medicaid as the primary payer from the American Hospital Association data. An average composite socioeconomic status indicator for ZIP codes within the hospital service area was derived from Census Bureau’s 2006–10 American Community Survey data (see the online Appendix for a more detailed discussion of this variable and its construction).20
DESIGN APPROACH AND STATISTICAL ANALYSIS
We used a matching approach to carry out an “apples to apples” comparison of HRRP penalties between well-staffed hospitals and otherwise similar hospitals with lower staffing levels. A common concern with studies on staffing and outcomes is that better-staffed hospitals may differ structurally from and care for different patient populations than hospitals with worse staffing levels. To address this, our outcome was based on a risk-standardized readmission rate. We also matched hospitals on structural and patient-mix characteristics that might account for hospitals’ having different staffing levels or readmission rates. This allowed us to compare hospitals that were similar in all respects across covariates but differed significantly in nurse staffing.
To create matched pairs, we categorized hospitals based on five quintiles of our nurse staffing variable. We then used a complex matching algorithm—optimal nonbipartite matching—that allowed us to create the matched pairs that were most similar in terms of their covariates while giving preference to pairings that differed most in nurse staffing (see the Appendix for a discussion of the matching procedure).20 No pair could have hospitals from the same nurse staffing quintile category, which allowed us to designate the better-staffed hospital in each matched pair as having “high” staffing and the more poorly staffed hospital as having “low” staffing. We used Bo Lu and colleagues’21 nbpMatching package in the statistical software R.
After determining that our matching procedure achieved the intended goal of creating hospital pairings that were equivalent in all respects except for staffing (see the Appendix for a discussion of balance diagnostics),20 we used McNemar’s tests and conditional logistic regression to determine the effect of high versus low staffing on the odds of being penalized under the HRRP. We also tested the robustness of our findings by considering alternative specifications and approaches.20 Finally, we carried out a sensitivity analysis to evaluate how large the effect of an unmeasured factor would need to be to change our conclusions.22
Study Results
CHARACTERISTICS OF HOSPITALS AND MATCHED PAIRS
Beginning with 2,976 hospitals with fiscal year 2013 HRRP and covariate data, we matched 1,413 high-low staffing pairs (2,826 hospitals). Under the HRRP, the distribution of readmissions penalties for the 2,826 hospitals showed the following pattern: 794 hospitals (28 percent) received no penalty, while 251 (9 percent) received the maximum penalty. The majority of hospitals (1,781 hospitals, or 63 percent) were penalized, but by less than the maximum allowable amount. Among those hospitals receiving some penalty but less than the maximum, there was a declining trend, with roughly 40 percent of those hospitals (734 out of 1,781) receiving a penalty in the lower range (up to 0.2 percent), while fewer (136 out of 1,781, or 8 percent) received a penalty at the higher range (0.80–0.99 percent) (see Appendix Exhibit A for a graphic presentation).20
Exhibit 1 shows the characteristics of the hospitals before and after matching (see Appendix Exhibit B for standard deviation and percentage data).20 Absolute standardized differences in means less than 10 percent suggests good quality of matching between the high and low group for all covariates.23 A cross-match statistic24 of 0.60 (p = 1.00) indicates good covariate balance and suggests that if two hospitals with the same balancing score were chosen at random, one would have come from the high staffing group and one from the low staffing group 60 percent of the time—better than the 50 percent probability expected in a randomized control trial.
EXHIBIT 1.
Characteristics Of US Hospitals Before And After Matching For Analysis
| Variable | Before matching (number or mean)
|
After matching (number or mean)
|
Standardized difference in means (low versus high) (%) | ||
|---|---|---|---|---|---|
| Initial sample (n = 2,976) | Analytic sample (n = 2,826) | Low staffing (n = 1,413) | High staffing (n = 1,413) | ||
| Registered nurse hours per adjusted patient day | 6.4 | 6.5 | 5.1 | 8.0 | 164.1 |
| Balancing score | —a | —a | 7,170 | 7,170 | 0.0 |
| COVARIATES | |||||
| Number of beds | 227 | 224 | 219 | 229 | 5.3 |
| Resident/fellow physicians per bed | 0.06 | 0.05 | 0.05 | 0.06 | 5.6 |
| Operating profit margin | −0.02 | −0.02 | −0.02 | −0.02 | 0.9 |
| Percent black patients | 11.6 | 11.6 | 11.6 | 11.7 | 0.9 |
| Percent Hispanic patients | 2.3 | 2.4 | 2.4 | 2.4 | 0.5 |
| Percent Medicaid mix | 19.1 | 17.7 | 17.3 | 18.0 | 6.3 |
| Socioeconomic status indicator | −0.7 | −0.6 | −0.6 | −0.6 | 1.0 |
| Herfindahl-Hirschman Index | 772 | 766 | 802 | 729 | 4.7 |
| Technology level (number) | 3.5 | ||||
| High | 1,049 | 1,025 | 498 | 527 | |
| Low | 1,927 | 1,801 | 915 | 886 | |
| Ownership (number) | 0.4 | ||||
| For-profit | 578 | 575 | 289 | 286 | |
| Not-for-profit | 2,398 | 2,251 | 1,124 | 1,127 | |
| Geographic location (number) | 2.3 | ||||
| Urban | 2,655 | 2,548 | 1,280 | 1,268 | |
| Rural | 321 | 278 | 133 | 145 | |
| Skilled nursing facility (number) | 4.5 | ||||
| Yes | 485 | 360 | 167 | 193 | |
| No | 2,491 | 2,466 | 1,246 | 1,220 | |
SOURCE Authors’ analysis of data from all 2,976 hospitals with data and analytic sample of 2,826 matched hospitals. NOTE Standardized differences represent differences in means in units of standard deviation between the high and low staffing group for each covariate expressed as a percentage.
The balancing score for the high and low staffing hospital groups is estimated through the matching process; thus, there are no values prior to matching.
A concern with matching on a continuous variable such as staffing is that hospitals in the highest nurse staffing category would match only with those in the second-highest staffing category, and so forth. Exhibit 2 shows that we achieved well-distributed pairings across nurse-staffing-level categories. The majority of our matched pairs differed by more than one nurse staffing level: 64 percent differing by at least two staffing levels, and 23 percent differing by at least three staffing levels. Thus, we achieved excellent matching of hospitals with similar covariate distributions (Exhibit 3), while also achieving very good separation in terms of staffing (Exhibit 4). That is to say, the mean nurse staffing level in the high staffing group was 8.0 registered nurse hours per adjusted patient day versus 5.1 registered nurse hours per adjusted patient day in the low staffing group.
EXHIBIT 2.
Number Of Matched Pairings Of Hospitals, By High And Low Registered Nurse Staffing Category
| Low registered nurse staffing hospital groups | High registered nurse staffing hospital groups
|
||||
|---|---|---|---|---|---|
| 1 (lowest) | 2 | 3 | 4 | 5 (highest) | |
| 1 | 0 | 118 | 175 | 126 | 53 |
| 2 | – | 0 | 126 | 201 | 148 |
| 3 | – | – | 0 | 96 | 198 |
| 4 | – | – | – | 0 | 172 |
| 5 | – | – | – | – | 0 |
SOURCE Authors’ analysis of matched pairs from data on 2,826 hospitals. NOTE Each cell indicates the number of low staffing/high staffing pairs that were created based on the hospital quintile category of staffing.
EXHIBIT 3. Distribution Of Standardized Balancing Scores By High And Low Staffing Hospital Groups After Matching.
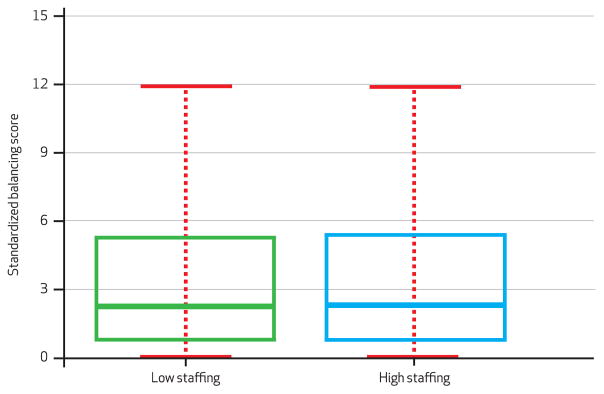
SOURCE Authors’ analysis of data from 2,826 hospitals. NOTE The figure demonstrates the outcome of matching in terms of achieving similarity across balancing scores for hospital groups with high and low nurse staffing. The boxplots show that the scores for the high and low staffing groups of hospitals are identical across the distribution. The line in the box is the median, the edges of the box are the twenty-fifth and seventy-fifth percentiles, and the ends of the whiskers represent the most extreme values that are within 1.5 times the interquartile range. A complete version of this exhibit showing outlier values is available in the online Appendix (see Note 20 in text).
EXHIBIT 4. Distribution Of Registered Nurse Hours Per Patient Day By High And Low Staffing Hospital Groups After Matching.

SOURCE Authors’ analysis of data from 2,826 hospitals. NOTE The figure demonstrates the outcome of matching in terms of achieving differences in registered nurse staffing levels between hospital groups with high and low nurse staffing. The boxplots show that registered nurse staffing levels for both the high and low staffing groups of hospitals are different across the distribution. The line in the box is the median, the edges of the box are the twenty-fifth and seventy-fifth percentiles, and the ends of the whiskers represent the most extreme values that are within 1.5 times the interquartile range. A complete version of this exhibit showing outlier values is available in the online Appendix (see Note 20 in text).
REGISTERED NURSE STAFFING LEVELS AND HRRP PERFORMANCE
If we assume that matching removed all bias, then hospitals with higher nurse staffing had 25 percent (odds ratio: 0.75; 95% confidence interval: 0.64–0.89) lower odds of being penalized than their lower-staffed counterparts. When we added controls for residual covariate imbalance, our results were unchanged (OR: 0.75; 95% CI: 0.63–0.88). In a model that compared fully penalized hospitals to all other hospitals, we saw an even bigger effect, which suggests that hospitals with higher nurse staffing had 41 percent (OR: 0.59; 95% CI: 0.44–0.92) lower odds of receiving the maximum penalty compared to their lower-staffed counterparts. In our primary analyses and all of the alternative specifications of our models, we consistently saw that hospitals with higher nurse staffing levels had significantly lower odds of being penalized than similar hospitals with lower nurse staffing levels (see Appendix Exhibit C for all model results).20
We also estimated logistic regression models evaluating the association between our continuous registered nurse staffing measure and the readmissions penalty. We included the same covariates used for matching as statistical controls. Estimates suggest that each additional nurse hour per adjusted patient day was associated with 10 percent lower odds (OR: 0.90; 95% CI: 0.86–0.93) of being penalized. To put this into context, the average difference between hospitals in the low and high staffing groups was 2.9 hours per adjusted patient day. The effect of high versus low staffing was associated with 25 percent lower odds of being penalized using nonbipartite matching.
Finally, because matching and our alternative specifications can account only for confounding factors that we can observe and measure, we evaluated how large the effect of an unobserved covariate would have to be to alter our conclusions. We assessed the point (cutoff value of p = 0.05) at which the inference that a high staffing level reduces the odds of penalization could no longer be supported by our data (see Appendix Exhibit D for a graphic presentation).20
Our estimates produced curves that allowed us to identify points between the curves that represented an unmeasured confounder whose effect on penalization and staffing would not affect the conclusion that high nurse staffing caused a reduction in penalization risk. In our case, for instance, the point (1.5, 1.5) represents an unmeasured confounder that increases the odds that a hospital is not penalized by a factor of 1.5 and increases the odds that a hospital has a high level of staffing by a factor of 1.5; this point is between the curves and thus presents strong evidence that a high level of staffing reduces the odds of penalization even if such an unmeasured confounder existed. An unmeasured confounder that doubled the odds of having both no penalty and high staffing, however, lies outside the two curves and would make the effect of staffing on penalization insignificant.
Discussion
Among a national sample of hospitals, we found that even after closely matching on hospital and patient population characteristics, hospitals with better registered nurse staffing levels were significantly less likely to be penalized under the CMS Hospital Readmissions Reduction Program than otherwise similar hospitals that were less well staffed.
The HRRP was intended to shift organizational behavior by changing financial incentives; exactly how organizations should respond to the incentives is less clear. Our findings point to management of nurse staffing levels and workloads as a potential system-level intervention through which hospitals can respond to the new regulatory environment.
BENEFITS FOR ALL HOSPITAL PATIENTS
Prior studies have demonstrated that better nurse staffing is associated with improved performance on various quality measures, including mortality, failure to rescue, patient satisfaction, and a range of morbidity and patient safety indicators.25 Although the HRRP focuses on a subset of patients, a distinct benefit of improving nurse staffing levels is the potential to improve outcomes for all patients, including other outcomes where staffing has a known effect and that are a focus for CMS value-based purchasing (such as patient satisfaction)26 and the hospital-acquired conditions program (that is, events that CMS will not pay for if acquired after admission to the hospital, such as certain infections).13,27,28 The ability to implement cross-cutting interventions that benefit multiple if not all populations will be increasingly important, especially as the number of conditions that are included in the HRRP’s excess readmissions calculation grows. CMS is required to expand the program to include readmissions of patients with chronic obstructive pulmonary disease and patients admitted for elective total hip or total knee arthroplasty for fiscal year 2015.
SUPPLEMENTARY ANALYSIS
The mechanism by which better staffing affects readmissions is almost certainly multifactorial in light of the presence of and need for nursing care across all aspects and throughout the duration of patients’ hospitalizations. Evidence suggests that nurses with more manageable workloads can do their work more effectively. This is important in the context of readmissions because nurses are responsible for core care processes that have been associated with fewer readmissions: discharge planning, patient education, complication surveillance and intervention, knowledge assessment, and care coordination. When nurses have excessive workloads, however, they cannot complete these important processes effectively, and they are more likely to leave this vital work undone because of competing priorities and a lack of staff and resources.10–12
Following our primary analysis, we linked Hospital Consumer Assessment of Healthcare Providers and Systems data from the Hospital Compare database and performed a supplementary analysis to examine whether our matched hospitals differed in terms of patients reports related to two factors that have been associated with readmissions: satisfaction with their hospital experience29 and whether they were given information about what to do during recovery at home11 (see online Appendix Exhibit E for results and details of the analysis).20 We focused on the item regarding information to promote recovery at home because nurses are generally responsible for providing such information and because evidence suggests that it is a care process that can often be omitted when nursing staff is insufficient to match the workload.
We found that a greater proportion of patients in better-staffed hospitals rated their hospital highly and would recommend it to friends and family—factors associated with readmissions29 and better staffing.26,30 Additionally, a small but significantly greater proportion of patients in well-staffed hospitals reported that they were given information that would help them recover at home, compared to patients discharged from other hospitals. This is consistent with our prior work, in which we found that a much larger proportion of nurses working in better-staffed hospitals reported being confident that their patients were prepared to manage their own care upon discharge.10
COMPARABILITY AMONG HOSPITALS
Matching allowed us to alleviate some concern regarding a central issue in estimating the effect of staffing with traditional regression approaches: that some well-staffed and some poorly staffed hospitals are not directly comparable. By matching, we ensured that there was sufficient overlap between the treatment and control groups in our covariates so that our estimates of treatment effects did not rely too heavily on extrapolation. In addition to basic structural characteristics, we took care to include covariates that have been suggested to distinguish hospitals with an increased likelihood of being penalized for readmissions. Matching, nevertheless, accounts only for measured covariates. To deal with this, we evaluated the robustness of our findings to bias from unobserved covariates and alternative specifications. Our findings were consistent in alternative specifications and insensitive to small to moderate biases.
As in most observational studies, however, the potential for unobserved bias remains. Some of the differences we found and are attributing to staffing might be traced to specific readmission prevention programs. Although we could not measure all of these processes directly, we would not expect these effects to be entirely unaccounted for because of our inclusion of important characteristics that account for differences in the likelihood of engaging in innovative program initiatives—characteristics such as teaching status, hospital size, market competition, and profit margin.31
It is not the case, however, that nurse staffing is an intervention that competes with these programs. Virtually all hospitals are engaged in quality improvement and readmissions prevention initiatives. Like most hospital quality improvement interventions, however, their implementation is dependent on and often carried out by nurses—in many cases extending the day-today work of nursing staff. This is particularly true for readmissions prevention, where many of the interventions are programmatic formalizations of core nursing processes of care such as discharge preparation, patient and family education, telephone follow-up, care coordination, and case management. We expect that the effectiveness of any readmission prevention program, like any other part of a nurse’s job, would depend on having sufficient well-trained nurses to implement it.
ADMINISTRATIVE DATA ISSUES
The American Hospital Association survey data from which our staffing variable was derived are an imperfect administrative source. There are documented concerns with these data, which we accounted for in part. Also, these data are one of the few nationwide data sources for nurse staffing. Using these data improves the generalizability of our findings on this national policy; they have been used previously in such studies.32 The data allowed us to look at registered nurse staffing for the inpatient setting but did not permit us to specifically observe the time nurses spent with patients with the three conditions in question. Research that has directly linked the level of staffing with individual patient outcomes, however, is consistent with the literature on aggregated staffing measures and outcomes.33
Additionally, research examining the relationship between staffing and readmissions among the Medicare beneficiaries affected by the HRRP shows that the American Hospital Association’s staffing measure and a patient-to-nurse ratio derived directly from nurses’ reports of staffing are both associated with readmissions.10 It is also notable that examining the hospitals’ HRRP penalties is not necessarily the same thing as examining their actual readmission rates, with which staffing has also been associated. Calculations used for the HRRP are based on shrinkage models, which may mute the penalty for some low-volume hospitals, given their actual readmission rates.34
TOOLS FOR IMPROVING HOSPITAL NURSE STAFFING
There are multiple approaches to achieving better nurse staffing levels. Variation in hospital staffing models and practices are largely within the scope of hospital administrators and managers. Our findings suggest that even when we match hospitals on conditions commonly cited as being limiting factors for taking action—market factors, financial margins, and the racial and socioeconomic composition of the hospital patient population—differences in staffing determine whether otherwise similar hospitals will be penalized under the program. This highlights an opportunity for administrators to focus on their nursing workforce as a means of addressing readmissions.
There are also policy tools that can improve staffing levels, including mandated minimum staffing levels, benchmarking and payment incentives based on nurse staffing and work environment quality, and public reporting of nurse staffing levels. California is the only state that has established extensive limits on the number of patients that hospital nurses can care for at a given time. In Massachusetts, however, there is an active campaign by the state’s largest nurses’ union to put a question to voters on the November 2014 ballot that would limit acute care hospital nurses’ workload.35
At the federal level, a bill recently introduced in the 113th Congress, the Registered Nurse Safe Staffing Act of 2013 (H.R. 1821), proposes requiring hospital nurse staffing committees, made up largely of nurses, to develop unit-by-unit plans to determine the appropriate number and mix of nursing staff. The bill also proposes adding nurse staffing and nursing-sensitive outcomes to the set of publicly reported data on the CMS Hospital Compare database, where hospital readmissions data are now being reported.
Such public reporting laws are often intended to improve safety by motivating providers to change behavior (for example, to increase staffing) as they benchmark against each other or by informing patients’ choices to encourage them to select better providers (for example, those with better nurse staffing levels). Combining system-level policy mechanisms with effective transitional care, discharge planning, telehealth, and care coordination programs4–7 that target high-risk patients may prove to be the most effective approach for reducing readmissions.
Conclusion
The Hospital Readmissions Reduction Program, passed as part of the Affordable Care Act, is intended to bring hospitals’ financial incentives into alignment with payers’ and patients’ quality and value goals. Our findings highlight a component of the hospital care delivery system that can be targeted to limit hospitals’ exposure to readmissions penalties while improving patient outcomes. By focusing on a system factor such as nurse staffing, administrators may be able to address multiple quality issues while reducing their likelihood of penalty for excess readmissions. Policy makers also may be able to gain traction on readmissions and their attendant costs through policy that creates a care environment sufficiently staffed and resourced to allow health care providers to do their work most effectively.
Supplementary Material
Acknowledgments
Funding came from the National Institute on Aging (R01AG041099-01, McHugh), the Robert Wood Johnson Foundation Nurse Faculty Scholars program (McHugh), the Penn Institute for Urban Research (McHugh and Berez), and the Leonard Davis Institute of Health Economics (Berez). The authors gratefully acknowledge the assistance of Mikaella Hill with manuscript preparation.
Footnotes
A previous version of this article was presented at the AcademyHealth Annual Research Meeting, June 2013, in Baltimore, Maryland.
Contributor Information
Matthew D. McHugh, Email: mchughm@nursing.upenn.edu, Associate professor of nursing at the Center for Health Outcomes and Policy Research, School of Nursing, University of Pennsylvania, and a senior fellow at the Leonard Davis Institute of Health Economics, University of Pennsylvania, in Philadelphia
Julie Berez, Undergraduate student at the University of Pennsylvania and a research associate at the Center for Health Outcomes and Policy Research, School of Nursing, University of Pennsylvania.
Dylan S. Small, Associate professor of statistics in the Department of Statistics, Wharton School, University of Pennsylvania
NOTES
- 1.Centers for Medicare and Medicaid Services. Medicare program; hospital inpatient prospective payment systems for acute care hospitals and the long-term care hospital prospective payment system and fiscal year 2013 rates; hospitals’ resident caps for graduate medical education payment purposes; quality reporting requirements for specific providers and for ambulatory surgical centers; final rule. Fed Regist. 2012;77(170):53258–750. [PubMed] [Google Scholar]
- 2.Jencks SF, Williams MV, Coleman EA. Rehospitalizations among patients in the Medicare fee-for-service program. N Engl J Med. 2009;360(14):1418–28. doi: 10.1056/NEJMsa0803563. [DOI] [PubMed] [Google Scholar]
- 3.Medicare Payment Advisory Commission. Report to the Congress: promoting greater efficiency in Medicare. Washington (DC): MedPAC; 2007. Payment policy for in-patient readmissions; pp. 103–20. [Google Scholar]
- 4.Naylor MD, Brooten D, Campbell R, Jacobsen BS, Mezey MD, Pauly MV, et al. Comprehensive discharge planning and home follow-up of hospitalized elders: a randomized clinical trial. JAMA. 1999;281(7):613–20. doi: 10.1001/jama.281.7.613. [DOI] [PubMed] [Google Scholar]
- 5.Coleman EA, Parry C, Chalmers S, Min S. The Care Transitions Intervention: results of a randomized controlled trial. Arch Intern Med. 2006;166(17):1822–8. doi: 10.1001/archinte.166.17.1822. [DOI] [PubMed] [Google Scholar]
- 6.Jack BW, Chetty VK, Anthony D, Greenwald JL, Sanchez GM, Johnson AE, et al. A reengineered hospital discharge program to decrease rehospitalization. Ann Intern Med. 2009;150(3):178–87. doi: 10.7326/0003-4819-150-3-200902030-00007. [DOI] [PMC free article] [PubMed] [Google Scholar]
- 7.Kind AJH, Jensen L, Barczi S, Bridges A, Kordahl R, Smith MA, et al. Low-cost transitional care with nurse managers making mostly phone contact with patients cut rehospitalization at a VA hospital. Health Aff (Millwood) 2012;31(12):2659–68. doi: 10.1377/hlthaff.2012.0366. [DOI] [PMC free article] [PubMed] [Google Scholar]
- 8.Peikes D, Chen A, Schore J, Brown R. Effects of care coordination on hospitalization, quality of care, and health care expenditures among Medicare beneficiaries: 15 randomized trials. JAMA. 2009;301(6):603–18. doi: 10.1001/jama.2009.126. [DOI] [PubMed] [Google Scholar]
- 9.Sochalski J, Jaarsma T, Krumholz HM, Laramee A, McMurray JJ, Naylor MD, et al. What works in chronic care management: the case of heart failure. Health Aff (Millwood) 2009;28(1):179–89. doi: 10.1377/hlthaff.28.1.179. [DOI] [PubMed] [Google Scholar]
- 10.McHugh MD, Ma T. The effect of hospital nursing on 30-day readmission among Medicare patients with heart failure, acute myocardial infarction, and pneumonia. Med Care. 2013;51(1):52–9. doi: 10.1097/MLR.0b013e3182763284. [DOI] [PMC free article] [PubMed] [Google Scholar]
- 11.Weiss ME, Yakusheva O, Bobay KL. Quality and cost analysis of nurse staffing, discharge preparation, and postdischarge utilization. Health Serv Res. 2011;46(5):1473–94. doi: 10.1111/j.1475-6773.2011.01267.x. [DOI] [PMC free article] [PubMed] [Google Scholar]
- 12.Kalisch BJ, Landstrom G, Williams RA. Missed nursing care: errors of omission. Nurs Outlook. 2009;57(1):3–9. doi: 10.1016/j.outlook.2008.05.007. [DOI] [PubMed] [Google Scholar]
- 13.Cimiotti JP, Aiken LH, Sloane DM, Wu ES. Nurse staffing, burnout, and health care–associated infection. Am J Infect Control. 2012;40(6):486–90. doi: 10.1016/j.ajic.2012.02.029. [DOI] [PMC free article] [PubMed] [Google Scholar]
- 14.Lucero RJ, Lake ET, Aiken LH. Nursing care quality and adverse events in US hospitals. J Clin Nurs. 2010;19(15–16):2185–95. doi: 10.1111/j.1365-2702.2010.03250.x. [DOI] [PMC free article] [PubMed] [Google Scholar]
- 15.Kandilov A, McCall N, Dalton K, Miller RD. Readmissions due to hospital-acquired conditions (HACs): final report. Research Triangle Park (NC): RTI International; 2012. (Contract No. HHSM-500-2005-00029I.) [Google Scholar]
- 16.Spetz J, Donaldson N, Aydin C, Brown DS. How many nurses per patient? Measurements of nurse staffing in health services research. Health Serv Res. 2008;43(5):1674–92. doi: 10.1111/j.1475-6773.2008.00850.x. [DOI] [PMC free article] [PubMed] [Google Scholar]
- 17.Joynt KE, Jha AK. Characteristics of hospitals receiving penalties under the Hospital Readmissions Reduction Program. JAMA. 2013;309(4):342–3. doi: 10.1001/jama.2012.94856. [DOI] [PubMed] [Google Scholar]
- 18.McHugh MD, Carthon-Brooks JM, Kang XL. Medicare readmissions policies and racial and ethnic health disparities: a cautionary tale. Policy Polit Nurs Pract. 2010;11(4):309–16. doi: 10.1177/1527154411398490. [DOI] [PMC free article] [PubMed] [Google Scholar]
- 19.Joynt KE, Orav EJ, Jha AK. Thirty-day readmission rates for Medicare beneficiaries by race and site of care. JAMA. 2011;305(7):675. doi: 10.1001/jama.2011.123. [DOI] [PMC free article] [PubMed] [Google Scholar]
- 20.To access the Appendix, click on the Appendix link in the box to the right of the article online.
- 21.Lu B, Greevy R, Xu X, Beck C. Optimal nonbipartite matching and its statistical applications. Am Stat. 2011;65(1):21–30. doi: 10.1198/tast.2011.08294. [DOI] [PMC free article] [PubMed] [Google Scholar]
- 22.Rosenbaum PR, Silber JH. Amplification of sensitivity analysis in matched observational studies. J Am Stat Assoc. 2009;104(488):1398–405. doi: 10.1198/jasa.2009.tm08470. [DOI] [PMC free article] [PubMed] [Google Scholar]
- 23.Austin PC. Balance diagnostics for comparing the distribution of baseline covariates between treatment groups in propensity-score matched samples. Stat Med. 2009;28:3083–107. doi: 10.1002/sim.3697. [DOI] [PMC free article] [PubMed] [Google Scholar]
- 24.Heller R, Rosenbaum PR, Small DS. Using the cross-match test to appraise covariate balance in matched pairs. Am Stat. 2010;64(4):299–309. [Google Scholar]
- 25.Shekelle PG. Nurse-patient ratios as a patient safety strategy: a systematic review. Ann Intern Med. 2013;158(5 Part 2):404–9. doi: 10.7326/0003-4819-158-5-201303051-00007. [DOI] [PubMed] [Google Scholar]
- 26.Kutney-Lee A, McHugh MD, Sloane DM, Cimiotti JP, Flynn L, Neff DF, et al. Nursing: a key to patient satisfaction. Health Aff (Millwood) 2009;28(4):w669–77. doi: 10.1377/hlthaff.28.4.w669. [DOI] [PMC free article] [PubMed] [Google Scholar]
- 27.McHugh MD, Shang J, Sloane DM, Aiken LH. Risk factors for hospital-acquired “poor glycemic control”: a case-control study. Int J Qual Health Care. 2011;23(1):44–51. doi: 10.1093/intqhc/mzq067. [DOI] [PMC free article] [PubMed] [Google Scholar]
- 28.Needleman J, Buerhaus P, Mattke S, Stewart M, Zelevinsky K. Nurse-staffing levels and the quality of care in hospitals. N Engl J Med. 2002;346(22):1715–22. doi: 10.1056/NEJMsa012247. [DOI] [PubMed] [Google Scholar]
- 29.Boulding W, Glickman SW, Manary MP, Schulman KA, Staelin R. Relationship between patient satisfaction with inpatient care and hospital readmission within 30 days. Am J Manag Care. 2011;17(1):41–8. [PubMed] [Google Scholar]
- 30.McHugh MD, Kutney-Lee A, Cimiotti JP, Sloane DM, Aiken LH. Nurses’ widespread job dissatisfaction, burnout, and frustration with health benefits signal problems for patient care. Health Aff (Millwood) 2011;30(2):202–10. doi: 10.1377/hlthaff.2010.0100. [DOI] [PMC free article] [PubMed] [Google Scholar]
- 31.Greenhalgh T, Robert G, Macfarlane F, Bate P, Kyriakidou O. Diffusion of innovations in service organizations: systematic review and recommendations. Milbank Q. 2004;82(4):581–629. doi: 10.1111/j.0887-378X.2004.00325.x. [DOI] [PMC free article] [PubMed] [Google Scholar]
- 32.Jha AK, Orav EJ, Epstein AM. Public reporting of discharge planning and rates of readmissions. N Engl J Med. 2009;361(27):2637–45. doi: 10.1056/NEJMsa0904859. [DOI] [PubMed] [Google Scholar]
- 33.Needleman J, Buerhaus P, Pankratz VS, Leibson CL, Stevens SR, Harris M. Nurse staffing and inpatient hospital mortality. N Engl J Med. 2011;364(11):1037–45. doi: 10.1056/NEJMsa1001025. [DOI] [PubMed] [Google Scholar]
- 34.Silber JH, Rosenbaum PR, Brachet TJ, Ross RN, Bressler LJ, Even-Shoshan O, et al. The Hospital Compare mortality model and the volume-outcome relationship. Health Serv Res. 2010;45(5 Pt 1):1148–67. doi: 10.1111/j.1475-6773.2010.01130.x. [DOI] [PMC free article] [PubMed] [Google Scholar]
- 35.Kowalczyk L. Boston Globe. 2013. Aug 4, Nurses union to file ballot question asking voters to limit number of patients. [Google Scholar]
Associated Data
This section collects any data citations, data availability statements, or supplementary materials included in this article.