Abstract
Two-dimensional (2D) shear wave elastography presents 2D quantitative shear elasticity maps of tissue, which are clinically useful for both focal lesion detection and diffuse disease diagnosis. Realization of 2D shear wave elastography on conventional ultrasound scanners, however, is challenging due to the low tracking pulse-repetition-frequency (PRF) of these systems. While some clinical and research platforms support software beamforming and plane wave imaging with high PRF, the majority of current clinical ultrasound systems do not have the software beamforming capability, which presents a critical challenge for translating the 2D shear wave elastography technique from laboratory to clinical scanners. To address this challenge, this paper presents a Time Aligned Sequential Tracking (TAST) method for shear wave tracking on conventional ultrasound scanners. TAST takes advantage of the parallel beamforming capability of conventional systems and realizes high PRF shear wave tracking by sequentially firing tracking vectors and aligning shear wave data in the temporal direction. The Comb-push Ultrasound Shear Elastography (CUSE) technique was used to simultaneously produce multiple shear wave sources within the field-of-view (FOV) to enhance shear wave signal-to-noise-ratio (SNR) and facilitate robust reconstructions of 2D elasticity maps. TAST and CUSE were realized on a conventional ultrasound scanner (the General Electric LOGIQ E9). A phantom study showed that the shear wave speed measurements from the LOGIQ E9 were in good agreement to the values measured from other 2D shear wave imaging technologies. An inclusion phantom study showed that the LOGIQ E9 had comparable performance to the Aixplorer (Supersonic Imagine) in terms of bias and precision in measuring different sized inclusions. Finally, in vivo case analysis of a breast with a malignant mass, and a liver from a healthy subject demonstrated the feasibility of using the LOGIQ E9 for in vivo 2D shear wave elastography. These promising results indicate that the proposed technique can enable the implementation of 2D shear wave elastography on conventional ultrasound scanners and potentially facilitate wider clinical applications with shear wave elastography.
Index terms: Shear wave elastography, acoustic radiation force, CUSE, LOGIQ E9
INTRODUCTION
Ultrasound shear wave elastography is an emerging ultrasound imaging technique that can noninvasively and quantitatively characterize tissue mechanical properties [1, 2]. Numerous research and clinical studies have shown promising results of using shear wave elastography in a variety of important clinical applications such as liver fibrosis staging and breast cancer mass detection [2–8]. Among different shear wave elastography methods, two-dimensional (2D) shear wave elastography presents 2D elastograms that show contrast between malignant and normal tissues [9–13], which can be useful in applications such as focal lesion detection [7]. Also, the 2D shear wave elastography approach samples a larger area of the tissue than the 1D method [14], which may reduce the sampling variability for diffuse disease diagnosis such as liver fibrosis staging. The 2D shear wave elastography technique is widely utilized in both research and clinical applications worldwide.
To date, the implementation of 2D shear wave elastography on ultrasound systems, however, is limited by the low pulse-repetition-frequency (PRF) of conventional ultrasound scanners, which is typically on the order of several tens of Hertz. To address this challenge, Baghani et al. proposed a sector-based high-frame-rate acquisition technique which allows robust tracking of steady-state periodic shear wave motions [15]; Wu et al. and Hazard et al. proposed the crawling wave technique which allows traditional scanners to track the shear wave interference patterns with low PRF [12, 16]. These approaches, however, rely on the periodic nature of the excitation and cannot be used to track the fast-propagating and transient shear waves generated by acoustic radiation force. The PRF of conventional scanners is fundamentally restricted by the low parallel receive capability of the hardware beamformers that are used on these systems, which can only beamform a limited number of imaging lines in one pulse-echo cycle. Therefore, a line-by-line scan is typically required to form an image, which significantly lowers the PRF. Recently, software beamformers have become available on some clinical and research ultrasound platforms, enabling high PRF tracking capability through the use of plane wave or synthetic aperture imaging [4, 17, 18]. Although such platforms provide better support for shear wave tracking and 2D shear wave elastography, the majority of current clinical ultrasound systems do not have this software beamforming capability. This remains as a critical hurdle for translating 2D shear wave elastography into mainstream ultrasound systems.
To address this challenge, this paper presents a Time Aligned Sequential Tracking (TAST) method for shear wave tracking on conventional ultrasound scanners. The digital hardware beamformers typically support beamforming of multiple imaging lines in one pulse-echo cycle to increase imaging frame rate, which is called parallel receive beamforming [19, 20]. TAST takes advantage of the parallel receive beamforming capability of these systems and sequentially and repeatedly fires multiple groups of tracking vectors along the lateral direction to capture shear wave signals. A data alignment scheme is proposed to remove the temporal asynchrony among different tracking vectors and recover high effective PRF by upsampling. To enhance shear wave signal-to-noise-ratio (SNR) and facilitate robust reconstructions of 2D elastograms, the Comb-push Ultrasound Shear Elastography (CUSE) technique was used in this study. CUSE effectively enhances shear wave SNR by distributing multiple shear wave sources inside the field-of-view (FOV) simultaneously so that each imaging pixel is near a shear wave source [10, 11]. CUSE was combined with TAST in this study to realize 2D shear wave elastography on a conventional ultrasound scanner.
The paper is structured as follows: we first describe the principles of TAST and the combination of TAST and CUSE on the General Electric (GE) LOGIQ E9 (LE9) scanner. We then introduce two phantom studies (both homogeneous and inhomogeneous phantoms) to compare the performance of the LE9 with other shear wave imaging technologies. Finally we show in vivo case studies of a breast with a malignant mass and a liver from a healthy subject using the LE9. We close the paper with discussion and conclusions.
MATERIALS AND METHODS
A. Principles of Time Aligned Sequential Tracking (TAST)
The theoretical PRF of a pulse-echo system is determined by the round-trip travelling time of ultrasound. Given an imaging depth of d, the PRF is given by:
| (1) |
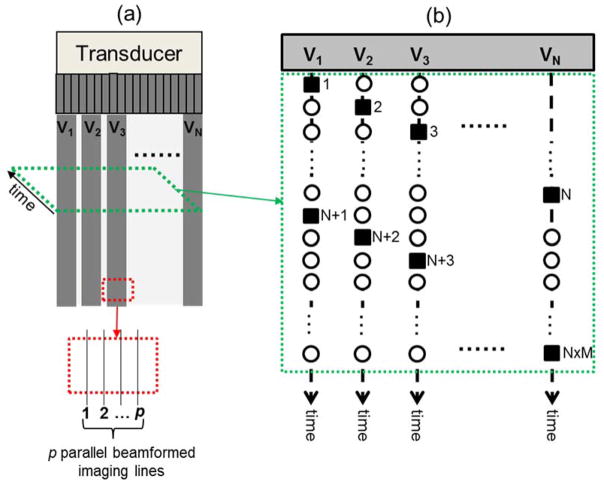
where c is the ultrasound speed. In a system setup as shown in Fig. 1(a), where N imaging vectors are used and each imaging vector contains p imaging lines that are parallel beamformed, the effective PRF (PRFe) of the system is
Figure 1.
Schematic plots of the sequential shear wave tracking sequence. (a) imaging FOV and the imaging vectors. Each imaging vector contains p imaging lines that can be parallel beamformed. The tracking sequence within a slice of the data at a certain depth is shown in (b), as indicated by the green dashed parallelogram with an arrow indicating the temporal direction (slow time). (b) the sequential tracking sequence of the N imaging vectors. The solid squares indicate the tracked shear wave data points. The hollow circles indicate the missed data points.
| (2) |
where L is the total number of imaging lines and is equal to N x p. Depending on the number of imaging lines and the parallel beamforming capability, the effective PRF can vary from several tens of Hertz to several thousands of Hertz. For example, given an imaging depth of 4 cm, PRF can be as high as 19,250 Hz given a sound speed of 1540 m/s. If L is 128 and p is 4, the effective PRF will drop to about 600 Hz, which is too low to be used for shear wave tracking (since the shear wave frequency in tissue can be a few hundred Hertz). To improve effective PRF, one can cut the number of imaging lines by half, which requires either doubling the spacing between imaging lines if the same width of the field-of-view (FOV) is desired, or shrinking the width of the FOV by a factor of 2 if the spacing of imaging lines needs to be maintained. Alternatively, one can divide the imaging area into multiple zones so that each zone will have higher effective PRF. For example, one can use the first half of the imaging vectors (V1 to VN/2) to perform shear wave tracking, and then translate to the second half of the imaging vectors (VN/2+1 to VN) to perform another round of shear wave tracking. In this way the number of imaging lines in each zone is effectively reduced by a factor of 2, and therefore the effective PRF of each zone is doubled (i.e. from 600 Hz to 1200 Hz). Now the effective PRF of each zone becomes
| (3) |
where Z is the number of zones. Note that the multi-zone detection scheme does require multiple cycles of push-and-detect shear wave data acquisitions in order to maintain the equivalently high effective PRF within each zone. This increases the total data acquisition time and may allow physiological motion artifacts into the final 2D elastograms. If the desired effective PRF is 4 kHz (which is sufficient for shear wave tracking in most soft tissues), p is 4, L is 128 (which can cover the entire FOV with a lateral resolution of about 0.3 mm given a probe width of about 4 cm), and the imaging depth is 4 cm, the total number of zones would be about 6.6, which means that 7 push-detect data acquisitions will be required. Given a typical data acquisition time of 30 ms per zone, the total duration of data acquisition would be 210 ms, which is still short compared to breathing motion and pulsatile motion of vessels. Therefore, it is theoretically feasible to use conventional ultrasound scanners for shear wave tracking with high PRF.
Based on the analysis above, TAST sequentially excites imaging vectors inside a single imaging zone to track shear waves, as shown in Fig. 1(b). The N imaging vectors are excited sequentially and iteratively in the following order: V1 → V2 → V3 → … → VN−1 → VN → V1 → V2 → …. For each transmission, p imaging lines are beamformed, from which the shear wave motion signal can be demodulated [21]. For example, the first firing of V1 will track a shear wave motion at time point 1, as shown by the solid square under vector V1 in Fig. 1(b). The next firing of V2 will track a shear wave signal at time point 2, etc. The order of the tracked shear wave signal points is: 1 → 2 → 3 → … N → N+1 → N+2 → … N x M (M is the total number of iterations and is given by the total duration of detection within each zone multiplied by PRFe), as shown in Fig. 1(b). For actual shear wave imaging, this tracking sequence will be initiated after the push beam sequence so that shear waves propagating inside the FOV can be tracked.
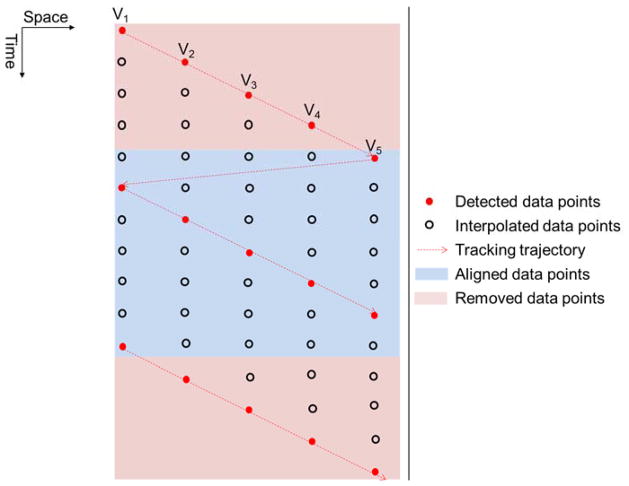
TAST introduces a time delay to shear wave signals tracked by different imaging vectors, i.e. the starting point in time at V1 is different from the starting point in time at V2, as shown in Fig. 1(b). This delay, if uncompensated for, can introduce error into the shear wave speed calculation. To remove the delay and align the data, an upsampling-based approach is proposed. Figure 2 shows an example using 5 imaging vectors for TAST. For each imaging vector, the original detected shear wave signal samples are upsampled by interpolation along the time direction (the “interp” function of Matlab (The Mathworks Inc., Natick, MA)) so that the points that were missed because of the sequential tracking can be retrieved. The interpolated data samples are indicated by the black circles in Fig. 2. One can obtain a data set without delay caused by sequential tracking by removing the data points in the pink areas as shown in Fig. 2.
Figure 2.
Schematic plot of the time alignment approach for tracking delay compensation.
To generalize, given N imaging vectors and M data samples per imaging vector (as shown in Fig. 1(b)), this time alignment method includes the following steps:
Upsample the original shear wave signal with M data points by a factor of N. The upsampled data has a length of (M − 1) × N + 1. The upsampled data has a PRF that is equal to the effective PRF times N.
To align the shear wave signal, for vector n (n = 1, 2, … N), remove the first N − n data points and the last n − 1 data points. The aligned shear wave signal should have a dimension of N × (M − 2) + 2 by N (time by space).
B. Validation of TAST
To validate TAST, an out-of-plane shear wave imaging method similar to [22] was used, as shown in Fig. 3. A linear array transducer L7-4 (Philips Healthcare, Andover, MA, USA) was driven by the Verasonics V-1 system (Verasonics Inc., Redmond, WA, USA) to produce an out-of-plane shear wave (the “push” transducer in Fig. 3). TAST was implemented on the GE LOGIQ E9 (GE Healthcare, Wauwatosa, WI) system to track the shear waves (the “detect” transducer (9L-D (GE Healthcare, Wauwatosa, WI)) in Fig. 3). For the LE9, 12 imaging vectors were sequentially excited. Each imaging vector had 4 imaging lines that were parallel beamformed. The number of zones was 1, and the effective PRF was 1.3 kHz.
Figure 3.
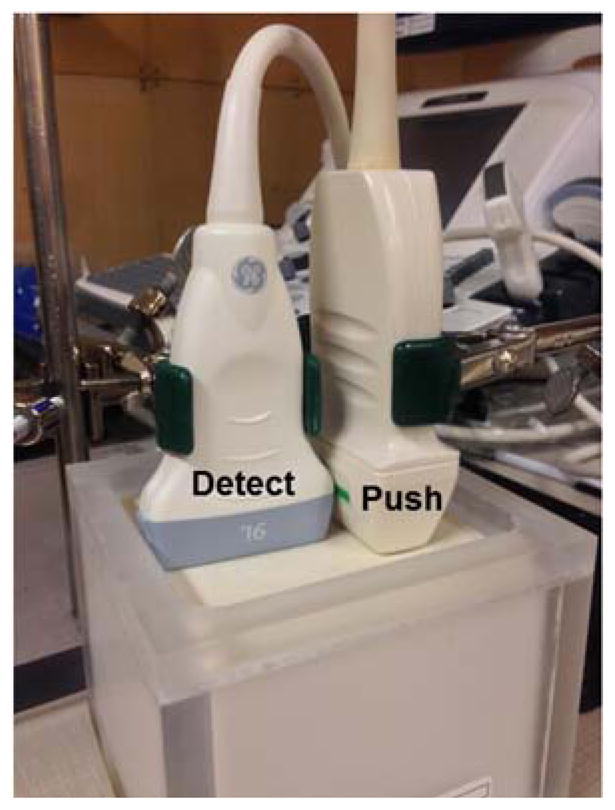
Imaging setup for the validation study of TAST. The Philips L7-4 probe was used to produce an out-of-plane shear wave for the GE 9L-D probe to track.
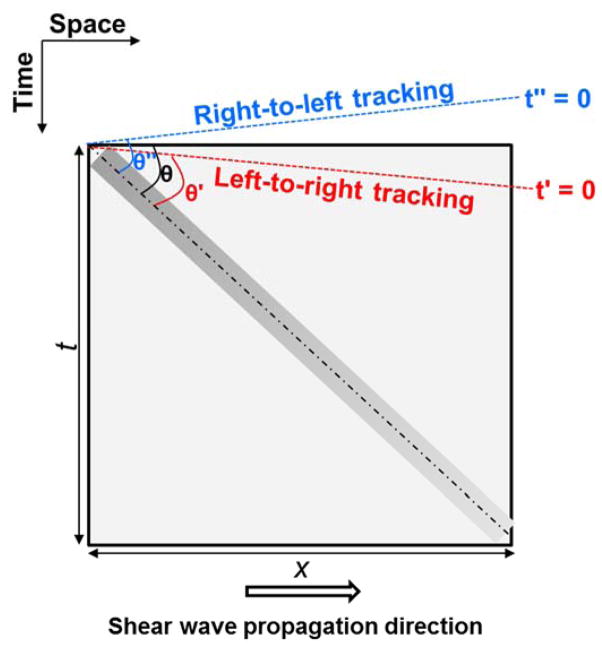
A custom made homogeneous elasticity phantom (CIRS Inc., Norfolk, VA, USA) was used for the validation. Figure 4 shows a schematic plot of the relationship of the detected shear wave signal and TAST tracking sequence. Given that the shear wave propagates from left to right by distance x during time t, shear wave speed can be calculated by x/t, which is equal to cot(θ), as shown in Fig. 4. If the tracking direction is the same as the shear wave propagation direction (i.e. from left to right), the apparent starting time would be t′ = 0 (Fig. 4), and the apparent shear wave speed will be higher because of a smaller θ′; if the tracking direction is opposite to the shear wave propagation direction, the apparent starting time would be t″ = 0, and the apparent shear wave speed will be lower because of a larger θ″. In this study, the shear wave was propagating from left to right and the tracking was also from left to right. The measured shear wave speed before alignment is 1.33 m/s, and after alignment is 1.28 m/s. This corroborates the theory presented above. The shear wave speed of the phantom measured from the Aixplorer (Supersonic Imagine, Aix-en-Provence, France) was 1.28 m/s. This validates that TAST can robustly track shear wave signals and accurately evaluate shear wave speed on a conventional ultrasound scanner.
Figure 4.
Schematic plot of the relationship between detected shear wave signal (the bar-shaped rectangle with gradient) and TAST tracking sequence. The shear wave propagates from left to right. If the tracking direction is left-to-right, then the apparent shear wave speed will be biased high (indicated by θ′ which is smaller than θ); if the tracking direction is right-to-left, then the apparent shear wave speed will be biased low (indicated by θ″ which is greater than θ). Shear wave speed is given by cot(θ). The t′ and t″ lines indicate the apparent starting times of the shear wave signal detected by the sequential tracking scheme.
C. Combining TAST with Comb-push Ultrasound Shear Elastography (CUSE)
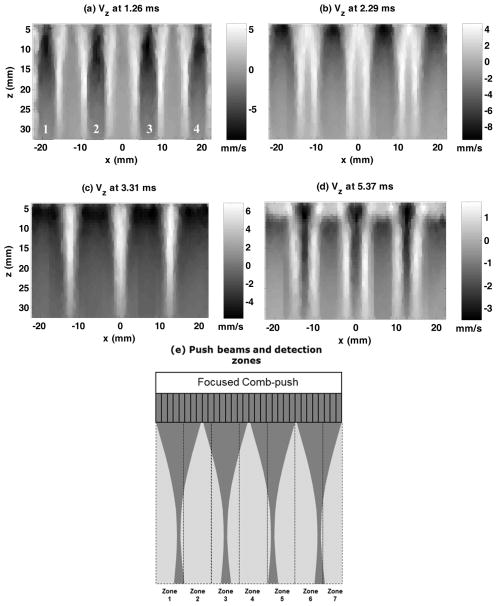
A novel shear wave imaging technique, CUSE, was used in this study to combine with TAST and provide robust 2D shear wave elastography on the LE9. CUSE generates multiple shear wave sources into the FOV and uses directional filtering to remove the interference so that robust full FOV 2D elastograms can be obtained. The principles of CUSE are the same as in [10, 11] and only the plane wave imaging detection part of CUSE was replaced by TAST. Both TAST and CUSE were implemented on an LE9 for the linear array transducer, 9L-D (GE Healthcare, Wauwatosa, WI; bandwidth: 2–8 MHz), and the curved array transducer, C1-6-D (GE Healthcare, Wauwatosa, WI; bandwidth: 1–6 MHz). The transducers used in this study are all conventional imaging transducers and were not modified. For the C1-6-D, to account for the geometry of the transducer, the standard scan conversion of the LE9 system was used to convert all the data points to uniform spatial grids. Figure 5 shows an example of F-CUSE shear wave propagation acquired from the 9L-D transducer in a CIRS homogeneous elasticity phantom (the same phantom used in the previous section). F-CUSE uses focused comb-push by simultaneously transmitting four focused push beams to generate shear waves, as shown in Fig. 5. One can clearly resolve 4 shear waves produced by the 4-tooth focused comb-push.
Figure 5.
(a) – (d): Snapshots of the CUSE shear wave propagation movie at different time instants obtained from the 9L-D probe on the LE9. A 4-tooth focused comb-push was transmitted and the resulting shear waves were tracked by TAST. The numbers in (a) indicate the push beam location. (e): schematic plot of the comb-push beams and the imaging zones (given a desired PRFe of 4 kHz and 128 imaging lines).
Figure 5(e) shows a schematic plot of the multiple imaging zones and the comb-push beams that were used to generate the results shown in Figs. 5(a) – (d). The number of imaging zones is given by Eq. (3), and the tracking setup follows the example given in section A (i.e. PRFe = 4 kHz, p = 4, L = 128). A total of 7 zones and consequently 7 push-detect data acquisitions were needed. Note that the comb-push beams are independent of the imaging zones and were applied to the same locations for each push-detect data acquisition.
After directional filtering, the 2D shear wave speed calculation as proposed in [23] was used to reconstruct the 2D shear wave speed maps. Figure 6(a) shows the reconstructed 2D shear wave speed map from the shear waves of Fig. 5. The same phantom was imaged with the C1-6-D array transducer and the 2D shear wave speed map is shown in Fig. 6(b). The shear wave speed maps from both transducers are smooth and without artifact. The shear wave speed measurements were 1.29 m/s from both transducers, which are in good agreement with the Aixplorer measurements.
Figure 6.
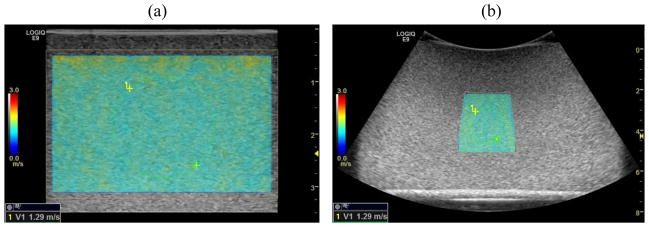
(a) 2D shear wave speed map reconstructed from the shear waves in Fig. 5 on the 9L-D probe. (b) 2D shear wave speed map reconstructed from the same phantom on the C1-6-D probe. The green dashed circles indicate the ROIs selected for shear wave speed measurement.
D. Homogeneous Phantom Study
To test the accuracy of shear wave speed measurement on the LE9 using TAST and CUSE, two homogeneous elasticity phantoms used in the QIBA (Quantitative Imaging Biomarkers Alliance) study [24] were imaged using the LE9 and the Aixplorer. The QIBA study involved 12 institutions and multiple shear wave imaging modalities to test 11 pairs of phantoms custom made by CIRS. The 11 pairs of phantoms were assumed to be identical and one pair of the phantoms was used in this study (each pair has a softer phantom (shear wave speed about 0.9 m/s) and a stiffer phantom (shear wave speed about 2.1 m/s)). Both the 9L-D and the C1-6-D transducers on the LE9 were used. For both transducers, following [24], three different data acquisitions were conducted at three different depths of the phantom: 1.0 cm, 2.5 cm, and 4.0 cm for the 9L-D, and 3.0 cm, 4.5 cm, and 7.0 cm for the C1-6-D. For the 9L-D, the PRFe was 5.2 kHz, number of zones was 4 for 1.0 cm and 5 for 2.5 cm and 4.0 cm, push beam center frequency was 5 MHz for 1.0 cm and 4.1 MHz for 2.5 cm and 4.0 cm, and push duration was 600 μs. For the C1-6-D, the PRFe was 2.4 kHz, number of zones was 5 for 3.0 cm and 4 for 4.5 cm and 7.0 cm, push beam center frequency was 2.5 MHz for 3.0 cm and 4.5 cm and 2.2 MHz for 7.0 cm, and push duration was 600 μs. No frame averaging was used on the LE9. The same procedure was conducted on the Aixplorer, where the L10-2 and C6-1 transducers were used under the available phantom mode with default settings. For each Aixplorer data acquisition, the image was saved after 3 consecutive updates of the elastograms. Shear wave speed measurements were used to compare the performance of the LE9 with the Aixplorer as well as the results from the QIBA phantom study.
E. Inclusion Phantom Study
This part of the study was conducted to test the bias and precision of measuring different sized inclusions with different stiffness using TAST and CUSE on the LE9. The performance of the LE9 was compared with the Aixplorer, which is a state-of-the-art shear wave imaging system. For the LE9, the PRFe was 3.9 kHz, number of zones was 10, push beam center frequency was 4.1 MHz, and push duration was 600 μs. A stepped cylindrical inclusion phantom (CIRS 049A) was used in this part of the study. The Type IV inclusion (nominal shear wave speed of 5.2 m/s) and the Type I inclusion (nominal shear wave speed of 1.6 m/s) were tested. Assuming isotropic, linear elastic, non-viscous, and incompressible material, the nominal shear wave speed (cs) of the phantom was converted from the nominal Young’s modulus (E) provided by CIRS using , where ρ is density and was assumed to be 1000 kg/m3 [9]. The Type IV inclusion is stiffer than the background (nominal shear wave speed of 2.9 m/s) and the Type I inclusion is softer than the background. Each inclusion has 4 different diameters: 16.7 mm, 10.4 mm, 6.5 mm, and 4.1 mm. The 9L-D transducer on the LE9 was compared with the L10-2 transducer on the Aixplorer. For each inclusion, 5 different data acquisitions were obtained for each transducer. The total number of data acquisitions for each transducer was 40 (2 types of inclusions, 4 different diameters, and 5 data acquisitions). As was done for the Homogeneous Phantom Study, no frame averaging was used on the LE9, and the available phantom mode with default settings was used on the Aixplorer. Figure 7 shows representative 2D shear wave speed maps from LE9 and Aixplorer when imaging the Type IV inclusions with different sizes. Regions-of-interest (ROIs) were selected for each inclusion image and the mean shear wave speed within each ROI was recorded. The bias and precision of shear wave speed measurement were calculated for both LE9 and Aixplorer. Bias was given by the difference between the mean of the 5 independent measurements and the nominal value, and then divided by the nominal value to obtain the percentage. Precision was given by the ratio of the standard deviation to the mean of the 5 independent measurements, also expressed in percentage.
Figure 7.
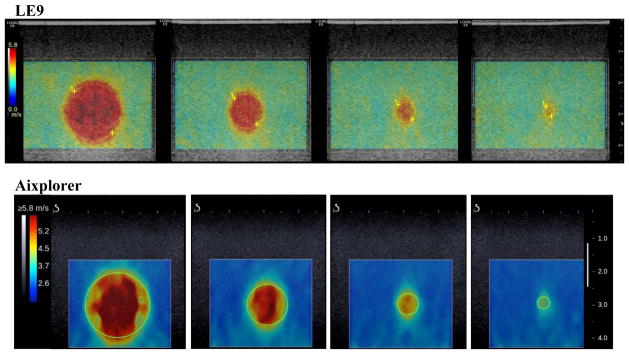
Top row: 2D shear wave speed maps of the Type IV inclusions from the 9L-D probe of LE9. All maps are under the same color scale. The yellow dashed circles indicate the ROIs selected for shear wave speed measurements. Bottom row: 2D shear wave speed maps of the Type IV inclusions from the L10-2 probe of the Aixplorer. All maps are under the same color scale. The green solid circles indicate the ROIs selected for shear wave speed measurements.
F. In Vivo Case Studies
To test the feasibility of using LE9 shear wave imaging for in vivo studies, two case studies were conducted on the breast (9L-D transducer) and liver (C1-6-D transducer). The experiment protocols were approved by the Institutional Review Board (IRB) and written informed consent was obtained prior to scanning. All imaging parameters were within the Food and Drug Administration (FDA) regulations and were safe for human scanning [25]. For the breast study, we recruited a female patient volunteer (age 52) with a suspicious breast mass. The patient was scanned in the supine position identical to that for the conventional ultrasound examination. The scan was performed by an experienced breast sonographer. Both the LE9 and the Aixplorer were used to image the breast mass and the remainder of the same breast. For the LE9, the PRFe was 5.2 kHz, number of zones was 6, push beam center frequency was 5 MHz, and push duration was 600 μs. For the liver study, a healthy male volunteer (age 27) without history of liver disease was recruited. The subject was placed in a supine position. Five data acquisitions from the same liver location (intercostal space between ribs 8 and 9) were each obtained by the LE9 and the Aixplorer with the curved transducers. For the LE9, the PRFe was 2.4 kHz, number of zones was 6, push beam center frequency was 2.2 MHz, and push duration was 600 μs.
RESULTS
A. Homogeneous Phantom Study
For each transducer on each system, the mean and standard deviation values of shear wave speed measurements were calculated from the 3 independent acquisitions at 3 different depths (total number of data acquisitions = 9). Figure 8 shows the results. Overall the LE9 measurements show good agreement with the Aixplorer measurements and the QIBA average results. Student’s t-tests showed no statistical difference (p > 0.05) between the LE9/9L-D and the Aixplorer/L10-2 transducers on the two systems for both phantom 1 and phantom 2. However t-tests showed that the LE9/C1-6-D measurements were statistically different (p < 0.01) from the Aixplorer/C6-1 measurements. This may be caused by the depth-dependent bias of the curved transducers [24, 26]. Table I shows the shear wave speed measurement difference to the QIBA average results for both systems on both transducers. One can see that both systems provide reasonably good agreement to the QIBA average results, especially for the linear transducers. There was a larger discrepancy for the curved transducers but the differences were all below 10%. These results indicate that the proposed TAST and CUSE techniques on the LE9 could accurately estimate shear wave speed from homogeneous phantoms with different stiffness.
Figure 8.
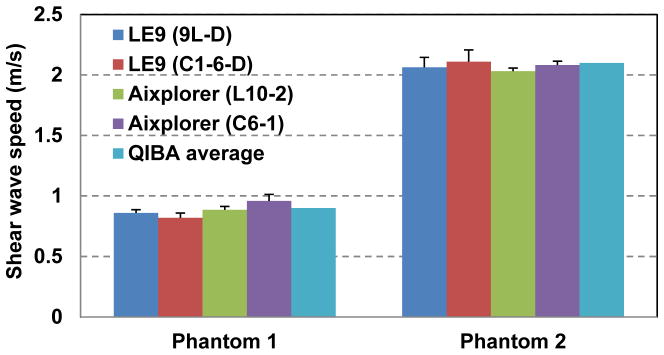
Bar plots of the mean shear wave speed measurements of the two CIRS phantoms from the LE9 and the Aixplorer. The error bars indicate the standard deviation values from multiple independent data acquisitions at different depths.
Table I.
Shear wave speed measurement difference to the QIBA average results
| Phantom 1 | Phantom 2 | |
|---|---|---|
| 9L-D (LE9) | 4.4% | 1.9% |
| C1-6-D (LE9) | 8.9% | 0.5% |
| L10-2 (Aixplorer) | 1.1% | 3.3% |
| C6-1 (Aixplorer) | 6.7% | 1.0% |
B. Inclusion Phantom Study
Table II summarizes the bias and precision measurements for the LE9 and the Aixplorer in measuring different sized inclusions with different stiffness. The positive bias indicates overestimation while the negative bias indicates underestimation. Overall, the LE9 achieved comparable performance to the Aixplorer. Both systems showed overestimate bias for the soft lesion and underestimate bias for the hard lesion when the lesion size gets smaller. One possible reason for the bias is that when the size of the inclusion is comparable to the size of the shear wavelength, the local homogeneity assumption for the shear wave equation calculation no longer holds, and the apparent stiffness of the inclusion will be biased toward the stiffness of the background material. Nevertheless, one can still well resolve the smallest inclusion as shown in Fig. 7. Both systems demonstrated very high precision in shear wave speed calculation for all the inclusions, which is important for clinical applications.
Table II.
Summary of bias and precision of the LE9 and the Aixplorer in imaging inclusions with different diameters and stiffness
| Inclusion diameter | 16.7 mm | 10.4 mm | 6.5 mm | 4.1 mm | |
|---|---|---|---|---|---|
| Type I | |||||
| LE9 | Bias | 14% | 14% | 21% | 38% |
| Precision | 2.5% | 2.5% | 2.8% | 3.2% | |
| Aixplorer | Bias | 13% | 17% | 22% | 36% |
| Precision | 1.6% | 1.8% | 2.2% | 1.1% | |
| Type IV | |||||
| LE9 | Bias | 1.2% | −6.9% | −17% | −28% |
| Precision | 1.0% | 1.1% | 0% | 1.5% | |
| Aixplorer | Bias | 4.8% | −1.6% | −11% | −24% |
| Precision | 0.65% | 0.96% | 2.3% | 1.8% | |
C. In vivo Case Studies
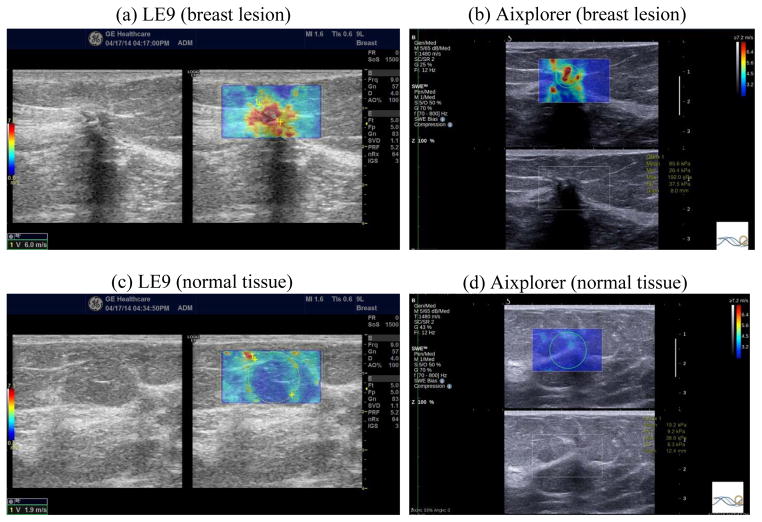
The breast study case was a 52 year old woman with a highly suspicious mass found in her clinical imaging studies. Her grayscale ultrasound demonstrates a 1.5 × 1.0 cm hypoechoic mass with posterior shadowing (Fig. 9 left of panel (a) and the bottom of panel (b)). Figure 9 also shows the 2D shear wave speed maps of the breast mass and normal area of the same breast acquired with the LE9 and the Aixplorer. Both systems showed contrast between the mass and background tissue. The shear wave speed of the mass measured from the LE9 was 6.0 m/s and from the Aixplorer was 5.3 m/s. The shear wave speed of the normal tissue measured from the LE9 was 1.9 m/s and from the Aixplorer was 2.5 m/s. The difference of normal tissue shear wave speed may be caused by not imaging the exact same location of the breast. Nevertheless, both normal tissue shear wave speed measurements are in good agreement with values reported in the literature [7, 27]. The shear wave speed map of the mass imaged by the LE9 appears more homogeneous than by the Aixplorer. The pathology result revealed the mass as invasive mammary carcinoma Nottingham grade III of III. This case demonstrates that both 2D shear wave images of the LE9 and the Aixplorer were able to identify a malignant breast mass with increased stiffness.
Figure 9.
2D shear wave speed maps of the breast lesion (panel (a) right and panel (b) top) and the normal breast tissue (panel (c) right and panel (d) top) obtained from the LE9 ((a) and (c)) and the Aixplorer ((b) and (d)). The corresponding B-mode images are also shown adjacent to the shear wave speed maps. The yellow dashed circle in (a) and (c) and the green solid circle in (b) and (d) indicate the ROIs selected for shear wave speed measurements.
Figure 10 shows representative 2D shear wave speed maps of an in vivo liver taken from a healthy volunteer by the LE9 and the Aixplorer. Both systems provided smooth maps without artifacts. The shear wave speed of the liver measured from the LE9 was 1.42 ± 0.02 m/s (mean ± standard deviation), and from the Aixplorer was 1.48 ± 0.05 m/s, both in good agreement to healthy liver elasticity values from both ultrasound and magnetic resonance elastography (MRE) reported in [3, 28, 29].
Figure 10.
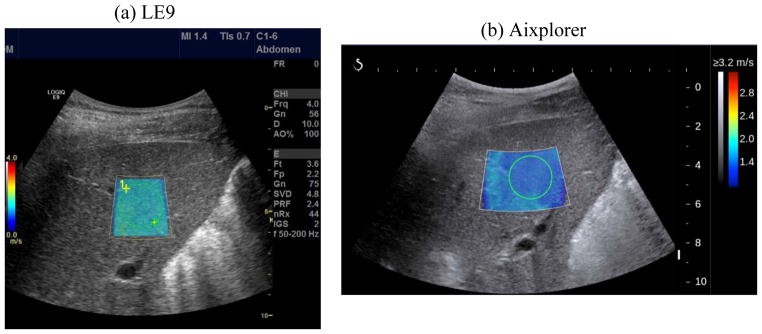
2D shear wave speed maps of the liver from a healthy subject obtained by LE9 (a) and Aixplorer (b). The green dashed circle in (a) and the green solid circle in (b) indicate the ROI selected for shear wave speed measurements.
The breast and the liver case studies demonstrated the feasibility of using LE9 to perform 2D shear wave elastography in vivo. The CUSE and TAST techniques enabled a conventional LE9 ultrasound scanner to obtain 2D shear wave images comparable to the Aixplorer, which has specialized software beamforming capability and very high shear wave detection PRF.
DISCUSSION
Implementation of 2D ultrasound shear wave elastography on clinical ultrasound scanners is challenged by the insufficient detection PRF of these systems, which makes it difficult to track the transient and fast propagating shear waves induced by acoustic radiation force. This paper presents a sequential tracking technique, TAST, which successfully addresses this challenge and enables 2D shear wave elastography on a conventional LE9 scanner when the comb-push (CUSE) technique is used to produce multiple shear waves simultaneously. The TAST technique was shown to be able to robustly track shear waves and correct for the sequential tracking delay. The homogeneous reference phantom study showed that both the linear and curved transducers provide accurate estimates of the phantom stiffness. The inclusion phantom study showed comparable performance between the LE9 and the Aixplorer for imaging different sized inclusions with different stiffness. The in vivo case studies showed that the LE9 could obtain good quality shear wave speed maps on both the linear and curved transducers, which were also comparable to the results from the Aixplorer.
For the homogeneous phantom study, shear wave speed measurements from all depths were averaged and analyzed for both systems. The depth-dependent bias described in [24] was not accounted for in this study. Nevertheless, the QIBA average values were obtained from the results acquired from all depths, and the imaging depths used in this study were the same as those used in the QIBA study, therefore it is still consistent to make the comparison in Table I.
For the inclusion phantom study, the LE9 showed high quality 2D maps of the inclusions with sharp boundaries and no artifacts in the background, despite the fact that no frame averaging was done as opposed to the Aixplorer. The 2D maps from the Aixplorer appear smoother in the background thanks to frame averaging, but more heterogeneous and streaky inside the lesion, which is supposed to be homogeneous. This may be due to the fact that CUSE introduces multiple shear waves inside the mass simultaneously, facilitating a more robust estimate of the mass stiffness, as demonstrated in [10]. Interestingly, for the in vivo case study of the breast, the mass also appears more homogeneous in the LE9 map than in the Aixplorer map. Nevertheless, both systems provide similar stiffness estimates of the mass, which was later diagnosed as invasive mammary carcinoma Nottingham grade III of III.
The Aixplorer uses software beamforming and plane wave imaging, and is capable of tracking shear waves with very high PRF. This allows the Aixplorer to acquire multiple 2D shear wave speed maps and realize frame averaging. For the conventional LE9 scanner, multiple push-detect cycles are needed to fulfill the PRF requirement, as indicated by Eq. (3). This prohibits the LE9 from doing frame averaging. Nevertheless, the LE9 achieved comparable performance to the Aixplorer throughout all the studies in this paper.
The proposed TAST technique takes advantage of the parallel receive beamforming capability of most high-end to mid-tier ultrasound systems to realize 2D shear wave tracking and 2D shear wave elastography. However for lower-end systems that do not support parallel receive beamforming, it is very challenging to realize 2D shear wave elastography with TAST. These systems may be able to realize 1D shear wave elastography (i.e. point measurement) by only tracking shear waves from a limited number of imaging lines.
In the validation study of TAST, the additional push transducer was used to separate the push from detection. In this way a fixed shear wave source was provided so that the detection ROI position and dimension could be easily adjusted without the need to adjust the push beam. For the rest of the studies, a single transducer was used for both push and detection. Use of a single transducer for the push and detection is not unique to the LOGIQ E9 as many other manufacturers like Siemens, Philips, and Supersonic Imagine have products that support shear wave elastography using a single transducer. The comb-push can be realized on conventional scanners that have sufficient power and thermal capacity to produce the high amplitude, long duration push pulse. The TAST technique can be realized on machines that have parallel receive beamforming capability.
In this study, the “interp” function of Matlab was used for the upsampling in TAST, which is a zero-insertion-based interpolation (or lowpass interpolation) approach. In this method, zeros are inserted into the original data sequence and then an FIR lowpass filter is applied to realize interpolation. This interpolation approach requires the original signal to be band-limited, which is the case for this study because the shear wave signal frequency (typically ranges from 50 to 400 Hz in soft tissues) was band-limited to less than half the sampling frequency (i.e. PRFe). Given these conditions, the interpolation should be robust with minimal error. In this study, the amount of interpolation was determined by the number of imaging vectors (N), because the purpose of interpolation was to fill the missed data points due to sequential tracking.
There are some limitations of this study. The shear wave imaging frame rate was not compared with the Aixplorer. The 2D shear wave imaging frame rate can be up to 1 Hz on the Aixplorer. The frame rate on the LE9 is typically below 0.5 Hz, depending on the size and depth of the shear wave imaging FOV as well as the desired effective PRF. This limitation, again, is due to the fact that sequential shear wave tracking has to be used for the LE9 and multiple imaging zones need to be used to fulfill the effective PRF requirement. More advanced imaging systems with higher parallel receive beamforming capability can significantly accelerate the imaging frame rate. Another limitation of the study is that we did not compare different interpolation algorithms for TAST and the potential error of interpolation was not quantified. Future studies will be conducted to systematically study different interpolation algorithms and compare the performance of these algorithms.
CONCLUSIONS
This study presents a method that realized 2D shear wave elastography on a conventional ultrasound scanner (GE LE9) using time aligned sequential tracking (TAST) and comb-push ultrasound shear elastography (CUSE). The LE9 was shown to be able to accurately measure the stiffness of homogeneous phantoms as compared to other shear wave imaging modalities; robustly image different sized inclusions with different stiffness; and provide good quality 2D maps of in vivo tissues. The overall performance of the LE9 was comparable to the Aixplorer, which is a state-of-the-art shear wave imaging system. These promising results illustrate the potential of translating 2D shear wave elastography to many of the extant conventional non-software-beamforming ultrasound scanners in clinics throughout the world to facilitate a wide spectrum of clinical applications of ultrasound shear wave elastography.
Acknowledgments
This work was supported by NIH grants R01EB002167, R01DK082408, R01CA148994, and R01DK092255. The authors thank Randall Kinnick for his experiment assistance.
Footnotes
DISCLOSURES
The content is solely the responsibility of the authors and does not necessarily represent the official views of NIH. Mayo and some of the authors have financial interest in the technology described here, which has been licensed.
References
- 1.Greenleaf JF, Fatemi M, Insana M. Selected methods for imaging elastic properties of biological tissues. Annual Review of Biomedical Engineering. 2003;5:57–78. doi: 10.1146/annurev.bioeng.5.040202.121623. [DOI] [PubMed] [Google Scholar]
- 2.Sarvazyan A, Hall TJ, Urban MW, Fatemi M, Aglyamov SR, Garra B. Elasticity imaging - an emerging branch of medical imaging. An overview. Current Medical Imaging Reviews. 2011;7(4):255–282. doi: 10.2174/157340511798038684. [DOI] [PMC free article] [PubMed] [Google Scholar]
- 3.Chen S, Sanchez W, Callstrom MR, Gorman B, Lewis JT, Sanderson SO, Greenleaf JF, Xie H, Shi Y, Pashley M, Shamdasani V, Lachman M, Metz S. Assessment of liver viscoelasticity by using shear waves induced by ultrasound radiation force. Radiology. 2013 Mar 1;266(3):964–970. doi: 10.1148/radiol.12120837. [DOI] [PMC free article] [PubMed] [Google Scholar]
- 4.Tanter M, Fink M. Ultrafast imaging in biomedical ultrasound. IEEE Transactions on Ultrasonics, Ferroelectrics and Frequency Control. 2014;61(1):102–119. doi: 10.1109/TUFFC.2014.6689779. [DOI] [PubMed] [Google Scholar]
- 5.Bamber J, Cosgrove D, Dietrich CF, Fromageau J, Bojunga J, Calliada F, Cantisani V, Correas JM, D’Onofrio M, Drakonaki EE, Fink M, Friedrich-Rust M, Gilja OH, Havre RF, Jenssen C, Klauser AS, Ohlinger R, Saftoiu A, Schaefer F, Sporea I, Piscaglia F. EFSUMB Guidelines and Recommendations on the Clinical Use of Ultrasound Elastography. Part 1: Basic Principles and Technology. Ultraschall in Med. 2013 Apr 04;34(02):169–184. doi: 10.1055/s-0033-1335205. [DOI] [PubMed] [Google Scholar]
- 6.Cosgrove D, Piscaglia F, Bamber J, Bojunga J, Correas JM, Gilja OH, Klauser AS, Sporea I, Calliada F, Cantisani V, D’Onofrio M, Drakonaki EE, Fink M, Friedrich-Rust M, Fromageau J, Havre RF, Jenssen C, Ohlinger R, Săftoiu A, Schaefer F, Dietrich CF. EFSUMB Guidelines and Recommendations on the Clinical Use of Ultrasound Elastography. Part 2: Clinical Applications. Ultraschall in Med. 2013 May 24;34(03):238–253. doi: 10.1055/s-0033-1335375. [DOI] [PubMed] [Google Scholar]
- 7.Tanter M, Bercoff J, Athanasiou A, Deffieux T, Gennisson JL, Montaldo G, Muller M, Tardivon A, Fink M. Quantitative assessment of breast lesion viscoelasticity: Initial clinical results using supersonic shear imaging. Ultrasound in Medicine and Biology. 2008 Sep;34(9):1373–1386. doi: 10.1016/j.ultrasmedbio.2008.02.002. [DOI] [PubMed] [Google Scholar]
- 8.Palmeri ML, Wang MH, Rouze NC, Abdelmalek MF, Guy CD, Moser B, Diehl AM, Nightingale KR. Noninvasive evaluation of hepatic fibrosis using acoustic radiation force-based shear stiffness in patients with nonalcoholic fatty liver disease. Journal of Hepatology. 2011;55(3):666–672. doi: 10.1016/j.jhep.2010.12.019. [DOI] [PMC free article] [PubMed] [Google Scholar]
- 9.Bercoff J, Tanter M, Fink M. Supersonic shear imaging: a new technique for soft tissue elasticity mapping. IEEE Transactions on Ultrasonics Ferroelectrics and Frequency Control. 2004 Apr;51(4):396–409. doi: 10.1109/tuffc.2004.1295425. [DOI] [PubMed] [Google Scholar]
- 10.Song P, Urban MW, Manduca A, Zhao H, Greenleaf JF, Chen S. Comb-Push Ultrasound Shear Elastography (CUSE) With Various Ultrasound Push Beams. IEEE Transactions on Medical Imaging. 2013;32(8):1435–1447. doi: 10.1109/TMI.2013.2257831. [DOI] [PMC free article] [PubMed] [Google Scholar]
- 11.Song P, Zhao H, Manduca A, Urban MW, Greenleaf JF, Chen S. Comb-push ultrasound shear elastography (CUSE): a novel method for two-dimensional shear elasticity imaging of soft tissues. IEEE Transactions on Medical Imaging. 2012;31(9):1821–1832. doi: 10.1109/TMI.2012.2205586. [DOI] [PMC free article] [PubMed] [Google Scholar]
- 12.Hazard C, Hah Z, Rubens D, Parker K. Integration of crawling waves in an ultrasound imaging system. Part 1: System and design considerations. Ultrasound in Medicine & Biology. 2012;38(2):296–311. doi: 10.1016/j.ultrasmedbio.2011.10.026. [DOI] [PMC free article] [PubMed] [Google Scholar]
- 13.Hah Z, Hazard C, Mills B, Barry C, Rubens D, Parker K. Integration of crawling waves in an ultrasound imaging system. Part 2: Signal processing and applications. Ultrasound in Medicine & Biology. 2012;38(2):312–323. doi: 10.1016/j.ultrasmedbio.2011.10.014. [DOI] [PMC free article] [PubMed] [Google Scholar]
- 14.Sandrin L, Tanter M, Gennisson JL, Catheline S, Fink M. Shear elasticity probe for soft tissues with 1-D transient elastography. IEEE Transactions on Ultrasonics Ferroelectrics and Frequency Control. 2002 Apr;49(4):436–46. doi: 10.1109/58.996561. [DOI] [PubMed] [Google Scholar]
- 15.Baghani A, Brant A, Salcudean S, Rohling R. A high-frame-rate ultrasound system for the study of tissue motions. IEEE transactions on ultrasonics, ferroelectrics, and frequency control. 2010 Jul;57(7):1535–47. doi: 10.1109/TUFFC.2010.1584. [DOI] [PubMed] [Google Scholar]
- 16.Wu Z, Taylor LS, Rubens DJ, Parker KJ. Sonoelastographic imaging of interference patterns for estimation of the shear velocity of homogeneous biomaterials. Physics in Medicine and Biology. 2004 Mar;49(6):911–922. doi: 10.1088/0031-9155/49/6/003. [DOI] [PubMed] [Google Scholar]
- 17.Daigle RE. US20090112095A1. 2009. Ultrasound imaging system with pixel oriented processing. [Google Scholar]
- 18.Li YF, Li PC. Software Beamforming: Comparison between a Phased Array and Synthetic Transmit Aperture. Ultrasonic Imaging. 2011 Apr;33(2):109–118. doi: 10.1177/016173461103300202. [DOI] [PubMed] [Google Scholar]
- 19.Shattuck DP, Weinshenker MD, Smith SW, von Ramm OT. Explososcan: a parallel processing technique for high speed ultrasound imaging with linear phased arrays. The Journal of the Acoustical Society of America. 1984 Apr;75(4):1273–82. doi: 10.1121/1.390734. [DOI] [PubMed] [Google Scholar]
- 20.Dahl JJ, Pinton GF, Palmeri ML, Agrawal V, Nightingale KR, Trahey GE. A parallel tracking method for acoustic radiation force impulse imaging. Ieee Transactions on Ultrasonics Ferroelectrics and Frequency Control. 2007 Feb;54(2):301–312. doi: 10.1109/tuffc.2007.244. [DOI] [PMC free article] [PubMed] [Google Scholar]
- 21.Kasai C, Namekawa K, Koyano A, Omoto R. Real-time two-dimensional blood flow imaging using an autocorrelation technique. IEEE Transactions on Sonics and Ultrasonics. 1985;SU-32(3):458–64. [Google Scholar]
- 22.Zhao H, Qiang B, Carrascal CA, Song P, Urban MW, Kinnick RR, Greenleaf JF, Chen S. Measure elasticity and viscosity using the out-of-plane shear wave. IEEE International Ultrasonics Symposium; Dresden, Germany. 2012. [Google Scholar]
- 23.Song P, Manduca A, Zhao H, Urban MW, Greenleaf JF, Chen S. Fast shear compounding using robust two-dimensional shear wave speed calculation and multi-directional filtering. Ultrasound in Medicine & Biology. 2014 doi: 10.1016/j.ultrasmedbio.2013.12.026. in press. [DOI] [PMC free article] [PubMed] [Google Scholar]
- 24.Hall TJ, Milkowski A, Garra B, Carson PL, Palmeri M, Nightingale K, Lynch T, Alturki A, Andre M, Audiere S, Bamber J, Barr RG, Bercoff J, Bercoff J, Bernal M, Brum J, Chan HW, Chen S, Cohen-Bacrie C, Couade M, Daniels AU, deWall RJ, dillman JR, Ehman RL, Franchi-Abella SF, Fromageau J, Gennisson JL, Henry JP, Ivancevich N, Kalin J, Kohn S, Kugel JL, Lee KS, Liu NL, Loupas T, Mazernik J, McAleavey S, Miette V, Metz S, Morel BM, Nelson T, Nordberg E, Oudry J, Padwal M, Rouze N, Samir A, Sandrin L, Schaccitti J, Schmitt C, Shamdasani V, Song P, Switalski P, Wang M, Wear K, Xie H, Zhao H. RSNA/QIBA: Shear wave speed as a biomarker for liver fibrosis staging. IEEE International Ultrasonics Symposium; Prague, Czech Republic. 2013. [Google Scholar]
- 25.Herman BA, Harris GR. Models and regulatory considerations for transient temperature rise during diagnostic ultrasound pulses. Ultrasound Med Biol. 2002;28(9):1217–24. doi: 10.1016/s0301-5629(02)00558-6. [DOI] [PubMed] [Google Scholar]
- 26.Zhao H, Song P, Urban MW, Kinnick RR, Yin M, Greenleaf JF, Chen S. Bias observed in time-of-flight shear wave speed measurements using radiation force of a focused ultrasound beam. Ultrasound in Medicine and Biology. 2011;37(11):1884–1892. doi: 10.1016/j.ultrasmedbio.2011.07.012. [DOI] [PMC free article] [PubMed] [Google Scholar]
- 27.Athanasiou A, Tardivon A, Tanter Ml, Sigal-Zafrani B, Bercoff J, Deffieux T, Gennisson J-L, Fink M, Neuenschwander S. Breast lesions: quantitative elastography with supersonic shear imaging: preliminary results. Radiology. 2010;256(1):297–303. doi: 10.1148/radiol.10090385. [DOI] [PubMed] [Google Scholar]
- 28.Ferraioli G, Tinelli C, Dal Bello B, Zicchetti M, Filice G, Filice C. Accuracy of real-time shear wave elastography for assessing liver fibrosis in chronic hepatitis C: a pilot study. Hepatology. 2012 Dec;56(6):2125–33. doi: 10.1002/hep.25936. [DOI] [PubMed] [Google Scholar]
- 29.Yin M, Woollard J, Wang XF, Torres VE, Harris PC, Ward CJ, Glaser KJ, Manduca A, Ehman RL. Quantitative assessment of hepatic fibrosis in an animal model with magnetic resonance elastography. Magnetic Resonance in Medicine. 2007 Aug;58(2):346–353. doi: 10.1002/mrm.21286. [DOI] [PubMed] [Google Scholar]


