

Abstract
The available literature supports the hypothesis that the morphology of the inner mitochondrial membrane is regulated by different energy states, that the three-dimensional morphology of cristae is dynamic and that both are related to biochemical function. Examination of the correlation between the inner mitochondrial membrane (IMM) structure and mitochondrial energetic function is critical to an understanding of the links between meso-scale morphology and function in progressive mitochondrial dysfunction such as aging, neurodegeneration, and disease. To investigate this relationship, we develop a model to examine the effects of three-dimensional IMM morphology on the electrochemical potential of mitochondria. The 2D axisymmetric finite element method is used to simulate mitochondrial electric potential and proton concentration distribution. This simulation model demonstrates that the proton motive force (PMF) produced on the membranes of cristae can be higher than that on the inner boundary membrane. The model also shows that high proton concentration in cristae can be induced by the morphology-dependent electric potential gradient along the outer side of the IMM. Furthermore, simulation results show that a high PMF is induced by the large surface-to-volume ratio of an individual crista, whereas a high capacity for ATP synthesis can primarily be achieved by increasing the surface area of an individual crista. The mathematical model presented here provides compelling support for the idea that morphology at the meso-scale is a significant driver of mitochondrial function.
I. INTRODUCTION
Mitochondria are double-membraned organelles enclosed by inner and outer membranes composed of phospholipid bilayers and proteins. The inner mitochondrial membrane (IMM) is of particular interest in that it is a major site of the electron transport chain and ATP synthase. The structure of the IMM has been extensively studied for the past decade. Advanced imaging techniques have permitted researchers to visualize the various components of mitochondrial structure. The IMM is composed of the inner boundary membrane (IBM) and the crista membrane (CM). Cristae are the involuted structures of the IMM that form tubules or lamellae. The CM and the IBM are connected via narrow tubular sites called crista junctions [1]. It is hypothesized that the role of crista morphology is to increase the surface area of the IMM to enable greater capacity for oxidative phosphorylation, whereas the morphologies of crista junctions have been studied and characterized as merely a molecular diffusion barrier [2–4]. Recent studies have shown that the IMM structures can differ widely among different cell types as well as physiological and pathological conditions. Therefore, investigating the mechanistic and functional effects of these pleomorphic IMM structures is a crucial step in understanding the progression of mitochondrial function and dysfunction.
Experimental studies have investigated the IMM structure in relation to the energy state and disease state of mitochondria. Using electron tomography, two different morphologies of the IMM have been observed in mitochondria at different energy states [5–7]. Mitochondria with high respiratory activity (state III; a mitochondrial respiration state during which the respiration rate increases in response to the addition of respiratory substrates) contain enlarged cristae, while those with low respiratory activity (state IV; a mitochondrial respiration state during which the respiration rate decreases and reaches steady state as all ADP is converted to ATP) have small cristae. In addition to these studies, more decisive and detrimental changes in the IMM structures were observed from mitochondria in neurodegenerative diseases. For example, swollen mitochondria and loss of cristae are seen in Parkinson’s diseases [8], and swollen mitochondria with degenerated cristae are observed in Huntington’s disease [9]. However, these studies provide only a qualitative description of the morphological changes. Morphometric analyses of the IMM structure, on the other hand, may provide more concrete criteria for differentiating the multiplicity of known disease states from normal function.
In an effort to explain the close relationship between the IMM structure and mitochondrial function, prior research has proposed that cristae morphologies can be regulated by the local pH gradient [10–12]. This hypothesis is based on the fact that the area per headgroup of cardiolipin-containing lipid membranes decreases as pH decreases. Consequently, the local pH difference across the membrane can induce the curvature by the area mismatch between two layers of the membrane. Through this mechanism, the cristae morphologies may be regulated in response to the change in local pH gradient. However, studies have not yet successfully investigated the reversed causal effect: how do changes in the IMM structure alter the energetic function of mitochondria? The answer to this question requires estimations of both the electric potential and the difference in proton concentration across the IMM (that are driving forces for ATP synthesis) in different IMM structures. To date, the mitochondrial membrane potential and proton concentration have been experimentally measured primarily by the use of potentiometric fluorescent dyes [13–20]. However, limitations such as diffusion and optical resolution of structures smaller than the wavelength of light prevent other than the measurement of bulk proton concentrations and electric potential and make impossible the direct measurement of local variations of these properties along irregular IMM surfaces. Mathematical simulations are, therefore, an excellent adjunct to the observations made by conventional fluorescence microscopy and aid in a better understanding of the effects of the IMM morphology on mechanistic function. For example, a thermodynamic model of the tubular cristae was developed to examine changes in free energy induced by different morphology and composition of the membrane [21]. Later, this model was modified to explain observed morphologies of cristae by considering tensile force and shape entropy [22]. The effect of cristae geometry on diffusion was investigated using Monte Carlo simulations with simplified geometries of tubular and lamellar cristae [23]. Molecular dynamics simulations were conducted in order to investigate the role of cardiolipin on the IMM structure [24, 25]. However, simulation studies have not sufficiently investigated the most important role of the IMM structure: the effect of the IMM structure on the electrochemical potential (or ATP synthesis) of mitochondria.
In this study, we introduce a model simulating the distributions of the electric potential and proton concentration in mitochondria to investigate the relationship between the IMM structure and the energetic function of mitochondria. The electric potential and proton transport are modeled based on the coupled Poisson-Nernst-Planck equations, which have been used for modeling the electrodiffusion of ions in membranes, double layer capacitors, and solvated biomolecular systems [26–28]. This equation is applied to the mitochondrion model with simplified geometry and solved using the finite element method. By using this model, we test the following hypotheses: i) the proton motive force on the CM is higher than that on the IBM, ii) the morphological parameters of a crista, such as the surface area and the surface-to-volume ratio, correlate with both the proton motive force and the capacity for ATP synthesis. Finally, the biophysical significance of the simulation results and the validity of model assumptions are discussed.
II. METHODS
A. Structure of the mitochondrion model
A 2D axisymmetric mitochondrion model mimicking the key features of the mitochondrial compartments is constructed (Fig. 1). This mitochondrion model comprises three concentric spheres with a single crista. The innermost sphere and the middle sphere represent the inner side and the outer side of the IMM, respectively. As can be seen in Fig. 1(c), the inner side is the N side (negatively charged by electrons) and the outer side is the P side (positively charged by membrane-bound protons). The outermost sphere is the outer mitochondrial membrane (OMM). The space between the P side and the OMM is the intermembrane space (IMS). One specific element of this structure is that the IMM is modeled as a domain (volume), while the OMM is modeled as a boundary (surface). The IMM is composed of the crista membrane (CM) and the inner boundary membrane (IBM). The CM is connected to the IBM through a crista junction. As can be seen in Fig. 1(b) and (c), the crista junction is modeled as a cylinder with diameter D (30 nm) and length L (40 nm). The edges connecting the crista junction with the CM and the IBM are rounded with an inside radius of 5 nm and an outside radius of 10 nm. The N side sphere has a diameter of 1 μm. The thicknesses of the IMM and the IMS are 5 nm and 25 nm, respectively.
FIG. 1.

Structure of a mitochondrion model. (a) Heterogeneous morphologies of mitochondria observed in DI TNC1 cells. (b) Compartments of a mitochondrion model. (c) Cross section view of a crista in the mitochondrion model. (d) Description of proton transport model and boundary conditions (cH is the proton concentration, ϕ is the electric potential, ρs is the surface charge density at the P side, ρf is the free charge density, and Jdif and Jmig are the diffusion flux and the migration flux, respectively). Note: The dimension in this figure is exaggerated in order to clearly illustrate of the structure.
To study the effects of overall shapes and detailed morphologies of cristae, we construct two types of crista geometries: type I (Fig. 2(a)) and type II (Fig. 2(b)). As can be seen in Fig. 2(a), type I crista geometries are constructed using three parameters (r1, r2, and z0). Parameters r1 and r2 represent the radii of the upper and lower spheres of the crista structure and z0 is the distance between the centers of these spheres. To parameterize the overall shape of a crista, we define the slope of the lateral surface of a crista as follows:
| (1) |
FIG. 2.
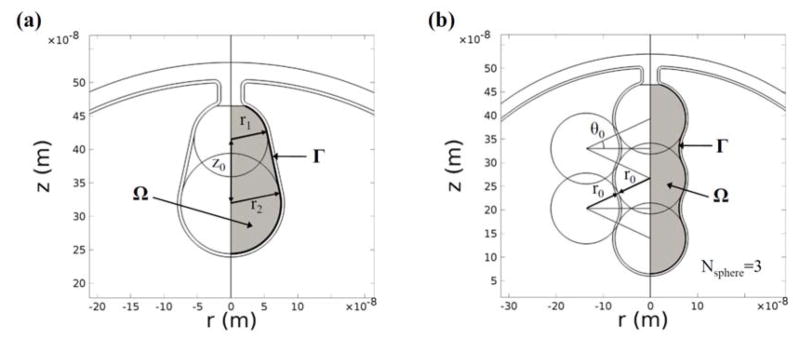
Two types of crista geometries (cross section view). (a) Type I geometries are used for studying the effect of the overall crista shape. (b) Type II geometries are used to investigate the effect of detailed crista morphology.
A positive value of k forms a narrow opening and a wide end of the crista structure, while a negative value of k forms a reversed shape. To investigate the effect of k on the electrochemical potential of a crista, we construct three geometry groups, each with different surface area and volume (Table I). For each group, we generate a reference geometry whose k=0 (r1=r2). Within each group, we vary k from −0.25 to 0.25 with increments of 0.05. To solve for r1, r2, and z0 at a given k, we first calculate the surface area and the volume of the reference geometry.
TABLE I.
Parameters for constructing type I geometries
| Group | k=(r2−r1)/z0 | Reference geometry (k=0) | Surface area (μm2) | Volume (10−4 μm3) | SVR (μm−1) |
|---|---|---|---|---|---|
| 1 | −0.25–0.25 | r1=r2=50, z0=30 | 0.0394 | 7.54 | 52.18 |
| 2 | −0.25–0.25 | r1=r2=50, z0=40 | 0.0425 | 8.33 | 51.03 |
| 3 | −0.25–0.25 | r1=r2=50, z0=50 | 0.0456 | 9.11 | 50.08 |
| (2) |
| (3) |
where Γ and Ω are the bold line and the shaded area in Fig. 2, respectively. From Eqs. 1, 2, and 3, we find solutions for r1, r2, and z0 at the given surface area, volume and k. Finally, we use these parameters to construct type I crista geometries.
To further investigate the detailed morphologies of crista structures, type II crista geometries are constructed. As can be seen in Fig. 2(b), a single crista is modeled as a combination of spheres. To construct cristae structures with various surface area and volume, we vary the number of spheres aligned in the centerline (Nsphere=1, 2, …, 6), the radius of the sphere (r0=30, 31, …, 65 nm), and the angle (θ0=10, 11, …, 25°) shown in Fig. 2(b). The surface area and the volume of a crista are calculated using Eqs. 2 and 3. These geometrical parameters are summarized in Table II. To avoid high correlation between the parameters (which can cause the problem of multicollinearity in regression models), we carefully select the ranges of parameters. This allows studying respective effects of the surface area and the surface-to-volume ratio of a crista.
TABLE II.
Parameters for constructing type II geometries
| Nsphere | Number constructed | r0 (nm) | θ0 (°) | Surface area (μm2) | Volume (10−4 μm3) | SVR (μm−1) |
|---|---|---|---|---|---|---|
| 1 | 3 | 63–65 | – | 0.048–0.052 | 10.42–11.45 | 45.0–46.4 |
| 2 | 32 | 47–56 | 10–25 | 0.048–0.052 | 8.86–11.02 | 46.7–54.5 |
| 3 | 27 | 39–50 | 10–25 | 0.048–0.052 | 7.64–10.48 | 49.2–62.7 |
| 4 | 24 | 35–45 | 10–25 | 0.048–0.052 | 7.12–9.56 | 52.6–68.4 |
| 5 | 24 | 31–42 | 10–25 | 0.048–0.052 | 6.43–9.33 | 54.9–76.1 |
| 6 | 20 | 30–39 | 10–23 | 0.048–0.052 | 6.40–8.72 | 58.0–77.0 |
B. Model descriptions and assumptions
To study the effect of the IMM morphology on the electrochemical potential of mitochondria, we model proton transport that is driven by diffusion and electric field-induced migration. The effects of other ions and proteins in mitochondria and their interactions are not considered. As can be seen in Fig. 1(d), a diffusion flux can be induced by pH difference in mitochondria, whereas an electric field can be generated by the surface charge of the IMM.
This model has 2 domains (IMM and IMS) and 3 boundaries (OMM, P side, and N side). The matrix domain is not considered because we assume that the electric potential and the proton concentration inside the matrix are uniform. Three variables including electric potential (ϕ), proton concentration in the IMS (cH), and the surface charge density at the P side (ρs) are considered in this model.
Classically, the Nernst-Planck equation has been used to describe the transport of ions under a concentration gradient and an electric potential gradient [26–28]. In this study, the modified Nernst-Planck (N-P) equation is used to simulate the steady state proton concentration in the IMS (cH).
| (4) |
where DHi is the intracellular proton diffusion coefficient, μ is the electrical mobility of the proton, and z is the valence of the proton (z=1). The Stokes-Einstein relation, which is the relationship between a diffusion coefficient and electrical mobility, is not applied in this equation because the interaction between solute and solvent may not be negligible in our model system. Instead, we use experimentally measured diffusion coefficients and electrical mobility.
All coefficients and parameters used in this model are summarized in Table III. Two boundary conditions at the P side and the OMM are required because the N-P equation was applied only in the IMS domain. At the P side, the net flux of protons is determined to be zero by assuming a balance between the number of protons pumped out by electron transport chain and those brought in through ATP synthase.
TABLE III.
Simulation coefficients and parameters
| Symbol | Description | Reference value | Value used | Reference |
|---|---|---|---|---|
| cH,matrix | Bulk concentration of proton in matrix | pH 8.0 | 1×10⁻⁵ mol/m3 | [19] |
| cH,cyto | Bulk concentration of proton in cytosol | pH 7.2 | 1×10−4.2 mol/m3 | [19] |
| DHi | Diffusion coefficient of intracellular proton | 4×10⁻⁷–15.2×10⁻⁷ cm2/s | 10×10−7 cm2/s | [50] |
| DHmb | Diffusion coefficient of membrane-bound proton | 2×10⁻⁷–5.8×10⁻⁵ cm2/s | 1×10⁻⁵ cm2/s | [34, 39–44] |
| μ | Electric mobility of proton in medium | 28.7×10⁻⁴–35.9×10⁻⁴ cm2/(V s) | 30×10−4 cm2/(V s) | [51] |
| εIMS | Relative permittivity of the IMS | 80 | 80 | [52] |
| εIMM | Relative permittivity of the IMM | – | 5.647a | – |
| ρ0 | Average surface charge density at the P side | – | 1.5×10⁻³ C/m2b | – |
| ρATPase | Density of ATP synthase | – | 2500 molecules/μm2c | – |
| JH | Proton flux | 3100 H+/s/ATPase | 4.966×10⁻¹⁶ C/s/ATPase | [45] |
| EATP | Energy used to synthesize 1 mole of ATP | 14 kcal/mol | 58576 J/mol | [34] |
| D | Diameter of a crista junction | 20–40 nm | 30 nm | [4, 5, 49] |
| L | Length of a crista junction | 30–200 nm | 40 nm | [4, 53] |
εIMM is calculated by assuming that the capacitance of the IMM is 1 μF/cm2 and the IMM thickness (tIMM) is 5 nm. εIMM = (tIMM/ε0)×(1 μF/cm2) = 5.647, where ε0 is the electric constant.
ρ0 is calculated using the parallel plate capacitor model with a ΔΨm of −150 mV.
ρ0 = ε0εIMM×(Δϕ/tIMM) = 1.5×10⁻³ C/m2, where Δϕ is 150 mV.
ρATPase is calculated from the average distance between ATP synthases [54].
ρATPase = 1/(20 nm×20 nm) = 2500 molecules/μm2.
At the OMM boundary, the Dirichelet boundary condition is applied. Because the OMM is permeable to protons, the protons at the OMM boundary can be buffered by the bulk cytosolic solution.
Boundary conditions:
| (5) |
where n is a normal vector pointing from the P side to the N side, and cH,cyto is bulk concentration of proton in cytosol.
We model the electric potential (ϕ) in the IMM and the IMS based on the following theoretical model. The mitochondrial membrane potential (ΔΨm) is induced by coupled electron transport and proton translocation. Protons are pumped out from the matrix by electron transport chain. Some of these protons bind to the P side instead of diffusing into the bulk solution of the IMS. These membrane-bound protons efficiently diffuse along the membrane surface (P side) from source (electron transport chain) to sink (ATP synthase), charging the P side positively. In the mean time, electrons flow from the electron transport chain, and then charge the N side negatively [29–34].
Accordingly, the electric potential (ϕ) in the IMM and the IMS can be described by Poisson’s equation.
| (6) |
where ρf is the free charge density per volume, and ε is the permittivity. The free charge density (ρf) in the IMM domain is assumed to be zero because the IMM is modeled as a capacitor. Zero free charge density is also applied in the IMS domain because we assume that the electroneutrality condition holds in the IMS (i.e., the net electrical charge is zero because charges from protons may be canceled out by other ions). Boundary conditions are applied at the N side, the P side and the OMM. Based on the above theoretical model, the N side may be assumed to be an equipotential surface, while the P side requires the surface charge density (ρs) profile to be used as a boundary condition. At the OMM, the zero charge boundary condition is used.
Boundary conditions:
| (7) |
where ε0 is the dielectric constant in vacuum, εIMM is the relative permittivity of the IMM, εIMS is the relative permittivity of the IMS, and E1 and E2 are electric fields of the IMM and IMS at the P side, respectively.
The surface charge density (ρs) used in the above boundary condition at the P side is not a constant. Because the surface charge density can be obtained from the density of membrane-bound protons (by multiplying the Faraday constant), ρs is also modeled using the modified Nernst-Planck equation.
| (8) |
where DHmb is the diffusion coefficient of membrane-bound protons. The electrical mobility of the membrane-bound proton is assumed to be the same as that of the proton in the IMS. To impose a constraint on ρs, we assumed that the average density of membrane-bound proton (or surface charge density) does not vary in each simulation.
| (9) |
where ρ0 is the average surface charge density at the P side. Because this constraint can provide an equivalent condition of proton transport across the IMM (or the activities and contributions of proton source and sink) at each simulation, it enables to exclusively investigate the effect of the IMM morphology without considering the effects of proton source and sink.
The 2D axisymmetric finite element method is implemented to solve these coupled equations with coupled boundary conditions. We use the ‘Transport of Diluted Species’, ‘Electrostatics’, and ‘Weak Form Boundary PDE’ modules in COMSOL Multiphysics 4.3 (Comsol, Stockholm, Sweden).
C. Post-processing
The electric potential (ϕ) and proton concentration (cH) distributions are simulated with various geometrical parameters of a crista. The mitochondrial membrane potential (ΔΨm) and the proton concentration difference across the IMM (ΔpH) are calculated from these two variables (ϕ and cH), as
| (10) |
| (11) |
From ΔpH, the chemical potential difference across the IMM (ΔμH) is calculated.
| (12) |
where R is the gas constant and T is temperature (310 K).
The proton motive force (PMF) is composed of the electric potential difference (ΔΨm) and chemical potential difference (ΔμH).
| (13) |
where F is the Faraday constant.
Given that the PMF is not uniform along the P side, the average PMF is defined in order to compare the effects of various parameters. The average PMF on the CM (PMFCM) is calculated by integrating the PMF over the P side of the CM divided by the area of that region.
| (14) |
The average PMF on the IBM (PMFIBM) is also defined similarly.
However, the average PMF might be an insufficient parameter for representing the total capacity for ATP synthesis because it does not consider the total area. To quantify this total capacity, we calculate the rate of ATP synthesis (RATP) of a crista as follows:
| (15) |
where JH is the proton flux, ρATPase is the density of ATP synthase, and EATP is the energy used to synthesize 1 mole of ATP.
For calculating and plotting the results, MATLAB R2009a (The MathWorks, Natick, MA) is used with COMSOL Multiphysics.
III. RESULTS
A. The effect of the crista on electrochemical potential
By using the mitochondrion model, we first test the hypothesis that the PMF is higher on the CM than on the IBM. Figure 3 shows an example of a mitochondrion model and its simulation results. As can be seen in Fig. 3(a), the electric potential in the crista is lower than that in the non-crista portion of the IMS. This electric potential difference can induce proton concentration gradient, i.e., protons are more concentrated in the crista because of the lower electric potential there (more details will be explained in the discussion section). As a result, the proton concentration in the crista is significantly greater than that of the non-crista portion (Fig. 3(b)). This high proton concentration inside the crista results in a higher absolute value of the chemical potential difference (ΔμH) across the CM compared to that across the IBM, and a consequently higher absolute value of the PMF on the CM. Accordingly, among two components of the PMF, the chemical potential predominantly contributes to the PMF difference between the CM and the IBM, whereas the membrane potential varies only slightly. In the model shown in Fig. 3, the average PMF on the CM (PMFCM) is −231.1 mV, while that on the IBM is −200.5 mV.
FIG. 3.
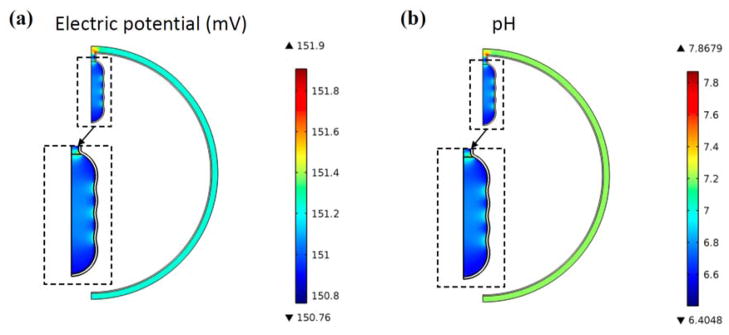
(Color online) An example of the mitochondrion model with a single crista (type II, Nsphere=4, r0=50 nm, θ0=15°). (a) Electric potential distribution in the IMS (mV). (b) Proton concentration distribution in the IMS (expressed as pH).
B. The effect of the overall shape of a crista
To investigate the effect of the overall shape of a crista structure on electrochemical potential, the type I crista geometries (see Fig. 2(a) and Table I) are constructed as described in the methods section. As can be seen in Fig. 4, k does not show significant effects on either the PMFCM or the RATP (ANOVA p-value≈1). Thus the overall shape of a crista may not be an important factor for the electrochemical potential of mitochondria. Instead, even though the difference of the PMFCM among groups 1, 2 and 3 is substantively small (~1.2 mV difference between groups 1 and 3), this difference is still statistically significant (p-value<0.05). Similarly, the difference of the RATP among groups is statistically significant. As summarized in Table I, groups 1, 2 and 3 have different surface areas and surface-to-volume ratios. Group 1, which has the highest surface-to-volume ratio and the smallest surface area, has the highest absolute value of the PMFCM and the lowest RATP. Conversely, group 3, which has the smallest surface-to-volume ratio and the largest surface area, has the lowest absolute value of the PMFCM and the highest RATP. Therefore, the PMFCM may depend on the surface-to-volume ratio, whereas the RATP may depend on the surface area. This hypothesis is further investigated by using the type II crista geometries.
FIG. 4.
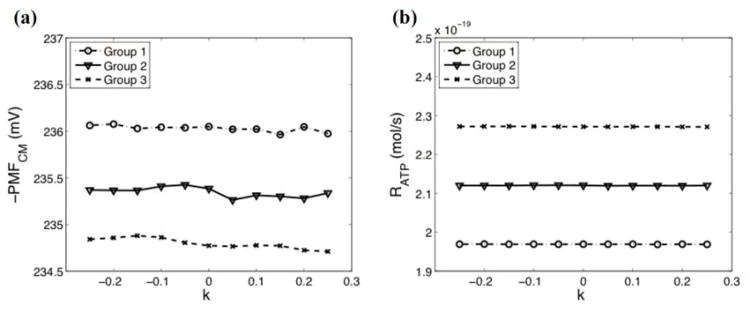
The effect of the overall crista shape (parameterized by k) on the average PMF on the CM (PMFCM) and the rate of ATP synthesis (RATP). (a) The effect of k on the PMFCM for groups 1–3. (b) The effect of k on the RATP for groups 1–3
C. The effect of the surface area and the surface-to-volume ratio of a crista
By using the type II crista geometry (see Fig. 2(b) and Table II), we examine the hypothesis that the surface area and the surface-to-volume ratio of a crista correlate with both the PMFCM and the RATP. Figure 5 shows the effects of the surface-to-volume ratio and the surface area on the PMFCM and the RATP. The lines in Fig. 5 are fitted models of the simulation results based on following equations:
| (16) |
| (17) |
where x1 is the surface-to-volume ratio and x2 is the surface area. Both models fit well with the simulation results (R2 for the -PMFCM and the RATP are 0.9818 and 0.9982, respectively). The absolute value of the PMFCM mainly depends on the surface-to-volume ratio (fits well to a power-law model), whereas the RATP almost linearly depends on the surface area. The effect of the surface area on the PMFCM is not statistically significant (p-value=0.063), while the effect of the surface-to-volume ratio on the RATP is statistically significant (p-value<0.05).
FIG. 5.
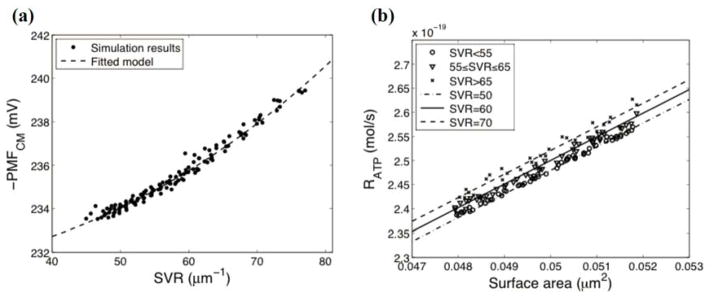
The effect of the detailed crista morphology on the average PMF on the CM (PMFCM) and the rate of ATP synthesis (RATP). (a) The effect of the surface-to-volume ratio (SVR) on the PMFCM. (b) The respective effects of the surface area and the SVR on the RATP. Markers show the simulation results. Dashed lines are fitted models of simulation results.
IV. DISCUSSION
A. Biophysical significance of the crista structure
The higher absolute value of the PMF on the CM predicted by this model may provide an explanation of experimentally observed non-uniform distribution of the proton source (electron transport chain) and sink (ATP synthase) along the IMM. It has been found that the electron transport chain and ATP synthase are more concentrated in the CM [35, 36]. From our simulation results, this inhomogeneous distribution may benefit the energy conversion process of mitochondria: by having more ATP synthase in the CM, mitochondria can synthesize ATP more efficiently due to the high absolute value of the PMF, which is the driving force for ATP synthesis.
Additionally, the simulation model shows that a high PMF can be induced by the large surface-to-volume ratio of a crista, while a high capacity for ATP synthesis may require the large surface area of a crista. These simulation results may present inferences for the relationship between the IMM morphology and the energy state of mitochondria. As mentioned earlier in the introduction section, two distinctive cristae structures have been observed from mitochondria of two different respiratory activities: small cristae at low respiratory activity (state 4) and large cristae at high respiratory activity (state 3) [5–7]. At low respiratory activity, a small crista may be favorable because a small surface area is sufficient for the low ATP synthesis rate. Moreover, a small crista may have a higher PMF than a large crista of similar shape because a small crista can have a greater surface-to-volume ratio. On the other hand, a large crista with a large surface area, which has greater capacity for ATP synthesis, may be required to meet high energy demand at high respiratory activity. This hypothesis is in agreement with experimental studies that estimated 30–60 mV higher PMF in state 4 (~230 mV) compared to that in state 3 (170–200 mV) [37, 38].
B. Membrane-bound proton diffusion coefficient
In our model, the membrane-bound proton diffusion coefficient (DHmb) is assumed to be 1×10⁻⁵ cm2/s. However, the measurements of the lateral proton diffusion coefficient along the membrane surface have exhibited two orders of magnitude in difference (2×10⁻⁷–5.8×10⁻⁵ cm2/s) [34, 39–44]. Because the DHmb can influence the profiles of membrane-bound proton concentration, surface charge density at the P side, and electric potential, we discuss the effects of the DHmb on the electrochemical potential of mitochondria.
As can be seen in Fig. 6(a), the absolute value of the average PMF on the CM increases linearly as the diffusion coefficient increases, while the average PMF on the IBM is almost independent of the diffusion coefficient. This increase in the -PMFCM is mainly contributed from the increase in the chemical potential difference (Fig. 6(b)). In our model, two transport mechanisms of membrane-bound proton are considered: ‘diffusion’ and ‘electric field-induced migration’. If the DHmb is small compared to the electric mobility (μ), then ‘electric field-induced migration’ will be the dominant mechanism of the membrane-bound proton transport. This will induce membrane-bound protons to move along the P side in order to minimize the electric potential gradient along the P side. Because of this approximately constant electric potential, the proton concentration in the IMS (cH) near the P side will become nearly uniform, resulting in a relatively small chemical potential gradient. In contrast, if the DHmb is sufficiently large compared to the electric mobility (μ), ‘diffusion’ will be the dominant mechanism of the membrane-bound proton transport. In this case, the membrane-bound proton concentration along the P side (which determines the surface charge density) will be closer to uniform. Due to the irregular geometry of the CM, this roughly uniform surface charge density profile will induce an electric potential gradient (lower electric potential on the P side of the CM than that on the P side of the IBM). At this point the protons in the IMS will be transported to the opposite direction of the electric potential gradient, resulting in a high proton concentration in the crista and consequently a high chemical potential gradient across the CM.
FIG. 6.
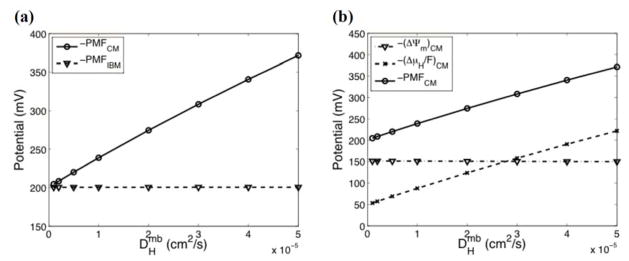
The effect of the membrane-bound proton diffusion coefficient (DHmb) on electrochemical potential (using a single sphere crista with radius=50 nm). (a) Change in the average PMF on the CM and the IBM. (b) Change in the average ΔΨm, the average ΔμH/F, and the average PMF on the CM.
As mentioned earlier, it has been proposed that high proton concentration inside a crista is induced by restricted diffusion. However, simulation results presented here suggest that the high proton concentration inside a crista can also be induced by the nonuniform electric potential along the P side resulting from the morphology-dependent membrane-bound proton distribution. To validate this model, the measurements of the local electric potential and the proton concentration around the IMM warrant further investigation.
C. Model assumptions and limitations
We apply continuum theories to model the electrochemical potential of mitochondria, even though few free protons can exist at the given pH values and sizes of the system. This treatment of pH values as a continuum is based on the chemiosmotic theory (i.e., the chemiosmotic theory assumes pH values in the chemical potential term of the proton motive force as a continuum). However, to the best of our knowledge, this issue has not been clearly justified in the existing literature. Our justification of this issue is as follows: Given the very small absolute number of free protons in a mitochondrion, the application of a continuum-based theory may seem inappropriate. However, the absolute number of free protons may not be an informative quantity regarding proton transport in ATP synthesis because of the complicated chemical buffering of mitochondria (i.e., protons in a mitochondrion exist as various forms of hydrated hydrogen ions). Moreover, it has been experimentally shown that the proton flux through ATP synthase and electron transport chain is very high (>1000 H+/s/molecule) [34, 45, 46]. To meet this high flux condition, protons should circulate very rapidly. Thus, the average distribution of protons over time can be treated as a continuum. Finally, a continuum-based approach is reasonable because we are not interested in the specific position of each proton at each instance of time, but the average distributions related to different geometries.
The next subject to be discussed is the modeling of mitochondrial structures. Mitochondrial structures are constructed from combinations of basic shapes including sphere and cylinder. The application of basic shapes in the crista structure may limit the available range of the surface-to-volume ratio of a crista. As the PMFCM is a function of the surface-to-volume ratio, the range of the PMFCM simulated in this study (~234–240 mV) is limited and may not be enough to show a biologically meaningful difference. Furthermore, given the heterogeneous compositions of the IMM, the thickness of the IMM is not uniform, which can cause changes in the local electrical capacity and the electric potential. However, it is difficult to implement a complex 3D mitochondrion structure that requires extremely fine elements and currently expensive computations. Capturing complex geometries and localized properties of the IMM would require a stochastic model, with a large number of realizations for a variety of conditions. Variations among realizations of the same complex set of geometric descriptors would be likely to obfuscate larger trends, such as the effects of the surface area and the surface-to-volume ratio of an individual crista. This complex model geometry can also introduce computational inaccuracies and instabilities. In this sense, simplified model geometries may be more suitable for identifying the effects of key morphological parameters.
Another set of assumptions in this model is proton concentration distributions outside the mitochondrion, inside the matrix, and in the IMS. Proton concentration outside the OMM is not modeled due to our assumption of constant cytosolic pH; however, cytosolic pH can also be affected by mitochondrial matrix alkalinization [47]. In addition, uniform pH in the matrix can be challenged by complex compositions of the matrix. A prerequisite for the assumption of uniform pH in the matrix is uniform electric potential in the matrix. The N side, which encloses the matrix, is assumed to be an equipotential surface (because it is charged by electrons). This equipotential surface does not induce an electric potential difference within the matrix, even though the electric potential along the P side and the resulting membrane potential are not uniform. Thus, the assumption of uniform pH in the matrix is consistent with the assumption of the equipotential surface on the N side. However, little is known of electric potential and proton concentration distributions in the matrix. The matrix contains a high density of enzymes and other proteins [48]. This high density of macromolecules may require specific configurations that may induce non-uniform electric potential. In the IMS, we model proton concentration profile by assuming that the interaction between protons and other ions are negligible and that the net electric charge of ions in the IMS is neutral. These assumptions, however, have not been sufficiently investigated.
Furthermore, we assume that the narrow crista junction morphology does not alter the diffusion coefficient. With this constant diffusion coefficient in the entire region of the IMS (including the crista and the crista junction), the simulation results show that both the crista junction diameter (ranges from 20 nm to 40 nm) and length (ranges from 30 nm to 50 nm) do not notably affect either the PMFCM or the RATP (data not shown). However, the narrow opening of the crista junction has been hypothesized to restrict the diffusion of molecules between the crista and the non-crista portion of the IMS [1–4, 49]. In addition, a recent simulation study suggests that the anomalous diffusion of proteins can be induced by cristae geometries [23]. Even though this geometrical effect on the diffusion coefficient might not be applicable to protons (given the relatively small size and low concentration of protons with respect to the typical size of the crista junction), the crista junction morphology may affect mitochondrial functions by regulating the transport of metabolic substrates and proteins, which have greater molecular weights and volumes [1, 4].
Finally, inhomogeneous composition of the IMM is not considered. In particular, proteins, including ATP synthase and electron transport chain, are not evenly distributed in the IMM [35, 36]. These non-uniform distributions of proton source and sink may influence the membrane potential. Moreover, the activities of these protein complexes, regulated by the energy state of mitochondria, can also change the membrane potential. In our model, however, the average surface charge density is assumed to be constant in each simulation in order to exclusively investigate the morphological effects.
V. CONCLUSIONS
To date, research on the role of highly varied IMM structure has been primarily based on empirical observations that are not supported by theoretical verifications. Recently, some simulation studies have been conducted to explain the observed IMM structures using thermodynamic models [21, 22] and to examine the validity of a crista junction morphology as a diffusion barrier [23]. However, a model simulating the effect of the IMM structure on ATP synthesis has not yet been developed. This study aims to explain the biophysical significance of IMM structures on the energetic function of mitochondria using finite element methods. We construct a simplified mitochondrion model that enables easy parameterization of the IMM structure. From this model, we show that a crista can enhance ATP synthesis not only by increasing the surface area, but also by increasing the PMF. Based on results from the current simulation, high PMF on the CM is induced by its concave geometry, but is not necessarily related to the restricted diffusion that may be caused by a narrow crista junction opening. It is shown in the model that the morphology-dependent electric potential induces a proton concentration difference between a crista and the non-crista portion of the IMS (i.e., a crista can act as a proton trap not by restricted diffusion, but by induced electric field).
Our simulation results also present potential explanations on the relationship between cristae morphologies and energy states. The simulation model suggests that a high PMF can be induced by the large surface-to-volume ratio of a crista, whereas a high capacity for ATP synthesis can be mainly achieved by increasing the surface area of a crista. Based on these simulation results, the orthodox conformation (small cristae) might be more favorable for mitochondria of low respiratory activity, whereas the condensed conformation (large cristae) can be more preferable for mitochondria of high respiratory activity.
Even though our model successfully details the biophysical significance of IMM structures, the current model might not sufficiently describe some important biological aspects because of potential over-simplifications and assumptions specific to these calculations. Further investigation is required into the local electric potential and the distribution of protons, as well as the proton transport mechanisms in mitochondria in order to improve the validity of computational estimates of causal relationships between morphology and biochemical function.
Acknowledgments
This work was supported by National Institutes of Health grants 1R01 ES008846 and the National Institutes of Environmental Health Sciences Environmental Toxicology and Epidemiology Training grant T32 ES007062.
References
- 1.Mannella CA, Pfeiffer DR, Bradshaw PC, Moraru II, Slepchenko B, Loew LM, Hsieh CE, Buttle K, Marko M. IUBMB Life. 2001;52:93. doi: 10.1080/15216540152845885. [DOI] [PubMed] [Google Scholar]
- 2.Perkins GA, Renken CW, Frey TG, Ellisman MH. J Neurosci Res. 2001;66:857. doi: 10.1002/jnr.10050. [DOI] [PubMed] [Google Scholar]
- 3.Frey TG, Renken CW, Perkins GA. Biochim et Biophys Acta. 2002;1555:196. doi: 10.1016/s0005-2728(02)00278-5. [DOI] [PubMed] [Google Scholar]
- 4.Mannella CA. Biochim Biophys Acta. 2006;1762:140. doi: 10.1016/j.bbadis.2005.07.001. [DOI] [PubMed] [Google Scholar]
- 5.Mannella CA. Biochimica et Biophysica Acta (BBA) - Molecular Cell Research. 2006;1763:542. doi: 10.1016/j.bbamcr.2006.04.006. [DOI] [PubMed] [Google Scholar]
- 6.Mannella CA. Ann NY Acad Sci. 2008;1147:171. doi: 10.1196/annals.1427.020. [DOI] [PMC free article] [PubMed] [Google Scholar]
- 7.Perkins GA, Ellisman MH. J Struct Biol. 2011;173:117. doi: 10.1016/j.jsb.2010.06.017. [DOI] [PMC free article] [PubMed] [Google Scholar]
- 8.Sharma SK. J Neurocytol. 2003;32:329. doi: 10.1023/B:NEUR.0000011327.23739.1b. [DOI] [PubMed] [Google Scholar]
- 9.Yu ZX. J Neurosci. 2003;23:2193. doi: 10.1523/JNEUROSCI.23-06-02193.2003. [DOI] [PMC free article] [PubMed] [Google Scholar]
- 10.Fournier JB, Khalifat N, Puff N, Angelova MI. Physical Review Letters. 2009;102:018102. doi: 10.1103/PhysRevLett.102.018102. [DOI] [PubMed] [Google Scholar]
- 11.Khalifat N, Fournier JB, Angelova MI, Puff N. Biochimica et Biophysica Acta (BBA) - Biomembranes. 2011;1808:2724. doi: 10.1016/j.bbamem.2011.07.013. [DOI] [PubMed] [Google Scholar]
- 12.Khalifat N, Puff N, Bonneau S, Fournier JB, Angelova MI. Biophys J. 2008;95:4924. doi: 10.1529/biophysj.108.136077. [DOI] [PMC free article] [PubMed] [Google Scholar]
- 13.Loew LM, Tuft RA, Carrington W, Fay FS. Biophys J. 1993;65:2396. doi: 10.1016/S0006-3495(93)81318-3. [DOI] [PMC free article] [PubMed] [Google Scholar]
- 14.Fink C, Morgan F, Loew LM. Biophys J. 1998;75:1648. doi: 10.1016/S0006-3495(98)77607-6. [DOI] [PMC free article] [PubMed] [Google Scholar]
- 15.Lemasters JJ, Trollinger DR, Qian T, Cascio WE, Ohata H. Methods Enzymol. 1999;302:341. doi: 10.1016/s0076-6879(99)02031-5. [DOI] [PubMed] [Google Scholar]
- 16.Koopman WJH, Distelmaier F, Esseling JJ, Smeitink JAM, Willems PHGM. Methods. 2008;46:304. doi: 10.1016/j.ymeth.2008.09.018. [DOI] [PubMed] [Google Scholar]
- 17.Llopis J, McCaffery JM, Miyawaki A, Farquhar MG, Tsien RY. Proc Natl Acad Sci USA. 1998;95:6803. doi: 10.1073/pnas.95.12.6803. [DOI] [PMC free article] [PubMed] [Google Scholar]
- 18.Porcelli AM, Ghelli A, Zanna C, Pinton P, Rizzuto R, Rugolo M. Biochem Biophys Res Commun. 2005;326:799. doi: 10.1016/j.bbrc.2004.11.105. [DOI] [PubMed] [Google Scholar]
- 19.Bolshakov AP, Mikhailova MM, Szabadkai G, Pinelis VG, Brustovetsky N, Rizzuto R, Khodorov BI. Cell Calcium. 2008;43:602. doi: 10.1016/j.ceca.2007.10.005. [DOI] [PubMed] [Google Scholar]
- 20.Poburko D, Santo-Domingo J, Demaurex N. J Biol Chem. 2011;286:11672. doi: 10.1074/jbc.M110.159962. [DOI] [PMC free article] [PubMed] [Google Scholar]
- 21.Ponnuswamy A, Nulton J, Mahaffy JM, Salamon P, Frey TG, Baljon ARC. Phys Biol. 2005;2:73. doi: 10.1088/1478-3967/2/1/009. [DOI] [PubMed] [Google Scholar]
- 22.Ghochani M, Nulton JD, Salamon P, Frey TG, Rabinovitch A, Baljon ARC. Biophys J. 2010;99:3244. doi: 10.1016/j.bpj.2010.09.038. [DOI] [PMC free article] [PubMed] [Google Scholar]
- 23.Sukhorukov VM, Bereiter-Hahn J. PLoS One. 2009;4:e4604. doi: 10.1371/journal.pone.0004604. [DOI] [PMC free article] [PubMed] [Google Scholar]
- 24.Dahlberg M, Maliniak A. J Phys Chem B. 2008;112:11655. doi: 10.1021/jp803414g. [DOI] [PubMed] [Google Scholar]
- 25.Aguayo D, González-Nilo FD, Chipot C. Journal of Chemical Theory and Computation. 2012;8:1765. doi: 10.1021/ct200849k. [DOI] [PubMed] [Google Scholar]
- 26.Sokalski T, Lingenfelter P, Lewenstam A. J Phys Chem B. 2003;107:2443. [Google Scholar]
- 27.Lim J, Whitcomb JD, Boyd JG, Varghese J. Comput Mech. 2009;43:461. [Google Scholar]
- 28.Lu B, Holst MJ, Andrew McCammon J, Zhou YC. J Comput Phys. 2010;229:6979. doi: 10.1016/j.jcp.2010.05.035. [DOI] [PMC free article] [PubMed] [Google Scholar]
- 29.Mitchell P. Biol Rev Cambridge Philos Soc. 1966;41:445. doi: 10.1111/j.1469-185x.1966.tb01501.x. [DOI] [PubMed] [Google Scholar]
- 30.Prats M, Tocanne JF, Teissie J. Eur J Biochem. 1985;149:663. doi: 10.1111/j.1432-1033.1985.tb08975.x. [DOI] [PubMed] [Google Scholar]
- 31.Heberle J, Riesle J, Thiedemann G, Oesterhelt D, Dencher NA. Nature. 1994;370:379. doi: 10.1038/370379a0. [DOI] [PubMed] [Google Scholar]
- 32.Antonenko YN, Pohl P. FEBS Lett. 1998;429:197. doi: 10.1016/s0014-5793(98)00590-0. [DOI] [PubMed] [Google Scholar]
- 33.Yaguzhinsky LS, Yurkov VI, Krasinskaya IP. Biochim et Biophys Acta. 2006;1757:408. doi: 10.1016/j.bbabio.2006.04.001. [DOI] [PubMed] [Google Scholar]
- 34.Kocherginsky N. Prog Biophys Mol Biol. 2009;99:20. doi: 10.1016/j.pbiomolbio.2008.10.013. [DOI] [PubMed] [Google Scholar]
- 35.Gilkerson RW, Selker JML, Capaldi RA. FEBS Lett. 2003;546:355. doi: 10.1016/s0014-5793(03)00633-1. [DOI] [PubMed] [Google Scholar]
- 36.Vogel F, Bornhövd C, Neupert W, Reichert AS. J Cell Biol. 2006;175:237. doi: 10.1083/jcb.200605138. [DOI] [PMC free article] [PubMed] [Google Scholar]
- 37.Mitchell P, Moyle J. Eur J Biochem. 1969;7:471. doi: 10.1111/j.1432-1033.1969.tb19633.x. [DOI] [PubMed] [Google Scholar]
- 38.Nicholls DG. Eur J Biochem. 1974;50:305. doi: 10.1111/j.1432-1033.1974.tb03899.x. [DOI] [PubMed] [Google Scholar]
- 39.Alexiev U, Mollaaghababa R, Scherrer P, Khorana HG, Heyn MP. Proc Natl Acad Sci USA. 1995;92:372. doi: 10.1073/pnas.92.2.372. [DOI] [PMC free article] [PubMed] [Google Scholar]
- 40.Slevin CJ, Unwin PR. J Am Chem Soc. 2000;122:2597. [Google Scholar]
- 41.Zhang J, Unwin PR. J Am Chem Soc. 2002;124:2379. doi: 10.1021/ja012074w. [DOI] [PubMed] [Google Scholar]
- 42.Serowy S, Saparov SM, Antonenko YN, Kozlovsky W, Hagen V, Pohl P. Biophys J. 2003;84:1031. doi: 10.1016/S0006-3495(03)74919-4. [DOI] [PMC free article] [PubMed] [Google Scholar]
- 43.Brändén M, Sandén T, Brzezinski P, Widengren J. Proc Natl Acad Sci USA. 2006;103:19766. doi: 10.1073/pnas.0605909103. [DOI] [PMC free article] [PubMed] [Google Scholar]
- 44.Antonenko Y, Pohl P. Eur Biophys J. 2008;37:865. doi: 10.1007/s00249-008-0295-y. [DOI] [PubMed] [Google Scholar]
- 45.Franklin MJ, Brusilow WSA, Woodbury DJ. Biophys J. 2004;87:3594. doi: 10.1529/biophysj.104.044248. [DOI] [PMC free article] [PubMed] [Google Scholar]
- 46.Wiedenmann A, Dimroth P, von Ballmoos C. Biochim et Biophys Acta. 2008;1777:1301. doi: 10.1016/j.bbabio.2008.06.008. [DOI] [PubMed] [Google Scholar]
- 47.Matsuyama S, Llopis J, Deveraux QL, Tsien RY, Reed JC. Nat Cell Biol. 2000;2:318. doi: 10.1038/35014006. [DOI] [PubMed] [Google Scholar]
- 48.Scalettar BA, Abney JR, Hackenbrock CR. Proc Natl Acad Sci USA. 1991;88:8057. doi: 10.1073/pnas.88.18.8057. [DOI] [PMC free article] [PubMed] [Google Scholar]
- 49.Perkins G, Renken C, Martone ME, Young SJ, Ellisman M, Frey T. J Struct Biol. 1997;119:260. doi: 10.1006/jsbi.1997.3885. [DOI] [PubMed] [Google Scholar]
- 50.Swietach P, Zaniboni M, Stewart AK, Rossini A, Spitzer KW, Vaughan-Jones RD. Prog Biophys Mol Biol. 2003;83:69. doi: 10.1016/s0079-6107(03)00027-0. [DOI] [PubMed] [Google Scholar]
- 51.Duso AB, Chen DDY. Anal Chem. 2002;74:2938. doi: 10.1021/ac0112420. [DOI] [PubMed] [Google Scholar]
- 52.Ron A, Fishelson N, Croitoru N, Shur I, Benayahu D, Shacham-Diamand Y. J Electroanal Chem. 2010;638:59. [Google Scholar]
- 53.Nicastro D, Frangakis AS, Typke D, Baumeister W. J Struct Biol. 2000;129:48. doi: 10.1006/jsbi.1999.4204. [DOI] [PubMed] [Google Scholar]
- 54.Acehan D, Malhotra A, Xu Y, Ren M, Stokes DL, Schlame M. Biophys J. 2011;100:2184. doi: 10.1016/j.bpj.2011.03.031. [DOI] [PMC free article] [PubMed] [Google Scholar]