Abstract
Analysis of 5-hydroxymethylcytosine (5hmC) at single-base resolution has been largely limited to studies of stem cells or developmental stages. Given the potential importance of epigenetic events in hypertension, we have analyzed 5hmC and 5-methylcytosine (5mC) at single-base resolution in the renal outer medulla of the Dahl salt-sensitive SS rat and examined the effect of disease-relevant genetic or environmental alterations on 5hmC and 5mC patterns. Of CpG sites that fell within CpG islands, 11% and 1%contained significant 5mC and 5hmC, respectively. 5mC levels were substantially higher for genes with lower mRNA abundance and showed a prominent nadir around the transcription start site. In contrast, 5hmC levels were higher in genes with higher expression. Substitution of a 12.9 Mbp region of chromosome 13, which attenuates the hypertensive and renal injury phenotypes in SS rats, or exposure to a high-salt diet, which accelerates the disease phenotypes, was associated with differential 5mC or 5hmC in several hundred CpG islands. Nearly 80% of the CpG islands that were differentially methylated in response to salt and associated with differential mRNA abundance were intragenic CpG islands. The substituted genomic segment had significant cis effects on mRNA abundance but not DNA methylation. The study established base-resolution maps of 5mC and 5hmC in an in vivo model of disease and revealed several characteristics of 5mC and 5hmC important for understanding the role of epigenetic modifications in the regulation of organ systems function and complex diseases.
Keywords: epigenetics, genomics, DNA methylation, hypertension, kidney, next-generation sequencing
Introduction
Essential hypertension affects 30% of the adult population in the US. Blood pressure salt-sensitivity is increased in 50% of Caucasians and 75% of African Americans with essential hypertension.1 The Dahl salt-sensitive SS rat is a widely used model of human salt-sensitive hypertension and associated organ injuries including cardiac, vascular, and renal injury. The genetic basis of salt-sensitive hypertension in humans and in the SS rat has been a subject of intensive investigation.2,3,4
Epigenetic modifications of the genome play a key role in the regulation of gene expression. It has been reported that epigenetic modifications of several genes are associated with hypertension.5 However, it is likely that most of the epigenetic modifications that contribute to hypertension remain to be identified.6 Analysis of epigenetic modifications at a genome scale is particularly lacking in hypertension research.5
5-methylcytosine (5mC) in CpG dinucleotide is an important epigenetic modification. Base-resolution, genome-scale maps of 5mC can be obtained using techniques such as reduced representation bisulfite sequencing (RRBS),7 which enriches for CpG islands, or whole genome methylation sequencing. 5-hydroxymethylcytosine (5hmC) is emerging as another type of important DNA modification. 5hmC is an intermediate step in the process of demethylation and could itself contribute to epigenetic regulation.8
Booth, et al, recently developed an oxidative RRBS (oxRRBS) method for genomic mapping of 5hmC at single-base solution.9 The method utilizes specific oxidation of 5hmC to 5-formylcytosine (5fC) by treating DNA with potassium perruthenate. 5fC and unmodified cytosine are converted to uracil under bisulfite conditions, while 5mC and 5hmC are not converted. Base-resolution maps of 5mC and 5hmC can, therefore, be obtained by combining RRBS and oxRRBS. Other elegant methods for mapping 5hmC at base resolution have also been reported.10 Base-resolution mapping of 5hmC, however, has been used primarily to analyze stem cells and tissues at various developmental stages. Base-resolution mapping of 5mC has been applied to study disease, but has not been applied in studies of hypertension.
We report here one of the first base-resolution maps of 5hmC in an in vivo disease model and the first base-resolution maps of 5mC and 5hmC in hypertension. We characterized the 5mC and 5hmC patterns in SS rats and examined the effect of increased dietary salt intake. Moreover, we compared the SS rat to the congenic SS.13BN26 rat to investigate the effect of genomic segment substitution on 5mC and 5hmC and the association of 5mC and 5hmC with changes in the disease phenotypes. The SS.13BN26 rat has a 12.9 Mbp segment of chr 13 introgressed from the Brown Norway rat genome into the SS genome and exhibits substantial attenuation of salt-induced hypertension and renal injury .11,12
We focused the analysis on the renal outer medulla. The kidney plays a central role in long-term control of arterial blood pressure and development of hypertension.13,14,15 The renal outer medulla primarily consists of epithelial cells involved in vectorial transport of solutes and fluids, a critical process in the regulation of blood pressure. The tissue region has been demonstrated to play an especially important role in the development of hypertension and renal injury.12,16,17
The base-resolution maps of 5hmC and 5mC were integrated with transcriptome profiles obtained by RNA-seq. The results provided a series of new insights into epigenomics in the context of a key in vivo disease model.
Methods
Detailed methods are available online.
Animal treatment and DNA and RNA extraction
The animal protocols were approved by the Institutional Animal Care and Use Committee at the Medical College of Wisconsin. SS rats and congenic SS.13BN26 rats were maintained as described previously.11,12 Male rats at 6-7 weeks of age were used for tissue collection. Rats had been fed an AIN-76A diet containing 0.4% NaCl since weaning. A group of rats of each strain was switched to a 4% NaCl diet for 7 days prior to tissue collection. Each group included 9 individual rats. Genomic DNA and total RNA were extracted and quality assessed as described.18,19,20 An equal amount of DNA or RNA was taken from each rat to make 3 pools of samples for each experimental group, each pool representing 3 individual rats.
Multiplexed RRBS
Libraries for reduced representation bisulfite sequencing (RRBS) were prepared and sequenced largely following the protocols described by Gu, et al., and Illumina with modifications to allow multiplexing.21 The libraries underwent cluster generation using TruSeq PE Cluster Kit v3-cBot-HS and 100 cycles of paired-end sequencing using TruSeq SBS Kit v3-HS (Illumina) and an Illumina HiSeq 2000 sequencer, as we recently described.20
Multiplexed oxidative RRBS (oxRRBS)
The protocol was similar to RRBS except an oxidation treatment step was introduced after adapter ligation and before bisulfite conversion as described previously.9 5hmC was oxidized by potassium perruthenate to 5-formylcytosine. The latter was converted to uracil by the bisulfite treatment.
RNA-seq
mRNA (cDNA) libraries were prepared from 5 μg of total RNA using TruSeq RNA Sample Preparation Kit from Illumina, following the vendor's instructions. Cluster generation and sequencing were similar to that described under RRBS.
Real-time PCR
Real-time PCR was used to quantify mRNA abundance as described.22,23,24
Analysis of methylation sequencing data
Methylation sequence reads obtained from Illumina HiSeq 2000 were analyzed by MethylCoder.25 Genomic short-read nucleotide alignment program (GSNAP) was used.26 Bisulfite conversion rates were estimated from the number of unconverted cytosines at Klenow filled-in 3′ MspI sites of sequencing reads that were short enough to read through these sites. For each CpG site, the 5mC rate was calculated as the percentage of unconverted cytosines in each oxRRBS dataset, and the 5hmC rate was calculated by subtracting this value from the percentage of unconverted cytosines in the corresponding RRBS dataset. Transcription start site (TSS) regions were defined as 1,000 bp upstream and downstream of a transcription start site. To test for CpG islands (CGIs) that contained 5mC levels significantly above the bisulfite conversion error rate, a binomial test was applied using a Benjamini-Hochberg corrected p-value cutoff of 0.05. Differences between the RRBS and oxRRBS datasets were tested by applying a Fisher's test and using a corrected p-value cutoff of 0.05. Fisher's test was also used to evaluate if there is any significant difference of 5mC rate in CGIs between two groups of rats. Differential 5hmC was examined by Breslow-Day test for homogeneity of odd ratios between two groups of rats.
Analysis of RNA-seq data
We developed an in-house pipeline for analyzing RNA-seq data that included reads mapping and alignment, transcript construction, quantification of transcript abundance, and identification of differential expression, using Bowtie (http://bowtie-bio.sourceforge.net/index.shtml), Tophat v2 (http://tophat.cbcb.umd.edu/), and Cufflinks (http://cufflinks.cbcb.umd.edu/).27,28,29 Differential expression of transcripts was identified using false discover rate (FDR) < 0.05.
Result
Characteristics of 5mC patterns in SS rats
Characteristics of 5mC patterns in the renal outer medulla of SS rats were examined by analyzing results of oxRRBS analysis of 6-7 week old male SS rats fed the 0.4% NaCl diet. Approximately 18 million sequence reads were obtained from each of 3 biological replicates (Supplemental Table S1). The bisulfite conversion rate was 99.6% on average. The 727,373 CpG sites covered by at least 20 sequence reads were further examined. Of these sites, 47.7% were located in CpG islands (Figure 1A). 11% of the CpG sites located in CpG islands contained significant 5mC (Figure 1A) with a median 5mC rate of 12% (Figure 1B). 81% of the CpG sites located outside of CpG islands contained significant 5mC (Figure 1A) with a median 5mC rate of 58% (Figure 1B).
Figure 1. 5mC patterns in the renal outer medulla of SS rats.
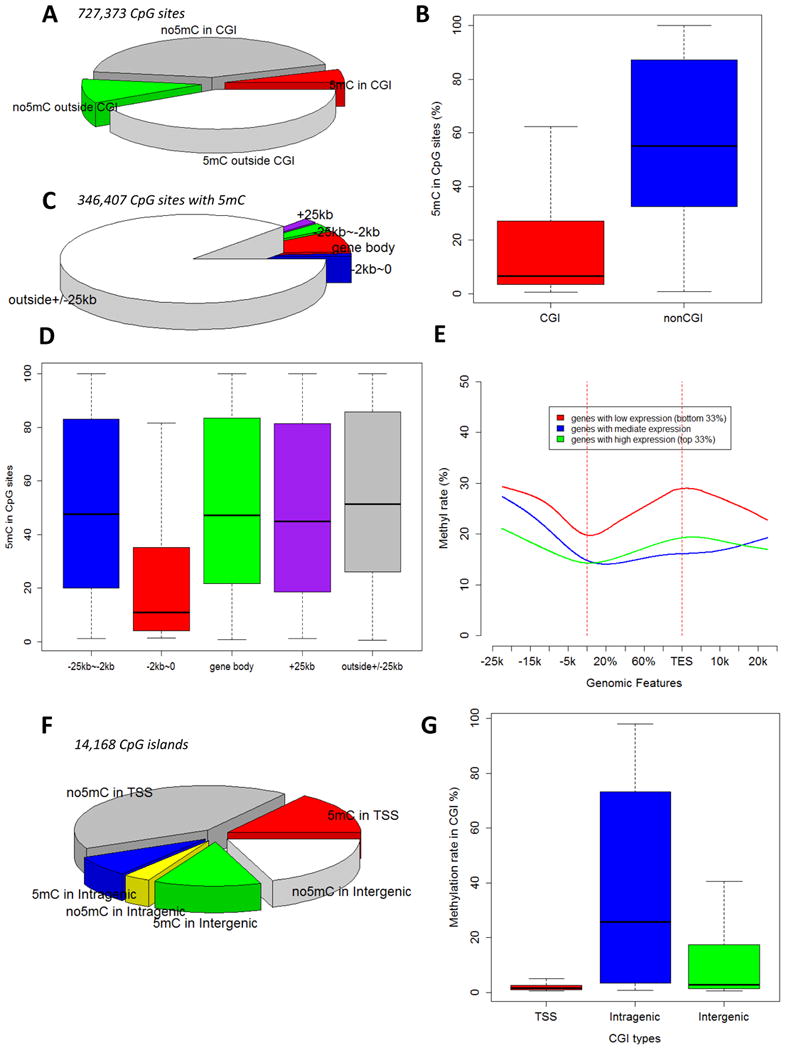
A. Distribution of CpG sites (covered by at least 20 reads) with or without significant 5mC in and outside of CpG islands. B. 5mC rates of CpG sites that contained significant 5mC. C. Distribution of 5mC-containing CpG sites relative to gene bodies. D. 5mC rates of 5mC-containing CpG sites categorized by their spatial relationship with gene bodies. E. 5mC rates across gene body and 25 kbp up- or down-stream of gene body and the relationship with mRNA abundance. 5mC rates were calculated based on CpG sites in 2 kbp windows moving at 100 bp steps. Genes were divided into three groups according to mRNA abundance levels. F. Distribution of CpG islands with or without significant 5mC in transcription start site (+/- 1 kbp), intragenic, and intergenic regions. G. 5mC rates of CpG islands located in the three regions. CGI, CpG island; TSS, transcription start site region.
Figure 1C depicts the distribution of CpG sites containing 5mC relative to the location of gene bodies. CpG sites containing 5mC and located within 2 kbp upstream of transcription start sites (TSS) had a median 5mC rate of 15% (Figure 1D). The median 5mC rates were between 47% and 56% for CpG sites located in other regions (Figure 1D).
Genes with mRNA abundance in the lowest one third of all genes analyzed showed higher 5mC rates throughout the gene body and extending to several kbp upstream and down-stream of the gene body (Figure 1E). Gene body was defined as the genomic region from the start site to the end site of a transcript. All genes showed a nadir of 5mC rate around TSS. The nadir was most pronounced for genes in the lowest one third of mRNA abundance, although the 5mC rates around TSS were still higher for this group of genes compared to genes with higher mRNA abundance. mRNA abundance data used to make the graph here were obtained using RNA-seq (Supplemental Table S2) and will be discussed in more detail later.
We further analyzed 14,168 CpG islands each of which contained at least 5 CpG sites and was covered by at least 20 sequence reads. Of the 8,045 CpG islands located in the TSS region (+/- 1 kbp), 27% contained significant 5mC with a median 5mC rate of 1.5% (Figure 1F, 1G). 69% of intragenic CpG islands and 40% of intergenic CpG islands contained significant 5mC with median 5mC rate of 25.8% and 2.8%, respectively (Figure 1F, 1G).
Characteristics of 5hmC patterns in SS rats
We then examined 5hmC patterns in SS rats by a combined analysis of the RRBS and oxRRBS data (see Methods for criteria of 5hmC detection). Significant presence of 5hmC was found in 1.0% and 10.7% of CpG sites located in and outside CpG islands, respectively (Figure 2A). The median 5hmC rate was 14.9% for CpG sites containing significant 5hmC and located within CpG islands (Figure 2B). The median 5hmC rate tended to be higher in CpG sites located outside of CpG islands (Figure 2B), but the difference was much less pronounced than that of 5mC rates (see Figure 1B).
Figure 2. 5hmC patterns in the renal outer medulla of SS rats.
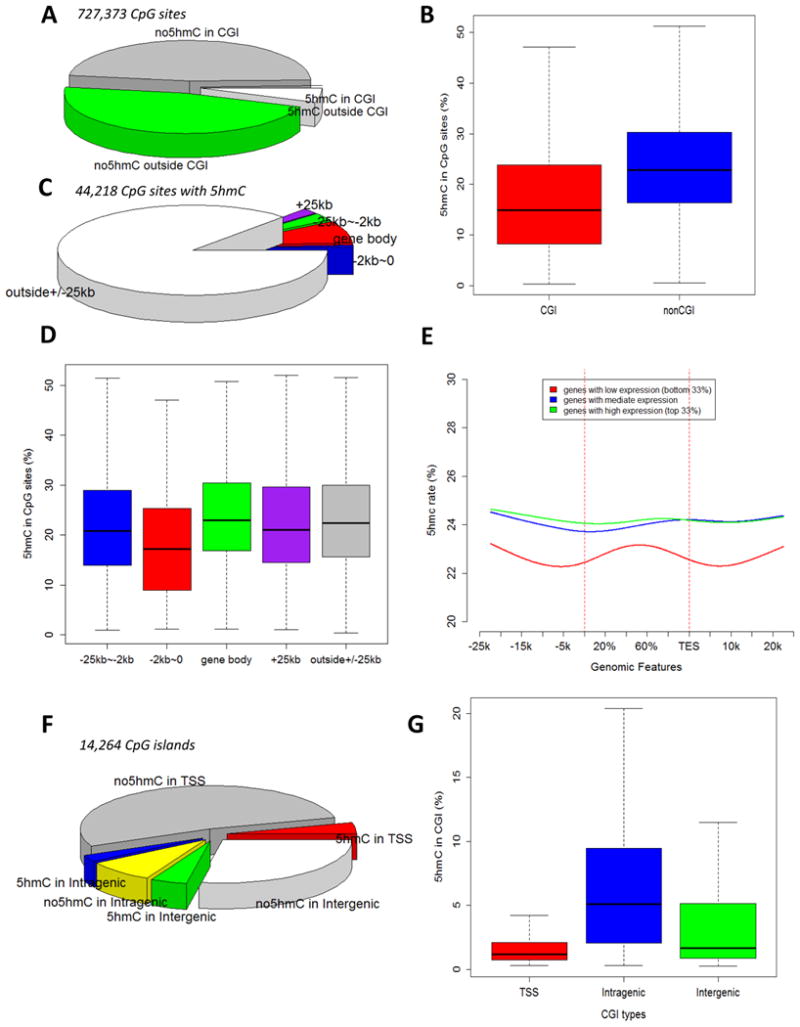
A. Distribution of CpG sites (covered by at least 20 reads) with or without significant 5hmC in and outside of CpG islands (CGI). B. 5hmC rates of CpG sites that contained significant 5hmC. C. Distribution of 5hmC-containing CpG sites relative to gene bodies. D. 5hmC rates of 5hmC-containing CpG sites categorized by their spatial relationship with gene bodies. E. 5hmC rates across gene body and 25 kbp up- or down-stream of gene body and the relationship with mRNA abundance. 5hmC rates were calculated based on CpG sites in 2 kbp windows moving at 100 bp steps. Genes were divided into three groups according to mRNA abundance levels. F. Distribution of CpG islands with or without significant 5hmC in transcription start site (TSS +/- 1 kbp), intragenic, and intergenic regions. G. 5hmC rates of CpG islands located in the three regions.
The distribution of CpG sites containing 5hmC relative to the location of gene bodies (Figure 2C) was similar to those containing 5mC (see Figure 1C). The median 5hmC rates were between 17% and 23% in all regions relative to gene bodies (Figure 2D).
Genes with mRNA abundance in the lowest one third of all genes analyzed showed lower 5hmC rates throughout the gene body and extending to several kbp upstream and down-stream of the gene body (Figure 2E). This was in direct contrast with 5mC rates which were higher for genes with low expression (see Figure 1E). The majority of the genes did not exhibit a pronounced nadir of 5hmC rate around the TSS or anywhere throughout the gene body (Figure 2E), which was again in sharp contrast with 5mC rates.
Of the 8,078 CpG islands located in the TSS region (+/- 1 kbp), 7.5% contained significant 5hmC with a median 5hmC rate of 1.2% (Figure 2F, 2G). 23% of intragenic CpG islands and 14% of intergenic CpG islands contained significant 5hmC with median 5mC rate of 5.1% and 1.7%, respectively (Figure 2F, 2G). The fractions of CpG islands containing 5hmC and the median rates of 5hmC in CpG islands were substantially lower than those of 5mC in all three regions.
Effects of substituting a segment of chromosome 13 on 5mC and 5hmC patterns in SS rats
The salt-sensitive hypertension and renal injury phenotypes in the SS rat were significantly attenuated in congenic SS.13BN26 rats, which contain a substitution of a 12.9 Mbp segment of chromosome 13 from the Brown Norway rat genome for the corresponding segment in the SS genome.11,12 We examined how the chromosomal segment substitution might have altered 5mC and 5hmC patterns in the renal outer medulla.
Of 3,354 CpG islands that showed different (FDR<0.05) 5mC rates between SS and SS.13BN26 rats, 45% were in TSS regions and 19% were intragenic (Figure 3A; Supplemental Table S3). A difference in 5mC rate of greater than 5% was found in 603 CpG islands (FDR<0.05), of which 19% were in TSS regions and 39% were intragenic (Figure 3A). The switch in the proportion of TSS and intragenic CpG islands was consistent with the substantially higher 5mC rates in intragenic CpG islands in general (see Figure 1G). The distribution of 5mC rates of differentially methylated CpG islands (Figure 3B, top panel) was similar to the distribution of all CpG islands (see Figure 1G). With the additional cutoff of difference > 5% 5mC rate, median 5mC rates of differentially methylated CpG islands shifted upwards, especially for CpG islands in TSS and intergenic regions (Figure 3B, bottom panel).
Figure 3. Effect of a chromosome 13 segment substitution on 5mC and 5hmC patterns.
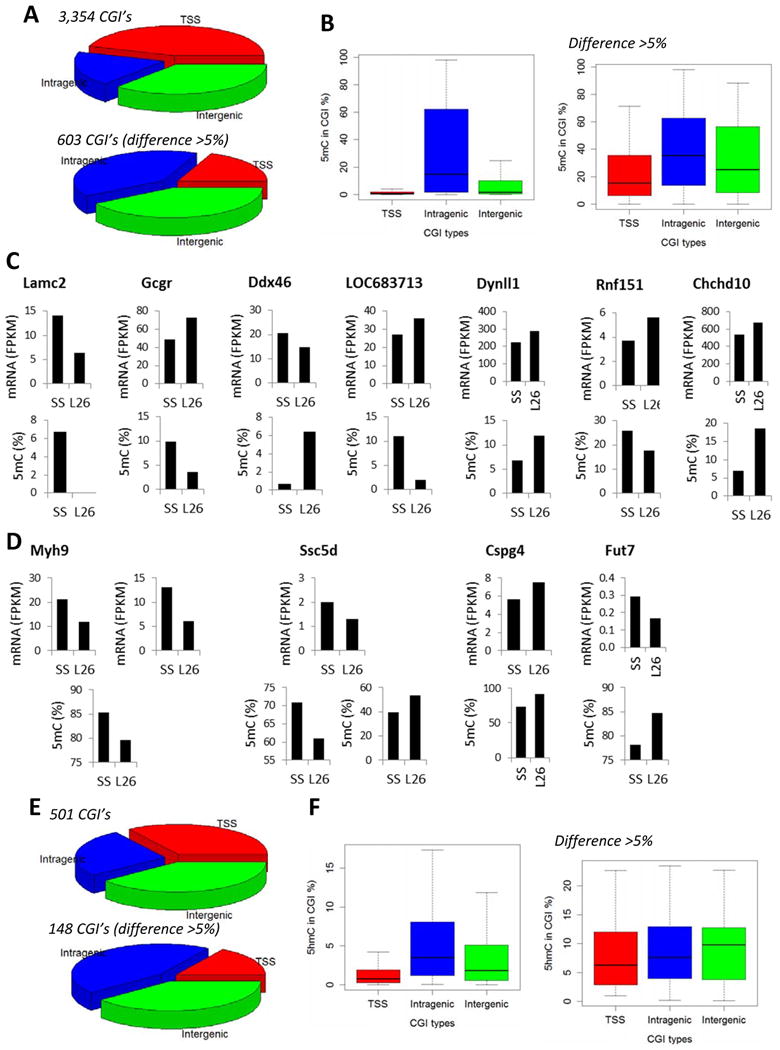
A. Distribution of CpG islands (CGI) containing differential 5mC levels between SS and SS.13BN26 rats. The rats were maintained on a 0.4% NaCl diet. The top graph represented CpG islands with FDR < 0.05. The bottom graph represented CpG islands with FDR < 0.05 and difference > 5% 5mC rate. B. 5mC rates of CpG islands containing differential 5mC levels between SS and SS.13BN26 rats. C. Genes showing differential 5mC in CpG islands in transcription start site regions and differential mRNA expression between SS and SS.13BN26 rats. L26 represents SS.13BN26 rats. D. Genes showing differential 5mC in CpG islands in intragenic regions and differential mRNA expression between SS and SS.13BN26 rats. E. Distribution of CpG islands containing differential 5hmC levels between SS and SS.13BN26 rats. The top graph represented CpG islands with FDR < 0.05. The bottom graph represented CpG islands with FDR < 0.05 and difference > 5% 5hmC rate. F 5hmC rates of CpG islands containing differential 5hmC levels between SS and SS.13BN26 rats.
We examined the 114 differentially methylated CpG islands located in TSS regions and found seven of the associated genes were significantly differentially expressed between SS and SS.13BN26 (P<0.05; Figure 3C). The directions of change in 5mC rate and mRNA abundance were opposite for 4 of the genes and the same for the other 3. Four genes associated with differential methylation of intragenic CpG islands were differentially expressed (Figure 3D). Note that some genes have multiple differentially methylated islands associated with one transcript, and vice versa.
Significant differences (FDR<0.05) in 5hmC rate were found in 501 CpG islands, of which 148 islands differed by more than 5% of 5hmC rate (Figure 3E; Supplemental Table S4). Again, intragenic CpG islands were more likely than TSS CpG islands to show large differences in 5hmC rate. The distribution of 5hmC rates of differentially hydroxymethylated CpG islands (Figure 3F, top panel) was similar to the distribution of all CpG islands (see Figure 2G). 5hmC rates were similar for TSS, intragenic, and intergenic CpG islands that showed differences greater than a 5% rate between the two rat strains (Figure 3F, bottom panel).
The genes associated with the 24 CpG islands in TSS regions and the 66 in intragenic regions that were differentially hydroxymethylated (FDR<0.05, 5hmC rate difference >5%) were not significantly differentially expressed at the mRNA level, although some approached significant differences.
Distinct effects of a 4% NaCl diet for 7 days on 5mC and 5hmC patterns in SS and SS.13BN26 rats
High-salt diets substantially exacerbate cardiovascular and renal diseases in SS rats,2,3 which is attenuated in SS.13BN26 rats.11,12 We examined the effect of a 7 day exposure to an AIN-76A diet containing 4% NaCl on 5mC and 5hmC patterns in SS and SS.13BN26 rats. The 7 day time point represents an early phase of high salt-induced disease progression.30
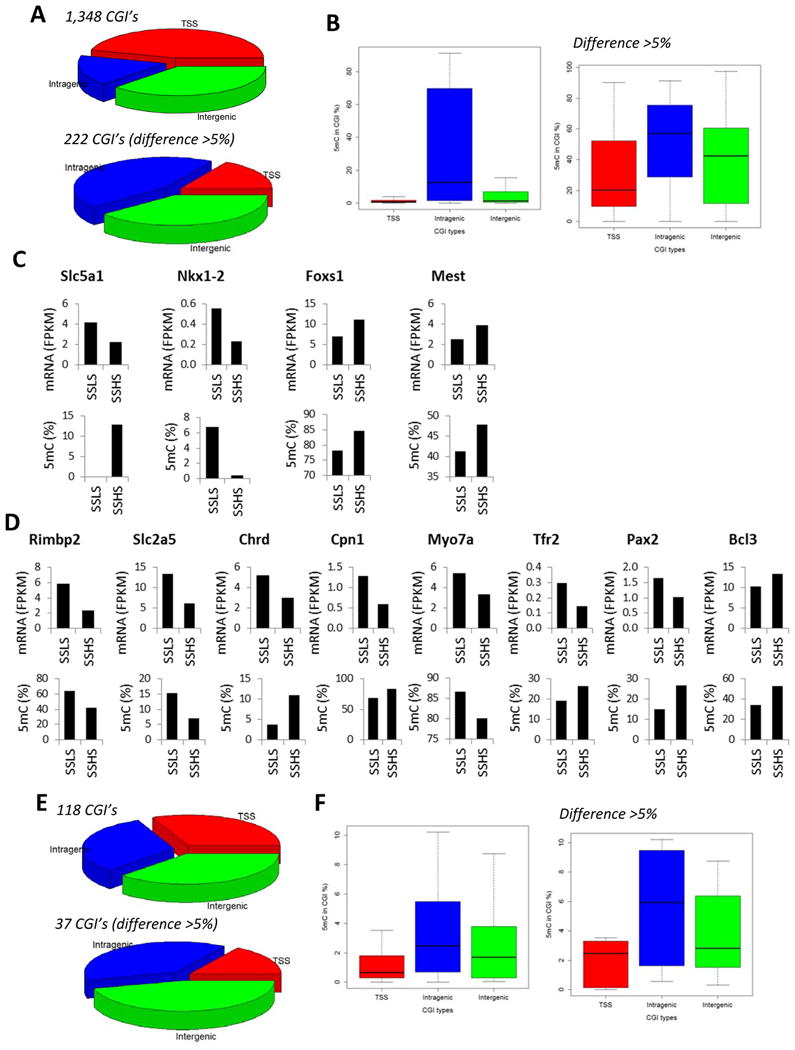
Significant changes occurring in both strains of rats or in one but not the other strain were shown in Figure 4, Figure 5, and Figure 6, respectively, as well as in Supplemental Table S3 and S4. Changes occurring in both strains of rats likely represent responses to the high-salt diet that are not directly associated with phenotypic differences between the two rat strains. Changes occurring in one but not the other strain may contribute to the differences in disease development between SS and SS.13BN26.
Figure 4. 5mC and 5hmC altered by a high-salt diet in both SS and SS.13BN26 rats.
A. Distribution of CpG islands of which 5mC levels were altered by 7 days of a 4% NaCl diet in both SS and SS.13BN26 rats. The top graph represented CpG islands with FDR < 0.05. The bottom graph represented CpG islands with FDR < 0.05 and difference > 5% 5mC rate. B. 5mC rates of CpG islands of which 5mC levels were altered by 7 days of a 4% NaCl diet in both SS and SS.13BN26 rats. C. Genes showing differential 5mC in CpG islands in intragenic regions in response to the high-salt diet in both SS and SS.13BN26 rats and differential mRNA expression in at least one of the rat strains. D. Distribution of CpG islands of which 5hmC levels were altered by 7 days of a 4% NaCl diet in both SS and SS.13BN26 rats. The top graph represented CpG islands with FDR < 0.05. The bottom graph represented CpG islands with FDR < 0.05 and difference > 5% 5hmC rate. E. 5hmC rates of CpG islands of which 5hmC levels were altered by 7 days of a 4% NaCl diet in both SS and SS.13BN26 rats. F. A gene showing differential 5hmC in a CpG island in the intragenic region in response to the high-salt diet in both SS and SS.13BN26 rats and differential mRNA expression in SS.13BN26. L26, SS.13BN26 rat; LS, 0.4% NaCl diet; HS, 7 days of 4% NaCl diet. *, P<0.05 vs the LS group of the same strain.
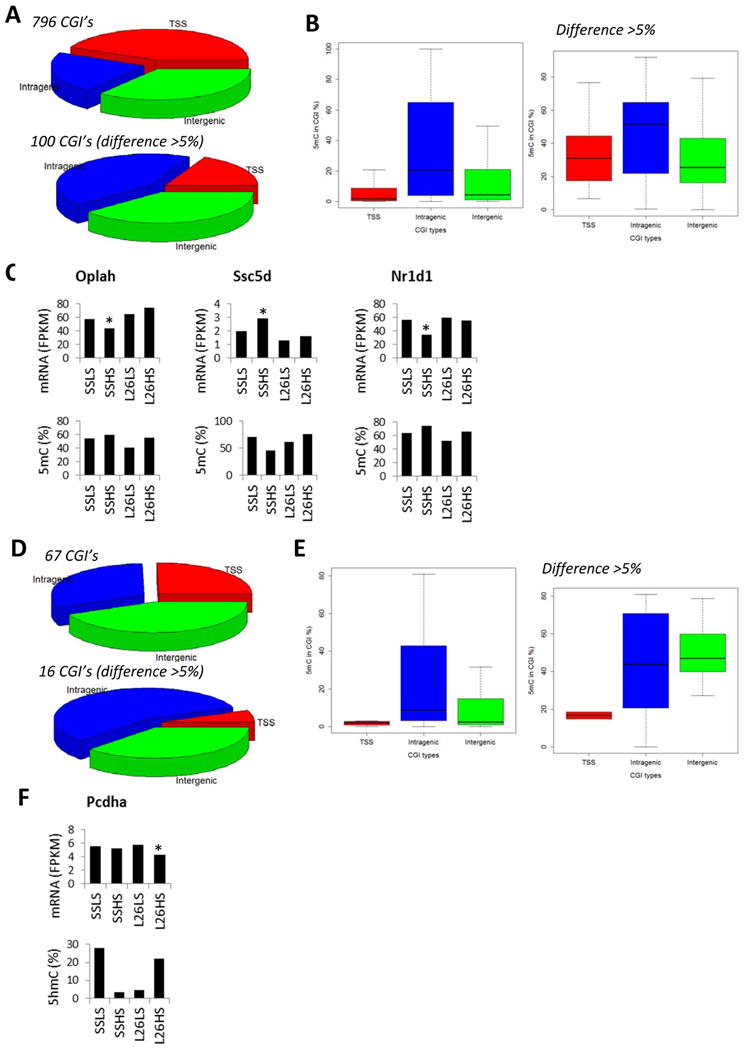
Figure 5. 5mC and 5hmC altered by a high-salt diet in SS rats, but not in SS.13BN26 rats.
A. Distribution of CpG islands of which 5mC levels were altered by 7 days of a 4% NaCl diet in SS rats, but not in SS.13BN26 rats. The top graph represented CpG islands with FDR < 0.05. The bottom graph represented CpG islands with FDR < 0.05 and difference > 5% 5mC rate. B. 5mC rates of CpG islands of which 5mC levels were altered by 7 days of a 4% NaCl diet in SS rats, but not in SS.13BN26 rats. C. Genes showing differential 5mC in CpG islands in transcription start site regions in response to the high-salt diet in in SS rats, but not in SS.13BN26 rats, and differential mRNA expression in SS rats. D. Genes showing differential 5mC in CpG islands in intragenic regions in response to the high-salt diet in SS rats, but not in SS.13BN26 rats, and differential mRNA expression in SS rats. E. Distribution of CpG islands of which 5hmC levels were altered by 7 days of a 4% NaCl diet in SS rats, but not in SS.13BN26 rats. The top graph represented CpG islands with FDR < 0.05. The bottom graph represented CpG islands with FDR < 0.05 and difference > 5% 5hmC rate. F. 5hmC rates of CpG islands of which 5hmC levels were altered by 7 days of a 4% NaCl diet in SS rats, but not in SS.13BN26 rats. LS, 0.4% NaCl diet; HS, 7 days of 4% NaCl diet.
Figure 6. 5mC and 5hmC altered by a high-salt diet in SS.13BN26 rats, but not in SS rats.
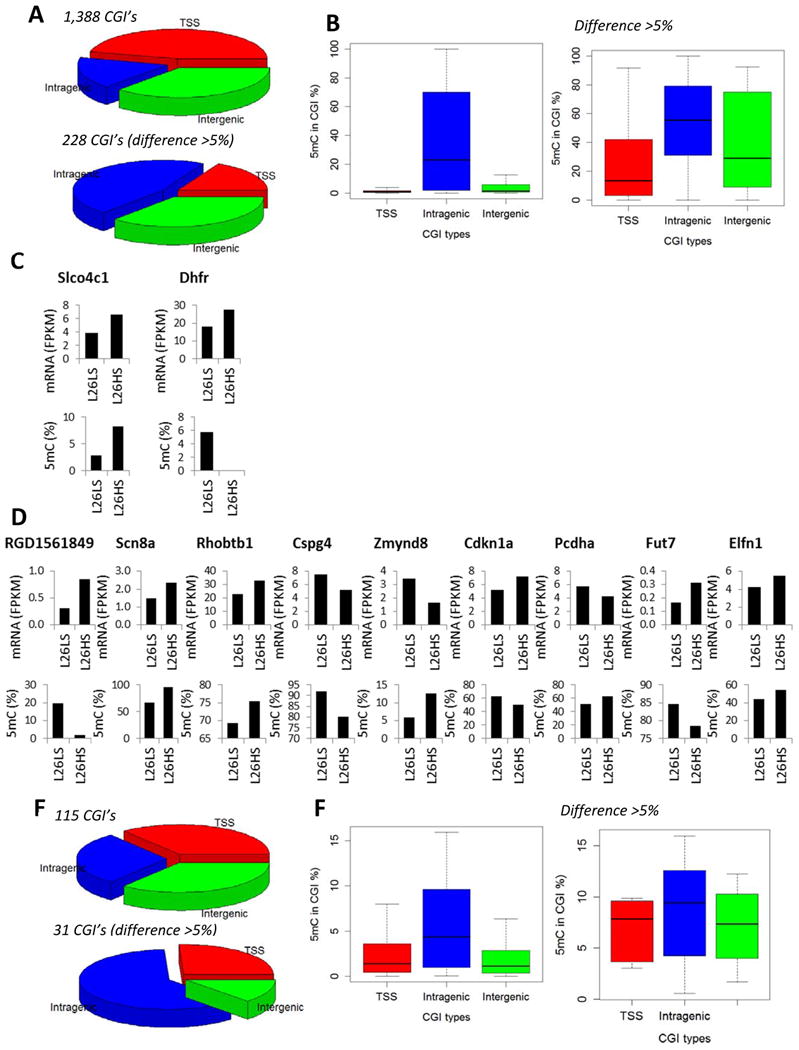
A. Distribution of CpG islands of which 5mC levels were altered by 7 days of a 4% NaCl diet in SS.13BN26 rats, but not in SS rats. The top graph represented CpG islands with FDR < 0.05. The bottom graph represented CpG islands with FDR < 0.05 and difference > 5% 5mC rate. B. 5mC rates of CpG islands of which 5mC levels were altered by 7 days of a 4% NaCl diet in SS.13BN26 rats, but not in SS rats. C. Genes showing differential 5mC in CpG islands in transcription start site regions in response to the high-salt diet in SS.13BN26 rats, but not in SS rats, and differential mRNA expression in SS.13BN26 rats. D. Genes showing differential 5mC in CpG islands in intragenic regions in response to the high-salt diet in SS.13BN26 rats, but not in SS rats, and differential mRNA expression in SS.13BN26 rats. E. Distribution of CpG islands of which 5hmC levels were altered by 7 days of a 4% NaCl diet in SS.13BN26 rats, but not in SS rats. The top graph represented CpG islands with FDR < 0.05. The bottom graph represented CpG islands with FDR < 0.05 and difference > 5% 5hmC rate. F. 5hmC rates of CpG islands of which 5hmC levels were altered by 7 days of a 4% NaCl diet in SS.13BN26 rats, but not in SS rats. L26, SS.13BN26 rat; LS, 0.4% NaCl diet; HS, 7 days of 4% NaCl diet.
More than 300 CpG islands showed substantial differential methylation (FDR<0.05, difference >5% 5mC rate) in each strain in response to just 7 days of high-salt exposure (Figure 4A, 5A, 6A). Approximately 50 CpG islands showed substantial differential hydroxymethylation in each strain (Figure 4D, 5E, 6E). Approximately 30% of the changes occurred in both strains.
A total of 26 instances of salt-induced substantial differential methylation were associated with significant changes in mRNA abundance (Figure 4C, 5C, 5D, 6C, 6D). Nearly 80% (20 of 26) of these instances were intragenic CpG islands (Figure 4C, 5D, 6D). In 12 of the 20 instances, changes of the 5mC rate of intragenic CpG islands and the mRNA abundance of the corresponding gene occurred in opposite directions. For the 6 CpG islands in TSS regions, 3 showed opposite changes in 5mC rate and mRNA abundance.
One gene, Pcdha, showed substantial down-regulation of 5hmC rate in SS and up-regulation in SS.13BN26 in response to salt in an intragenic CpG island, which was associated with significant down-regulation of mRNA abundance in SS.13BN26 in response to salt (Figure 4F).
Transcriptomes in the renal outer medulla in SS and SS.13BN26 rats on 0.4% or 4% NaCl diets
Significant differences in the mRNA abundance of 220 genes (FDR<0.05) were found by comparing SS and SS.13BN26 rats fed the 0.4% NaCl diet (Figure 7A; Supplemental Table S5). The number of genes differentially expressed between the two strains increased to 1,146 after 7 days of 4% NaCl diet. More than 40% of the genes differentially expressed on the 0.4% salt diet (92 of 220 genes) remained differentially expressed on the 4% salt diet.
Figure 7. Transcriptome differences between SS and SS.13BN26 rats on 0.4% or 4% NaCl diet.
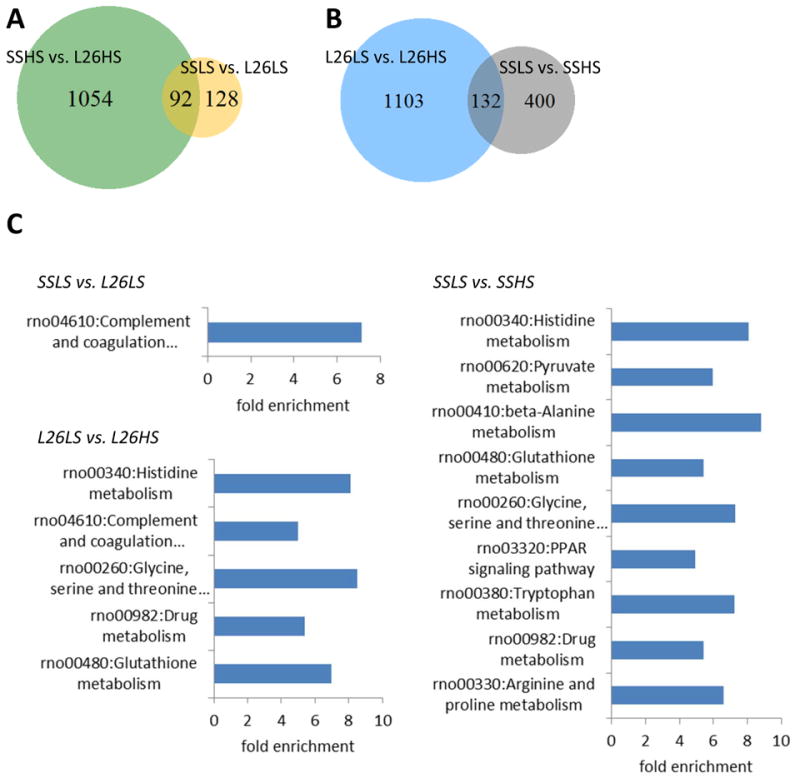
A. The numbers of genes differentially expressed between SS and SS.13BN26 rats maintained on a 0.4% NaCl diet or switched to a 4% NaCl diet for 7 days. B. The numbers of genes differentially expressed in SS or SS.13BN26 rats in response to 7 days of a 4% NaCl diet. C. KEGG pathways significantly enriched (FDR < 0.05) in the differentially expressed genes. L26, SS.13BN26 rat; LS, 0.4% NaCl diet; HS, 7 days of 4% NaCl diet.
Significant responses to the 4% NaCl diet were found for 532 genes in SS rats, 25% of which (132 of 532 genes) also responded to the 4% NaCl diet in SS.13BN26 rats (Figure 7B). Another 1,103 genes showed differential expression in response to high salt only in SS.13BN26 rats.
Genes responding to salt in either strain were significantly enriched for genes in KEGG pathways involving metabolism of several amino acids and glutathione (Figure 7C). Cellular redox states and amino acid metabolites such as catecholamines in the kidney are known to contribute to blood pressure regulation.12 Pyruvate metabolism and PPAR signaling pathway were enriched in genes responding to salt in SS rats (Figure 7C). Abnormalities in cellular intermediate metabolism in the kidney have been recently discovered to contribute to hypertension.31,32,33 Complement and coagulation cascades, which include the kallikrein-kinin system known to influence blood pressure, were enriched in genes differentially expressed between SS and SS.13BN26 on the 0.4% NaCl diet and in genes responding to salt in SS.13BN26 rats (Figure 7C).
Three genes in the pyruvate metabolism pathway, which were down-regulated by the high-salt diet in SS rats, and two genes that were up-regulated were selected for validation by real-time PCR. Both the direction and the magnitude of changes in response to salt were consistent between real-time PCR and RNA-seq data for all 5 genes (Supplemental Figure S1).
Trans and cis effects of genetic variations on 5mC, 5hmC, and mRNA abundance profiles
SS and SS.13BN26 rats differ genetically by a 12.9 Mbp segment on chromosome 13 (nucleotides 73,664,780 to 86,574,314). The segment represents 0.44% of the rat genome. We examined if the substituted segment was more likely than the remaining genome to be differentially methylated or differentially expressed between the two rat strains or in response to the high-salt diet.
Genes differentially expressed between SS and SS.13BN26 on the 0.4% NaCl diet and, to a lesser extent, genes differentially expressed in response to the 4% NaCl diet in only one of the two rat strains, were significantly enriched for genes located in the substituted segment (Figure 8). It suggests the genomic sequence variations have strong cis effects on mRNA expression at the baseline and in response to salt. CpG islands located in the substituted genomic segment, however, were not more likely than the rest the genome to show differential 5mC or 5hmC between the two rat strains or in response to salt (Figure 8).
Figure 8. Genomic segment enrichment of altered 5mC, 5hmC, and mRNA abundance.
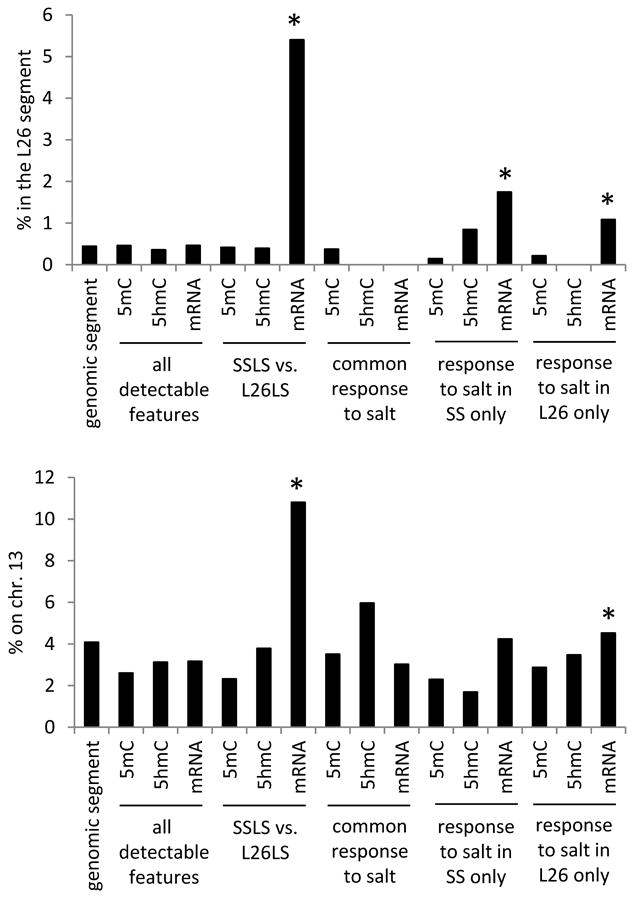
The graphs showed percentage of genomic segment, CpG islands, or genes located within the substituted chr. 13 L26 segment (top) or on chr. 13 (bottom). All detected CpG islands with significant 5mC or 5hmC, all expressed genes, CpG islands with differential 5mC or 5hmC, or genes with differential mRNA abundance in the indicated comparisons were examined. L26, SS.13BN26 rat; LS, 0.4% NaCl diet.*, P<0.05 vs. all detectable features (chi-square test).
Discussion
The present study provides one of the first maps of 5mC and 5hmC patterns at single-base resolution in an in vivo model of disease. The results indicate several characteristics of 5mC and 5hmC patterns, some in common with previous findings in stem cells while others not.
The moving window analysis across gene bodies, powered by the single-base resolution data, indicated higher 5mC and lower 5hmC levels in genes with low expression. This is consistent with the notion that 5mC generally suppress gene expression while 5hmC is generally correlated with gene activation.8,34 Changes in 5mC or 5hmC levels in response to the genomic segment substitution or high-salt diet, however, were as likely to be associated with changes in mRNA abundance in the same direction (up- or down-regulation) as they are in the opposite direction. These findings suggest 5mC and 5hmC might tend to play suppressive and activating roles, respectively, in determining the expression profile across all genes in a given tissue, which would be programmed during cell development and differentiation. More subtle perturbations, such as genetic or physiological manipulations, could alter gene expression via numerous mechanisms such as transcription factor activation, histone modification, and regulatory RNA including microRNA and long non-coding RNA. In these cases, changes in 5mC and 5hmC may play more of a fine-tuning role and act together with other mechanisms mentioned above to contribute to differential expression.
CpG islands located in the promoter regions have been the main focus of studies examining the role of DNA methylation in gene expression. The current study supports the importance of these regions as illustrated by, for example, the prominent nadir of 5mC levels around the TSS. The current study, however, indicates a disproportionately large role of intragenic CpG islands in physiological regulation of gene expression. It would be interesting to further understand how changes in 5mC levels in intragenic CpG islands affect transcription.34,35
Genomic sequence variation could affect 5mC, 5hmC, and mRNA expression via either trans- or cis-acting mechanisms. Consistent with our previous findings,36,37 the substituted genomic segment appears to have substantial cis effects on mRNA expression. The effect of the substituted genomic segment on 5mC and 5hmC patterns, however, is not any more likely to be cis than trans. It remains to be determined which genes located in the substituted segment contribute to the trans regulation of 5mC or 5hmC.
Exposure to a high-salt diet for just seven days induced significant changes in 5mC and 5hmC patterns. The vast majority of the cells in the renal outer medulla do not divide actively. We suspect most of the changes in 5mC and 5hmC that occurred might be caused by changes in DNA methyltransferase 3, ten-eleven translocation enzymes, and other enzymes that mediate de novo DNA methylation or de-methylation independent of cell division, or by other factors that affect de novo patterns of 5mC or 5hmC. Some of the salt effects were unique to SS or SS.13BN26, suggesting the effects might be influenced by the substituted genomic segment via trans mechanisms. It remains to be determined how long the changes in 5mC or 5hmC patterns will persist if the dietary salt level is returned to 0.4%. It would also be interesting to investigate whether the high-salt diet could induce changes in 5mC, 5hmC, or other epigenetic regulators in germ cells or in the maternal environment in pregnant rats that can then transmit the memory of high-salt exposure to future generations.5
The present study demonstrates the feasibility of detecting changes in 5mC and 5hmC in a complex tissue region in response to genetic or physiological manipulations. The presence of multiple cell types in in vivo tissues complicates data interpretation. However, the physiological and disease relevance of in vivo tissues far outweighs any concerns about the complexity. It would be highly valuable to carry out 5mC and 5hmC analysis in homogeneous cell populations purified from in vivo tissues.20,33,37 Purification, however, is practical only for some cell types, and the process of purification may introduce other confounding factors.
Perspectives
Epigenetic modifications likely play an important role in the development and inheritance of hypertension.6 While epigenetic modifications of several genes have been shown to be associated with hypertension, genome-wide understanding of epigenetic changes in hypertension is largely lacking.5 The current study provided a genome-wide view of 5mC and 5hmC levels at single-base resolution in an in vivo disease model. The results should drive the development of new directions of investigation into the mechanisms underlying complex diseases including, but not limited to, hypertension.
Supplementary Material
Novelty and Significance (per journal requirement).
What is new?
One of the first single base-resolution maps of 5hmC in any in vivo disease model.
The first base-resolution, genome-scale maps of 5mC and 5hmC in hypertension.
The first study of effects of dietary salt intake and genomic segment substitution on 5mC and 5hmC patterns.
What is relevant?
The result provides novel insights into the epigneomics of hypertension.
Summary
We carried out one of the first studies mapping 5mC and 5hmC at single base-resolution in any in vivo disease model. The results revealed several characteristics of 5mC and 5hmC important for understanding their contribution to disease processes in vivo.
Acknowledgments
Sources of Funding: This work was supported by US National Institutes of Health grants HL111580 (ML), HL082798 (AWC, ML), HL029587 (AWC), and Advancing a Healthier Wisconsin Fund FP1701 and FP1703 (PL).
Footnotes
Authors' contributions: YL carried out the 5mC and 5hmC experiments. PL performed data analysis. CY carried out the RNA-seq experiment. AWC participated in study design and data interpretation. ML designed the study, participated in data analysis, and drafted the manuscript. All authors read and approved the final manuscript.
Disclosures: None.
References
- 1.Kotchen TA, Cowley AW, Jr, Frohlich ED. Salt in health and disease--a delicate balance. N Engl J Med. 2013;368:1229–1237. doi: 10.1056/NEJMra1212606. [DOI] [PubMed] [Google Scholar]
- 2.Cowley AW., Jr The genetic dissection of essential hypertension. Nat Rev Genet. 2006;7:829–840. doi: 10.1038/nrg1967. [DOI] [PubMed] [Google Scholar]
- 3.Rapp JP. Genetic analysis of inherited hypertension in the rat. Physiol Rev. 2000;80:135–172. doi: 10.1152/physrev.2000.80.1.135. [DOI] [PubMed] [Google Scholar]
- 4.Gopalakrishnan K, Kumarasamy S, Abdul-Majeed S, Kalinoski AL, Morgan EE, Gohara AF, Nauli SM, Filipiak WE, Saunders TL, Joe B. Targeted disruption of Adamts16 gene in a rat genetic model of hypertension. Proc Natl Acad Sci U S A. 2012;109:20555–20559. doi: 10.1073/pnas.1211290109. [DOI] [PMC free article] [PubMed] [Google Scholar]
- 5.Liang M, Cowley AW, Jr, Mattson DL, Kotchen TA, Liu Y. Epigenomics of hypertension. Semin Nephrol. 2013;33:392–399. doi: 10.1016/j.semnephrol.2013.05.011. [DOI] [PMC free article] [PubMed] [Google Scholar]
- 6.Cowley AW, Jr, Nadeau JH, Baccarelli A, Berecek K, Fornage M, Gibbons GH, Harrison DG, Liang M, Nathanielsz PW, O'Connor DT, Ordovas J, Peng W, Soares MB, Szyf M, Tolunay HE, Wood KC, Zhao K, Galis ZS. Report of the National Heart, Lung, and Blood Institute Working Group on epigenetics and hypertension. Hypertension. 2012;59:899–905. doi: 10.1161/HYPERTENSIONAHA.111.190116. [DOI] [PMC free article] [PubMed] [Google Scholar]
- 7.Meissner A, Mikkelsen TS, Gu H, Wernig M, Hanna J, Sivachenko A, Zhang X, Bernstein BE, Nusbaum C, Jaffe DB, Gnirke A, Jaenisch R, Lander ES. Genome-scale DNA methylation maps of pluripotent and differentiated cells. Nature. 2008;454:766–770. doi: 10.1038/nature07107. [DOI] [PMC free article] [PubMed] [Google Scholar]
- 8.Branco MR, Ficz G, Reik W. Uncovering the role of 5-hydroxymethylcytosine in the epigenome. Nat Rev Genet. 2011;13:7–13. doi: 10.1038/nrg3080. [DOI] [PubMed] [Google Scholar]
- 9.Booth MJ, Branco MR, Ficz G, Oxley D, Krueger F, Reik W, Balasubramanian S. Quantitative sequencing of 5-methylcytosine and 5-hydroxymethylcytosine at single-base resolution. Science. 2012;336:934–937. doi: 10.1126/science.1220671. [DOI] [PubMed] [Google Scholar]
- 10.Yu M, Hon GC, Szulwach KE, Song CX, Zhang L, Kim A, Li X, Dai Q, Shen Y, Park B, Min JH, Jin P, Ren B, He C. Base-resolution analysis of 5-hydroxymethylcytosine in the mammalian genome. Cell. 2012;149:1368–1380. doi: 10.1016/j.cell.2012.04.027. [DOI] [PMC free article] [PubMed] [Google Scholar]
- 11.Lu L, Li P, Yang C, Kurth T, Misale M, Skelton M, Moreno C, Roman RJ, Greene AS, Jacob HJ, Lazar J, Liang M, Cowley AW., Jr Dynamic convergence and divergence of renal genomic and biological pathways in protection from Dahl salt-sensitive hypertension. Physiol Genomics. 2010;41:63–70. doi: 10.1152/physiolgenomics.00170.2009. [DOI] [PMC free article] [PubMed] [Google Scholar]
- 12.Feng D, Yang C, Geurts AM, Kurth T, Liang M, Lazar J, Mattson DL, O'Connor PM, Cowley AW., Jr Increased expression of NAD(P)H oxidase subunit p67(phox) in the renal medulla contributes to excess oxidative stress and salt-sensitive hypertension. Cell Metab. 2012;15:201–208. doi: 10.1016/j.cmet.2012.01.003. [DOI] [PMC free article] [PubMed] [Google Scholar]
- 13.Guyton AC. Blood pressure control--special role of the kidneys and body fluids. Science. 1991;252:1813–1816. doi: 10.1126/science.2063193. [DOI] [PubMed] [Google Scholar]
- 14.Cowley AW, Jr, Roman RJ. The role of the kidney in hypertension. JAMA. 1996;275:1581–1589. [PubMed] [Google Scholar]
- 15.Lifton RP, Gharavi AG, Geller DS. Molecular mechanisms of human hypertension. Cell. 2001;104:545–556. doi: 10.1016/s0092-8674(01)00241-0. [DOI] [PubMed] [Google Scholar]
- 16.Cowley AW., Jr Long-term control of arterial blood pressure. Physiol Rev. 1992;72:231–300. doi: 10.1152/physrev.1992.72.1.231. [DOI] [PubMed] [Google Scholar]
- 17.Cowley AW, Jr, Mattson DL, Lu S, Roman RJ. The renal medulla and hypertension. Hypertension. 1995;25:663–673. doi: 10.1161/01.hyp.25.4.663. [DOI] [PubMed] [Google Scholar]
- 18.Tian Z, Greene AS, Pietrusz JL, Matus IR, Liang M. MicroRNA-target pairs in the rat kidney identified by microRNA microarray, proteomic, and bioinformatic analysis. Genome Res. 2008;18:404–411. doi: 10.1101/gr.6587008. [DOI] [PMC free article] [PubMed] [Google Scholar]
- 19.Liu Y, Mladinov D, Pietrusz JL, Usa K, Liang M. Glucocorticoid response elements and 11 beta-hydroxysteroid dehydrogenases in the regulation of endothelial nitric oxide synthase expression. Cardiovasc Res. 2009;81:140–147. doi: 10.1093/cvr/cvn231. [DOI] [PMC free article] [PubMed] [Google Scholar]
- 20.Kriegel AJ, Liu Y, Liu P, Baker MA, Hodges MR, Hua X, Liang M. Characteristics of MicroRNAs Enriched in Specific Cell Types and Primary Tissue Types in Solid Organs. Physiol Genomics. 2013;45:1144–1156. doi: 10.1152/physiolgenomics.00090.2013. [DOI] [PMC free article] [PubMed] [Google Scholar]
- 21.Gu H, Smith ZD, Bock C, Boyle P, Gnirke A, Meissner A. Preparation of reduced representation bisulfite sequencing libraries for genome-scale DNA methylation profiling. Nat Protoc. 2011;6:468–481. doi: 10.1038/nprot.2010.190. [DOI] [PubMed] [Google Scholar]
- 22.Kriegel AJ, Fang Y, Liu Y, Tian Z, Mladinov D, Matus IR, Ding X, Greene AS, Liang M. MicroRNA-target pairs in human renal epithelial cells treated with transforming growth factor beta 1: a novel role of miR-382. Nucleic Acids Res. 2010;38:8338–8847. doi: 10.1093/nar/gkq718. [DOI] [PMC free article] [PubMed] [Google Scholar]
- 23.Liu Y, Taylor NE, Lu L, Usa K, Cowley AW, Jr, Ferreri NR, Yeo NC, Liang M. Renal medullary microRNAs in Dahl salt-sensitive rats: miR-29b regulates several collagens and related genes. Hypertension. 2010;55:974–982. doi: 10.1161/HYPERTENSIONAHA.109.144428. [DOI] [PMC free article] [PubMed] [Google Scholar]
- 24.Mladinov D, Liu Y, Mattson DL, Liang M. MicroRNAs contribute to the maintenance of cell-type-specific physiological characteristics: miR-192 targets Na+/K+-ATPase β1. Nucleic Acids Res. 2013;41:1273–1283. doi: 10.1093/nar/gks1228. [DOI] [PMC free article] [PubMed] [Google Scholar]
- 25.Pedersen B, Hsieh TF, Ibarra C, Fischer RL. MethylCoder: software pipeline for bisulfite-treated sequences. Bioinformatics. 2011;27:2435–2436. doi: 10.1093/bioinformatics/btr394. [DOI] [PMC free article] [PubMed] [Google Scholar]
- 26.Wu TD, Nacu S. Fast and SNP-tolerant detection of complex variants and splicing in short reads. Bioinformatics. 2010;26:873–881. doi: 10.1093/bioinformatics/btq057. [DOI] [PMC free article] [PubMed] [Google Scholar]
- 27.Langmead B, Trapnell C, Pop M, Salzberg SL. Ultrafast and memory-efficient alignment of short DNA sequences to the human genome. Genome Biol. 2009;10:R25. doi: 10.1186/gb-2009-10-3-r25. [DOI] [PMC free article] [PubMed] [Google Scholar]
- 28.Kim D, Pertea G, Trapnell C, Pimentel H, Kelley R, Salzberg SL. TopHat2: accurate alignment of transcriptomes in the presence of insertions, deletions and gene fusions. Genome Biology. 2011;14:R36. doi: 10.1186/gb-2013-14-4-r36. [DOI] [PMC free article] [PubMed] [Google Scholar]
- 29.Trapnell C, Williams BA, Pertea G, Mortazavi A, Kwan G, van Baren MJ, Salzberg SL, Wold BJ, Pachter L. Transcript assembly and quantification by RNA-Seq reveals unannotated transcripts and isoform switching during cell differentiation. Nat Biotechnol. 2010;28:511–515. doi: 10.1038/nbt.1621. [DOI] [PMC free article] [PubMed] [Google Scholar]
- 30.Tian Z, Greene AS, Usa K, Matus IR, Bauwens J, Pietrusz JL, Cowley AW, Jr, Liang M. Renal regional proteomes in young Dahl salt-sensitive rats. Hypertension. 2008;51:899–904. doi: 10.1161/HYPERTENSIONAHA.107.109173. [DOI] [PubMed] [Google Scholar]
- 31.Tian Z, Liu Y, Usa K, Mladinov D, Fang Y, Ding X, Greene AS, Cowley AW, Jr, Liang M. Novel role of fumarate metabolism in dahl-salt sensitive hypertension. Hypertension. 2009;54:255–260. doi: 10.1161/HYPERTENSIONAHA.109.129528. [DOI] [PMC free article] [PubMed] [Google Scholar]
- 32.Liang M. Hypertension as a mitochondrial and metabolic disease. Kidney Int. 2011;80:15–16. doi: 10.1038/ki.2011.84. [DOI] [PubMed] [Google Scholar]
- 33.Zheleznova NN, Yang C, Ryan RP, Halligan BD, Liang M, Greene AS, Cowley AW., Jr Mitochondrial proteomic analysis reveals deficiencies in oxygen utilization in medullary thick ascending limb of Henle in the Dahl salt-sensitive rat. Physiol Genomics. 2012;44:829–842. doi: 10.1152/physiolgenomics.00060.2012. [DOI] [PMC free article] [PubMed] [Google Scholar]
- 34.Deaton AM, Bird A. CpG islands and the regulation of transcription. Genes Dev. 2011;25:1010–1022. doi: 10.1101/gad.2037511. [DOI] [PMC free article] [PubMed] [Google Scholar]
- 35.Maunakea AK, Chepelev I, Cui K, Zhao K. Intragenic DNA methylation modulates alternative splicing by recruiting MeCP2 to promote exon recognition. Cell Res. 2013;23:1256–1269. doi: 10.1038/cr.2013.110. [DOI] [PMC free article] [PubMed] [Google Scholar]
- 36.Liang M, Lee NH, Wang H, Greene AS, Kwitek AE, Kaldunski ML, Luu TV, Frank BC, Bugenhagen S, Jacob HJ, Cowley AW., Jr Molecular networks in Dahl salt-sensitive hypertension based on transcriptome analysis of a panel of consomic rats. Physiol Genomics. 2008;34:54–64. doi: 10.1152/physiolgenomics.00031.2008. [DOI] [PubMed] [Google Scholar]
- 37.Yang C, Stingo FC, Ahn KW, Liu P, Vannucci M, Laud PW, Skelton M, O'Connor P, Kurth T, Ryan RP, Moreno C, Tsaih SW, Patone G, Hummel O, Jacob HJ, Liang M, Cowley AW., Jr Increased proliferative cells in the medullary thick ascending limb of the loop of Henle in the Dahl salt-sensitive rat. Hypertension. 2013;61:208–215. doi: 10.1161/HYPERTENSIONAHA.112.199380. [DOI] [PMC free article] [PubMed] [Google Scholar]
Associated Data
This section collects any data citations, data availability statements, or supplementary materials included in this article.


