

Abstract
Cross-sectional studies have shown regional differences in cortical thickness between healthy older adults and patients with Alzheimer’s disease (AD) or mild cognitive impairment (MCI). We now demonstrate that participants who subsequently develop cognitive impairment leading to a diagnosis of MCI or AD (n=25) experience greater cortical thinning in specific neuroanatomical regions compared to control participants who remained cognitively normal (n=96). Based on 8 years of annual MRI scans beginning an average of 11 years prior to onset of cognitive impairment, participants who developed cognitive impairment subsequent to the scanning period had greater longitudinal cortical thinning in the temporal poles and left medial temporal lobe compared to controls. No significant regional cortical thickness differences were found at baseline between the two study groups indicating that we are capturing a critical time when brain changes occur before behavioral manifestations of impairment are detectable. Our findings suggest that early events of the pathway that leads to cognitive impairment may involve the temporal lobe, and that this increased atrophy could be considered an early biomarker of neurodegeneration predictive of cognitive impairment years later.
Keywords: Alzheimer’s disease, cortical thinning, early detection, longitudinal, mild cognitive impairment
1.0 Introduction
Estimates indicate that over 13 million adults in the US alone will be diagnosed with Alzheimer’s disease (AD) by 2050. At least 70 million Americans older than age 65 will be at risk for developing AD, with an increasing burden for affected individuals, their families, and the health care system (Alzheimer’s Association, 2010; Hebert et al., 2003). Recent therapeutic intervention trials in AD patients have failed, possibly because interventions were started at a late stage of the disease when neurodegeneration was already irreversible (Callaway, 2012; Castellani and Perry, 2012). It has been suggested that future studies should target earlier stages of the disease. Thus, it is critical to define biomarkers of AD that could aid in the identification of individuals at increased risk of dementia at the earliest stages of the disease process.
The transition from cognitive health to impairment, including a clinical diagnosis of AD, is characterized by preclinical and prodromal stages of disease progression, with neuropathological changes beginning prior to any detectable symptom onset (Chételat et al., 2003; Jack et al., 2010; Jagust et al., 1996). During such pre-symptomatic stages of disease, neurodegeneration is one of a few predominant pathological changes and is measurable using structural MRI. While there is wide-spread atrophy associated with advancing age in the absence of cognitive impairment (Resnick et al., 2003; Salat et al., 2004), regional brain atrophy, especially in gray matter, is particularly accelerated in individuals who have developed MCI or AD (Driscoll et al., 2009). Moreover, pathological and MRI studies show that regions of the hippocampus and entorhinal cortex exhibit the earliest AD pathology associated with volume loss (H. Braak and E. Braak, 1991; Dickerson et al., 2001; Hyman et al., 1984; Jack et al., 1997). In fact, accelerated hippocampal and more widespread brain atrophy are considered supportive biomarkers in the recently revised criteria for MCI (Albert et al., 2011) and AD (McKhann et al., 2011).
Prior studies, including those from our group (Driscoll et al., 2009), have focused on differences in regional brain structure between cognitively healthy older adults and those who have been diagnosed with mild cognitive impairment or dementia. Few studies have investigated more subtle change in brain structure in the critical years prior to a dementia or MCI clinical diagnosis. Additionally, the majority of studies comparing cognitive healthy versus impaired older adults have been cross-sectional in design and therefore, their results are affected by the wide, unspecified, heterogeneity between individuals. Taking advantage of the many years of serial MRI and clinical follow-up data available from the Baltimore Longitudinal Study of Aging (BLSA), we are able to investigate changes in cortical thickness that occur several years prior to onset of cognitive impairment. Longitudinal studies may yield greater sensitivity in identifying subtle changes associated with incipient disease that are otherwise not dissociable in cross-sectional samples.
In this present study, we used serial MRI scans from the BLSA to investigate rates of cortical thinning prior to the onset of cognitive. We compared two groups of participants; one group developed cognitive impairment that eventually lead to MCI and/or AD while the other group maintained cognitive health. Both groups, however, were cognitively normal through the duration of the scanning period, which allowed us to investigate the effects of cortical atrophy on cognitive impairment in the years prior to onset of cognitive decline.
2.0 Materials and methods
2.1 Participants
Data in this study were obtained from the neuroimaging substudy of the BLSA (Resnick, 2000). Exclusion criteria for the BLSA neuroimaging substudy were the presence or history of neurological impairment, metastatic cancer, or severe cardiovascular disease (treated hypertension was not exclusionary) at the baseline neuroimaging evaluation. From 132 individuals with at least three MR evaluations, we excluded nine participants who had an onset of cognitive impairment prior to the collection of MR images or had a history of fluctuating cognitive performance and two participants who had confounding health conditions. Cognitive impairment was determined by consensus diagnosis using the Diagnostic and Statistical Manual of Mental Disorders Third Edition, Revised (DSM-III-R) (1987) criteria for dementia, and the National Institute of Neurological and Communication Disorders and Stroke-Alzheimer’s Disease and Related Disorders Association criteria (McKhann et al., 1984), using neuropsychological diagnostic tests and clinical data. Case conference diagnosis of mild cognitive impairment was consistent with the Petersen criteria (Petersen, 2004) and was made when participants had either single domain cognitive impairment (usually memory), or cognitive impairment in multiple domains without significant functional loss in activities of daily living.
All scans collected after the onset of cognitive impairment were excluded from analysis, and thus, only scans that were acquired while participants were considered cognitively normal are included here. The final sample of 121 total participants was split into two groups, Cognitively Normal (CN) and Subsequently Impaired (SI). The CN group includes 96 participants who remain cognitively normal to-date, while the SI group consists of 25 participants who had an onset of cognitive impairment after the MRI scanning time frame. Both groups have an average of 8 years of MRI scan data, and the scans for the SI group begin an average of 11 years before the onset of cognitive impairment. To-date the SI group is comprised of 11 participants that have MCI and 14 that have progressed to a diagnosis of AD. The interval between baseline imaging and the onset of impairment did not differ significantly between the participants with MCI and those with an AD diagnosis (MCI=11.66 years, AD=10.77 years, p=0.52). Neuropsychological assessments and neuroimaging scans were collected annually. Demographic details are listed in Table 1 and a schematic of the study design is shown in Figure 1. The local Institutional Review Board approved the research protocol for this study, and written informed consent was obtained at each visit from all participants.
Table 1.
Participant Details
| Group | CN | SI | Total |
|---|---|---|---|
| n | 96 | 25 | 121 |
| Male/Female | 54/42 | 14/11 | 68/53 |
| Baseline Age (years) | 68.5 (7.4) | 73.4 (7.6) | 69.5 (7.7) |
| Mean number of scans per participant | 7.6 (2.2) | 8.0 (1.8) | 7.7 (2.1) |
| Mean yrs of scan data per participant | 8.2 (2.4) | 7.2 (2.3) | 8.0 (2.4) |
| Mean yrs from first visit to onset of Cog. Impairment | -- | 11.2 (3.4) | -- |
| MMSE at first scan | 28.9 (1.4) | 28.8 (1.3) | 28.9 (1.3) |
| Education (years) | 16.4 (2.7) | 16.2 (3.0) | 16.3 (2.7) |
| Hypertension (%) | 46.5 | 63.6 | 60.1 |
| Diabetes (%) | 10.1 | 13.6 | 12.9 |
| Hypothyroidism (%) | 7.1 | 9.1 | 8.7 |
| APOE 3/4 (%) | 19.2 | 23.1 | 22.3 |
| APOE 4/4 (%) | 7.7 | 4.2 | 5.0 |
Note. CN = participants who remain cognitively normal over follow-up, SI = participants subsequently diagnosed with cognitive impairment.
Standard deviation shown in parentheses where applicable.
Figure 1.
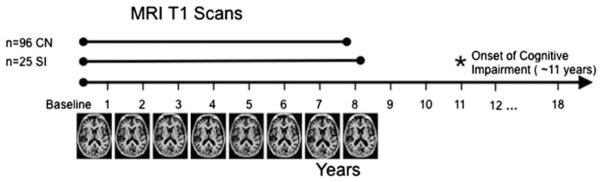
Schematic of study design.
Data were used from the Baltimore Longitudinal Study of Aging, where participants are followed annually for MRI scans, clinical and cognitive testing. The BLSA is currently in it’s 18th year of data collection. From the entire sample of participants, only those who had at least 3 MR evaluations, normal cognitive performance at baseline, and no confounding health conditions were included. These participants were then split into two groups, based on their cognitive diagnosis. 96 participants have remained cognitively normal to date (CN group) and had an average of 7.6 scans per participant included. The other 25 participants have shown subsequent cognitive impairment resulting in a diagnosis of either MCI or AD (SI group). Only scans collected before the onset of cognitive impairment were used for this group, which was an average of 8.0 scans per participant. The subsequent cognitive impairment occurred an average of 11.2 years after the initial scan.
2.2 MR scanning parameters
MR scanning was performed on a GE Signa 1.5 Tesla scanner beginning in 1994, and the acquisition parameters were kept constant throughout the study. The current results are based on a high-resolution volumetric “spoiled grass” (SPGR) series (axial acquisition; repetition time = 35; echo time = 5; flip angle = 45; field of view = 24; matrix = 256 × 256; number of excitations = 1; voxel dimensions of 0.94 × 0.94 × 1.5 mm slice thickness).
2.3 MR image preprocessing and mixed model analysis
Cortical reconstruction and volumetric segmentation were performed with the Freesurfer image analysis suite (version 5.1; http://surfer.nmr.mgh.harvard.edu/). The technical details of these procedures are described in prior publications, briefly, this processing includes removal of non-brain tissue from volumetric T1 weighted images using a hybrid watershed/surface deformation procedure (Ségonne et al., 2004), automated Talairach transformation, segmentation of the subcortical white matter and deep gray matter volumetric structures (including hippocampus, amygdala, caudate, putamen, ventricles) (Fischl et al., 2002; 2004a), intensity normalization (Sled et al., 1998), tessellation of the gray matter-white matter boundary, automated topology correction (Fischl et al., 2001; Ségonne et al., 2007), and surface deformation following intensity gradients to estimate the gray/white and gray/cerebrospinal fluid borders at the location where the greatest shift in intensity defines the transition to the other tissue class (Dale et al., 1999; Dale and Sereno, 1993; Fischl and Dale, 2000). Once the cortical models are complete, a number of deformable procedures can be performed for further data processing and analysis including surface inflation (Fischl et al., 1999a), registration to a spherical atlas which utilizes individual cortical folding patterns to match cortical geometry across participants (Fischl et al., 1999b), and parcellation of the cerebral cortex into units based on gyral and sulcal structure (Desikan et al., 2006; Fischl et al., 2004b). This method uses both intensity and continuity information from the entire three dimensional MR volume in segmentation and deformation procedures to produce representations of cortical thickness, calculated as the closest distance from the gray/white boundary to the gray/CSF boundary at each vertex on the tessellated surface (Fischl and Dale, 2000). The maps are created using spatial intensity gradients across tissue classes and are therefore not simply reliant on absolute signal intensity. The maps produced are not restricted to the voxel resolution of the original data and thus are capable of detecting submillimeter differences between groups. Procedures for the measurement of cortical thickness have been validated against histological analysis (Rosas et al., 2002) and manual measurements (Kuperberg et al., 2003; Salat et al., 2004). Freesurfer morphometric procedures have been demonstrated to show good test-retest reliability across MRI scanner manufacturers and across scanner magnetic field strengths (Han et al., 2006; Reuter et al., 2012). For longitudinal analysis, to extract reliable volume and thickness estimates, images were automatically processed with the longitudinal stream in Freesurfer (Reuter et al., 2012). Specifically, an unbiased within-subject template space and image (Reuter and Fischl, 2011) is created using robust, inverse consistent registration (Reuter et al., 2010). Several processing steps, such as skull stripping, Talairach transforms, atlas registration as well as spherical surface maps and parcellations are then initialized with common information from the within-subject template, significantly increasing reliability and statistical power (Reuter et al., 2012). The resulting cortical thickness maps for each participant were smoothed along the surface with a 10mm full-width half-maximum kernel and transformed into a volume image in MNI space for statistical analysis.
Mixed model analysis of cortical thickness maps was implemented using R version 2.11.1 running the packages AnalyzeFMRI version 1.1-12 and lme4 version 0.999375-37. The following equation was applied to the brain imaging data to obtain voxel-wise estimates of group differences in baseline cortical thickness and longitudinal cortical thickness changes:
| (Equation 1) |
The above model was applied to each voxel, with yij being the thickness value of that voxel for the ith participant on the jth follow-up test visit. Age indicates participants’ mean-centered baseline age at the first neuroimaging visit. Sex was coded as −0.5 for female and 0.5 for male. Group was coded as 0 for normal and 1 for cognitive impairment. Interval was defined as the longitudinal predictor coded as the time (yr) from baseline age (1st interval is 0). β denotes fixed effects estimates, b denotes subject specific random effects estimates, and ε is the residual error. Age and sex were additional covariates. Statistical significance of β3 in Eq. 1 indicates a main effect of subsequent cognitive impairment on baseline cortical thickness, and significance of β7 indicates differences in longitudinal cortical thickness change between normal participants and those with subsequent cognitive impairment. Statistical significance of β4 indicates main effect of rates of cortical thinning for the CN group (coded as 0). Whole-brain statistical contrast t-maps of the effect of cognitive impairment as well as its interaction with interval were generated.
3.0 Results
3.1 Cortical thinning rates for Cognitively Normal (CN) participants
To investigate the rates of change in cortical thinning across the entire cortex, we first examined the rates of cortical thinning, adjusted for baseline age and sex, for the CN group alone, using the β4 term from Eq 1. The resulting beta value map is shown in Figure 2a, and depicts the local rates of cortical thinning per year for the CN participants. Overall, it can be seen that there was widespread cortical thinning, regardless of baseline age, throughout much of the frontal, temporal and parietal lobes. The majority of these regions are getting thinner at rates between 0.005 and 0.01 mm per year. The regions showing the greatest rates of thinning bilaterally include the precentral gyrus and medial portions of the superior frontal gyrus, which are thinning at rates close to 0.04 mm per year.
Figure 2.

Differential rates of cortical thinning.
Whole brain analyses were conducted to determine the rates of cortical thinning in both CN and SI groups. The top two panels depict the actual rate of annual thinning as determined from Equation 1, adjusted for baseline age and sex of participants. The resulting maps have been thresholded to display values between 0.01 and 0.04 mm per year. The bottom panel depicts the regions where rates of cortical thinning are significantly different between the two groups. The resulting t-values have been thresholded to corresponding significant p-values between 0.01 and 0.00005. Panel a: Rates of cortical thinning, in mm per year, are shown for the CN group. Widespread cortical thinning can be seen throughout the frontal, parietal and temporal lobes with rates of 0.05–0.01 mm lost per year (shown in darker blue). The biggest changes are seen along the precentral gyrus, with rates equivalent to about 0.04 mm lost per year (shown in cyan). Panel b: Shows the rate of cortical thinning for the SI group. For this group the biggest changes are seen along the precentral gyrus and superior temporal gyrus with rates equivalent to about 0.04 mm lost per year (shown in cyan).
Panel c: Shows the significant differences in the annual rates of cortical thinning for the SI group compared to the CN group. The biggest differences in the rates are seen along the parahippocampal gyrus and temporal pole, showing that the SI group is thinning at a rate about a 0.01 mm per year faster than the CN group.
3.2 Cortical thinning rates for Subsequently Impaired (SI) participants
Equation 1 was applied with reverse coding (CN was coded as 1 and SI as 0) to obtain the rates of cortical thinning for the SI group, using term β4 in Eq 1. Figure 2b shows the beta maps for rates of cortical thinning per year for the SI group. As with the CN group, there is widespread cortical thinning observed for the SI group throughout the frontal, parietal and temporal lobes, showing rates between 0.005 and 0.01 mm per year of atrophy. The regions showing the greatest rates of cortical thinning bilaterally include the precentral gyrus, medial portions of the superior frontal gyrus, and superior temporal gyrus, with almost four fold steeper loss per year (0.04 mm/year) of the cortical gray matter compared to any other cortical region.
3.3 Greater cortical thinning in individuals with later cognitive impairment
An initial exploration of the differences in demographics between the two groups indicated that the SI group was slightly older than the CN group, and also has a higher prevalence of hypertension. An analysis of differences in cortical thickness at baseline (β3 in Equation 1) showed no significant differences between the two groups. Likewise, there were no significant differences in the Mini-Mental State Examination (MMSE) score, consistent with similar mental status across groups at initial imaging evaluation.
The rates of cortical thinning over the course of the 8 years of MRI scans were compared between the CN and SI groups. Regions that show differential rates of cortical thinning as a function of subsequent cognitive status (represented by β7 in Equation 1) are shown in Figure 2c. The blue regions indicate areas where the annual rate of cortical thinning is greater for the SI group compared to the CN group by about 0.01 mm per year and represent t-values thresholded to the equivalent of p-values between 0.01 and 0.00005 (shown in Figure 2c, summarized in Table 2). These results indicate the temporal lobes as a primary region for increased atrophy in the SI group, specifically throughout the extent of the left parahippocampal gyrus. While the right parahippocampal gyrus does not meet the significance threshold used in these analyses, we do find subthreshold increased cortical thinning in the SI group, which could potentially reach significance in a larger sample. Some regions of the left and right lateral temporal lobes also display greater cortical thinning for the SI compared with CN group. Of note, the right insula also appears to show significant differences in cortical thinning rate between the two groups. This result is not present in the left hemisphere.
Table 2.
Regions with significantly greater cortical thinning for cognitively impaired participants compared to cognitively normal participants
| Structure | Hemisphere | Peak Talairach Coordinate | Peak t-value | Cluster Size (mm2) |
|---|---|---|---|---|
| Parahippocampal gyrus | LH medial | −22.3 −23.3 −20.2 | −3.994*** | 2320.3 |
| Superior Temporal sulcus | LH lateral | −52.6 −50.3 5.8 | −3.432** | 308.2 |
| Inferior Parietal | LH lateral | −39.4 −60.7 21.2 | −3.505** | 246.59 |
| Fusiform gyrus | LH inferior | −41.4 −42.7 −11.8 | −3.487** | 152.42 |
| Superior Temporal gyrus | LH lateral | −49.8 −9.8 −12.0 | −3.106* | 149.23 |
| Insula | RH lateral | 36.7 1.8 0.5 | −4.31*** | 1688.8 |
| Inferior Temporal gyrus | RH inferior | 50.1 −40.2 −15.7 | −3.044* | 326.47 |
| Superior Temporal gyrus | RH lateral | 40.4 −3.7 −16.6 | −4.54*** | 311.1 |
| Parahippocampal gyrus | RH medial | 32.7 −42.3 −4.2 | −3.16* | 218.4 |
p < 0.0001
p < 0.001
p < 0.005
While these results take into account the effects of sex and age as covariates in the model, the relationship between cortical thinning and sex and age were explored individually as well. Regions that were significantly affected by baseline age were primarily in the prefrontal and anterior cingulate cortices, while regions affected by sex were in the prefrontal, posterior cingulate, and precuneus regions. None of these regions overlapped with the results presented above, which are due to subsequent diagnosis. Additionally, a separate model was run that included age, sex, and hypertension status as covariates, to account for any contributions from the greater prevalence of hypertension in the SI group. The addition of hypertension to the model did not change the results, and so it has been left out from the final model as described in Equation 1.
4.0 Discussion
The primary goal of this study was to determine whether there are differential rates of longitudinal cortical thinning in aging people who maintain normal cognition (CN) compared to those who subsequently develop cognitive impairment (SI). We found that while widespread thinning is seen with advancing age, the rate of atrophy is greater in temporal lobe regions, primarily the left parahippocampal gyrus and the lateral temporal lobes bilaterally, for those individuals who go on to exhibit cognitive impairment. These findings extend prior work from our laboratory comparing rates of atrophy in normal controls and individuals who developed MCI over the course of the imaging assessments (Driscoll et al., 2009). Our prior results indicated that the rate of atrophy, as measured by volume loss, is increased in MCI compared to normal controls, with most pronounced atrophy in temporal gray matter, hippocampus, and orbitofrontal cortex. Consistent with this finding, comparisons of regional atrophy over a one-year follow-up saw greater atrophy within the medial temporal cortex in the earlier stages of MCI to AD progression (McDonald et al., 2009). The medial temporal regions showed greater atrophy rates when comparing normal controls to a group of MCI patients with mild impairment. Later in the disease progression, when comparing a group of MCI patients with moderate impairment to a group of patients with AD, increases in atrophy rates were found to be in prefrontal, posterior temporal and cingulate regions. In the current work, there is no detectable difference in cortical thickness between the CN and SI groups at the initial scan, an average of 11 years prior to cognitive impairment. However, over the next 8-year period greater cortical thinning in the temporal lobe is detectable prior to disease onset in individuals who later develop cognitive impairment. This suggests that increases in atrophy rates may begin well before clinical disease progression is noticed, and has important implications about the onset of detectable structural changes related to dementia. Early identification of these changes is important for early detection of disease onset and intervention.
Cortical thinning during normal aging has been studied previously (Salat et al., 2004; Thambisetty et al., 2010), and our sample also shows that there are widespread changes in cortical thickness associated with aging, as well as longitudinal changes in the rate of cortical thinning. Differences in cortical thickness have been investigated through cross-sectional studies and a pattern of regions associated with MCI and AD has been identified to include temporal, parietal, and frontal regions (Bakkour et al., 2009; Dickerson et al., 2009; 2012). The severity of atrophy has been correlated with cognitive impairment severity: patients with AD have the thinnest cortical gray matter measures, patients with MCI and mild AD exhibit intermediate measures, and normal controls show the greatest cortical thickness. Consistent with our findings, Singh et al. (2006) demonstrated cortical thickness differences of the medial and lateral temporal lobes associated with disease progression. Their findings indicate thinner cortex in the medial regions when comparing MCI patients with control participants, whereas thinner lateral temporal regions are seen only when comparing AD to MCI patients, both with more pronounced differences in the left compared with right hemisphere. A longitudinal exploration of cortical atrophy over 2 years also saw increases in atrophy rates for patients with AD within the temporal lobes, of up to 2.5% greater thinning per year as compared to a group of healthy older adults (Fjell et al., 2009). It is evident that the temporal lobes are most vulnerable to cortical thinning early in the progression of the AD pathological process. Moreover, through longitudinal analysis, our study shows that the rate of thinning in these regions increases in conjunction with the disease process and is measurable years before any detectable cognitive impairment.
The BLSA sample is a highly educated community dwelling sample, which limits the generality of our findings. However, the incidence of AD in the BLSA (Kawas et al., 2000) and the rates of brain changes (Resnick et al., 2003) are comparable to other samples. A strength of our study is that our BLSA participants have been followed for a number of years subsequent to scanning, confirming that the CN group remains cognitively normal for years after MRI collection. Additionally, the SI group consists of normal participants with all scans prior to the onset of cognitive symptoms. All of the participants in this study were classified as normal at all of the scanning time points. The observed differential rates of atrophy for the two groups not only indicate that cortical thinning occurs many years prior to disease onset but also suggest that there may be considerable disease-related variability in morphometric measures, which may obscure potentially important findings when looking at cognitively normal participants without longitudinal follow-up. Cross-sectional studies of “normal” variation may include anatomic differences due to preclinical disease, and cross-sectional comparisons of cognitively normal and impaired groups may underestimate disease-related anatomic differences.
In conclusion, our longitudinal findings indicate that differences in the rate of cortical thinning can be seen in the temporal lobe prior to a diagnosis of MCI or AD, using MRI scans beginning as long as 11 years prior to onset of cognitive impairment. Thus, rates of cortical thinning could be supplementary biomarkers of preclinical disease to be used in conjunction with other techniques to identify those individuals who may be on the path to AD, at an earlier stage where intervention may be possible.
Highlights.
Cortical thickness measures were examined yearly for an average of 8 years.
The group that subsequently developed cognitive impairment displayed greater rates of cortical atrophy.
The temporal lobes are the primary location of increased rates of cortical atrophy.
This indicates that changes in cortical thinning can be seen prior to clinical onset of AD symptoms.
Acknowledgments
This research was supported in part by the Intramural Research Program of the NIH, National Institute on Aging and by Research and Development Contract N01-AG-3-2124. We are grateful to the BLSA participants and staff for their dedication to these studies and the staff of the Johns Hopkins MRI facility for their assistance.
Footnotes
Disclosure Statement
The authors declare no competing interests.
Publisher's Disclaimer: This is a PDF file of an unedited manuscript that has been accepted for publication. As a service to our customers we are providing this early version of the manuscript. The manuscript will undergo copyediting, typesetting, and review of the resulting proof before it is published in its final citable form. Please note that during the production process errors may be discovered which could affect the content, and all legal disclaimers that apply to the journal pertain.
Contributor Information
Jennifer Pacheco, Email: joshuagoh@ntu.edu.tw.
Michael A. Kraut, Email: mkraut1@jhmi.edu.
Luigi Ferrucci, Email: FerrucciLu@grc.nia.nih.gov.
Susan M. Resnick, Email: resnicks@grc.nia.nih.gov.
References
- Albert MS, DeKosky ST, Dickson D, Dubois B, Feldman HH, Fox NC, Gamst A, Holtzman DM, Jagust WJ, Petersen RC, Snyder PJ, Carrillo MC, Thies B, Phelps CH. The diagnosis of mild cognitive impairment due to Alzheimer’s disease: Recommendations from the National Institute on Aging-Alzheimer’s Association workgroups on diagnostic guidelines for Alzheimer’s disease. 2011;7:270–279. doi: 10.1016/j.jalz.2011.03.008. [DOI] [PMC free article] [PubMed] [Google Scholar]
- Alzheimer’s Association. 2010 Alzheimer’s disease facts and figures. Alzheimer”s & dementia : the journal of the Alzheimer”s Association. 2010;6:158–194. doi: 10.1016/j.jalz.2010.01.009. [DOI] [PubMed] [Google Scholar]
- Association, A.P. Diagnostic and Statistical manual of mental disorders. 3. Washington, Washington, DC: 1987. [Google Scholar]
- Bakkour A, Morris JC, Dickerson BC. The cortical signature of prodromal AD: regional thinning predicts mild AD dementia. Neurology. 2009;72:1048–1055. doi: 10.1212/01.wnl.0000340981.97664.2f. [DOI] [PMC free article] [PubMed] [Google Scholar]
- Braak H, Braak E. Neuropathological stageing of Alzheimer-related changes. Acta neuropathologica. 1991;82:239–259. doi: 10.1007/BF00308809. [DOI] [PubMed] [Google Scholar]
- Callaway E. Alzheimer’s drugs take a new tack. 2012;489:13–14. doi: 10.1038/489013a. [DOI] [PubMed] [Google Scholar]
- Castellani RJ, Perry G. Pathogenesis and Disease-modifying Therapy in Alzheimer’s Disease: The Flat Line of Progress. Archives of Medical Research. 2012;43:694–698. doi: 10.1016/j.arcmed.2012.09.009. [DOI] [PubMed] [Google Scholar]
- Chételat G, Desgranges B, de la Sayette V, Viader F, Eustache F, Baron J-C. Mild cognitive impairment: Can FDG-PET predict who is to rapidly convert to Alzheimer’s disease? Neurology. 2003;60:1374–1377. doi: 10.1212/01.wnl.0000055847.17752.e6. [DOI] [PubMed] [Google Scholar]
- Dale AM, Fischl B, Sereno MI. Cortical surface-based analysis. I. Segmentation and surface reconstruction. NeuroImage. 1999;9:179–194. doi: 10.1006/nimg.1998.0395. [DOI] [PubMed] [Google Scholar]
- Dale AM, Sereno MI. Improved Localizadon of Cortical Activity by Combining EEG and MEG with MRI Cortical Surface Reconstruction: A Linear Approach. Journal of cognitive neuroscience. 1993;5:162–176. doi: 10.1162/jocn.1993.5.2.162. [DOI] [PubMed] [Google Scholar]
- Desikan RS, Ségonne F, Fischl B, Quinn BT, Dickerson BC, Blacker D, Buckner RL, Dale AM, Maguire RP, Hyman BT, Albert MS, Killiany RJ. An automated labeling system for subdividing the human cerebral cortex on MRI scans into gyral based regions of interest. NeuroImage. 2006;31:968–980. doi: 10.1016/j.neuroimage.2006.01.021. [DOI] [PubMed] [Google Scholar]
- Dickerson BC, Bakkour A, Salat DH, Feczko E, Pacheco J, Greve DN, Grodstein F, Wright CI, Blacker D, Rosas HD, Sperling RA, Atri A, Growdon JH, Hyman BT, Morris JC, Fischl B, Buckner RL. The cortical signature of Alzheimer’s disease: regionally specific cortical thinning relates to symptom severity in very mild to mild AD dementia and is detectable in asymptomatic amyloid-positive individuals. Cereb Cortex. 2009;19:497–510. doi: 10.1093/cercor/bhn113. [DOI] [PMC free article] [PubMed] [Google Scholar]
- Dickerson BC, Goncharova I, Sullivan MP, Forchetti C, Wilson RS, Bennett DA, Beckett LA, deToledo-Morrell L. MRI-derived entorhinal and hippocampal atrophy in incipient and very mild Alzheimer’s disease. Neurobiology of Aging. 2001;22:747–754. doi: 10.1016/s0197-4580(01)00271-8. [DOI] [PubMed] [Google Scholar]
- Dickerson BC, Wolk DA Alzheimer’s Disease Neuroimaging Initiative. MRI cortical thickness biomarker predicts AD-like CSF and cognitive decline in normal adults. Neurology. 2012;78:84–90. doi: 10.1212/WNL.0b013e31823efc6c. [DOI] [PMC free article] [PubMed] [Google Scholar]
- Driscoll I, Davatzikos C, An Y, Wu X, Shen D, Kraut M, Resnick SM. Longitudinal pattern of regional brain volume change differentiates normal aging from MCI. 2009;72:1906–1913. doi: 10.1212/WNL.0b013e3181a82634. [DOI] [PMC free article] [PubMed] [Google Scholar]
- Fischl B, Dale AM. Measuring the thickness of the human cerebral cortex from magnetic resonance images. Proc Natl Acad Sci USA. 2000;97:11050–11055. doi: 10.1073/pnas.200033797. [DOI] [PMC free article] [PubMed] [Google Scholar]
- Fischl B, Liu A, Dale AM. Automated manifold surgery: constructing geometrically accurate and topologically correct models of the human cerebral cortex. IEEE Trans Med Imaging. 2001;20:70–80. doi: 10.1109/42.906426. [DOI] [PubMed] [Google Scholar]
- Fischl B, Salat DH, Busa E, Albert M, Dieterich M, Haselgrove C, van der Kouwe A, Killiany R, Kennedy D, Klaveness S, Montillo A, Makris N, Rosen B, Dale AM. Whole brain segmentation: automated labeling of neuroanatomical structures in the human brain. Neuron. 2002;33:341–355. doi: 10.1016/s0896-6273(02)00569-x. [DOI] [PubMed] [Google Scholar]
- Fischl B, Salat DH, van der Kouwe AJW, Makris N, Ségonne F, Quinn BT, Dale AM. Sequence-independent segmentation of magnetic resonance images. NeuroImage. 2004a;23:S69–S84. doi: 10.1016/j.neuroimage.2004.07.016. [DOI] [PubMed] [Google Scholar]
- Fischl B, Sereno MI, Dale AM. Cortical surface-based analysis. II: Inflation, flattening, and a surface-based coordinate system. NeuroImage. 1999a;9:195–207. doi: 10.1006/nimg.1998.0396. [DOI] [PubMed] [Google Scholar]
- Fischl B, Sereno MI, Tootell RB, Dale AM. High-resolution intersubject averaging and a coordinate system for the cortical surface. Hum Brain Mapp. 1999b;8:272–284. doi: 10.1002/(SICI)1097-0193(1999)8:4<272::AID-HBM10>3.0.CO;2-4. [DOI] [PMC free article] [PubMed] [Google Scholar]
- Fischl B, van der Kouwe A, Destrieux C, Halgren E, Ségonne F, Salat DH, Busa E, Seidman LJ, Goldstein J, Kennedy D, Caviness V, Makris N, Rosen B, Dale AM. Automatically parcellating the human cerebral cortex. Cereb Cortex. 2004b;14:11–22. doi: 10.1093/cercor/bhg087. [DOI] [PubMed] [Google Scholar]
- Fjell AM, Walhovd KB, Fennema-Notestine C, McEvoy LK, Hagler DJ, Holland D, Brewer JB, Dale AM. One-year brain atrophy evident in healthy aging. J Neurosci. 2009;29:15223–15231. doi: 10.1523/JNEUROSCI.3252-09.2009. [DOI] [PMC free article] [PubMed] [Google Scholar]
- Han X, Jovicich J, Salat D, van der Kouwe A, Quinn B, Czanner S, Busa E, Pacheco J, Albert M, Killiany R, Maguire P, Rosas D, Makris N, Dale A, Dickerson B, Fischl B. Reliability of MRI-derived measurements of human cerebral cortical thickness: the effects of field strength, scanner upgrade and manufacturer. NeuroImage. 2006;32:180–194. doi: 10.1016/j.neuroimage.2006.02.051. [DOI] [PubMed] [Google Scholar]
- Hebert LE, Scherr PA, Bienias JL, Bennett DA, Evans DA. Alzheimer disease in the US population: prevalence estimates using the 2000 census. Archives of Neurology. 2003;60:1119–1122. doi: 10.1001/archneur.60.8.1119. [DOI] [PubMed] [Google Scholar]
- Hyman BT, Van Hoesen GW, Damasio AR, Barnes CL. Alzheimer’s disease: cell-specific pathology isolates the hippocampal formation. Science. 1984;225:1168–1170. doi: 10.1126/science.6474172. [DOI] [PubMed] [Google Scholar]
- Jack CR, Knopman DS, Jagust WJ, Shaw LM, Aisen PS, Weiner MW, Petersen RC, Trojanowski JQ. Hypothetical model of dynamic biomarkers of the Alzheimer’s pathological cascade. Lancet neurology. 2010;9:119–128. doi: 10.1016/S1474-4422(09)70299-6. [DOI] [PMC free article] [PubMed] [Google Scholar]
- Jack CR, Petersen RC, Xu YC, Waring SC, O’Brien PC, Tangalos EG, Smith GE, Ivnik RJ, Kokmen E. Medial temporal atrophy on MRI in normal aging and very mild Alzheimer’s disease. Neurology. 1997;49:786–794. doi: 10.1212/WNL.49.3.786. [DOI] [PMC free article] [PubMed] [Google Scholar]
- Jagust WJ, Haan MN, Eberling JL, Wolfe N, Reed BR. Functional imaging predicts cognitive decline in Alzheimer’s disease. Journal of neuroimaging : official journal of the American Society of Neuroimaging. 1996;6:156–160. doi: 10.1111/jon199663156. [DOI] [PubMed] [Google Scholar]
- Kawas C, Gray S, Brookmeyer R, Fozard J, Zonderman AB. Age-specific incidence rates of Alzheimer’s disease. The Baltimore Longitudinal Study of Aging. 2000 doi: 10.1212/wnl.54.11.2072. [DOI] [PubMed] [Google Scholar]
- Kuperberg GR, Broome MR, McGuire PK, David AS, Eddy M, Ozawa F, Goff D, West WC, Williams SCR, van der Kouwe AJW, Salat DH, Dale AM, Fischl B. Regionally localized thinning of the cerebral cortex in schizophrenia. Arch Gen Psychiatry. 2003;60:878–888. doi: 10.1001/archpsyc.60.9.878. [DOI] [PubMed] [Google Scholar]
- McDonald CR, McEvoy LK, Gharapetian L, Fennema-Notestine C, Hagler DJ, Holland D, Koyama A, Brewer JB, Dale AM Alzheimer’s Disease Neuroimaging Initiative. Regional rates of neocortical atrophy from normal aging to early Alzheimer disease. Neurology. 2009;73:457–465. doi: 10.1212/WNL.0b013e3181b16431. [DOI] [PMC free article] [PubMed] [Google Scholar]
- McKhann G, Drachman D, Folstein M, Katzman R, Price D, Stadlan EM. Clinical diagnosis of Alzheimer”s disease: Report of the NINCDS-ADRDA Work Group* under the auspices of Department of Health and Human Services Task Force on Alzheimer”s Disease. Neurology. 1984;34:939–939. doi: 10.1212/WNL.34.7.939. [DOI] [PubMed] [Google Scholar]
- McKhann GM, Knopman DS, Chertkow H, Hyman BT, Jack CR, Jr, Kawas CH, Klunk WE, Koroshetz WJ, Manly JJ, Mayeux R, Mohs RC, Morris JC, Rossor MN, Scheltens P, Carrillo MC, Thies B, Weintraub S, Phelps CH. The diagnosis of dementia due to Alzheimer’s disease: Recommendations from the National Institute on Aging-Alzheimer’s Association workgroups on diagnostic guidelines for Alzheimer’s disease. 2011;7:263–269. doi: 10.1016/j.jalz.2011.03.005. [DOI] [PMC free article] [PubMed] [Google Scholar]
- Petersen RC. Mild cognitive impairment as a diagnostic entity. Journal of Internal Medicine. 2004;256:183–194. doi: 10.1111/j.1365-2796.2004.01388.x. [DOI] [PubMed] [Google Scholar]
- Resnick SM. One-year Age Changes in MRI Brain Volumes in Older Adults. 2000;10:464–472. doi: 10.1093/cercor/10.5.464. [DOI] [PubMed] [Google Scholar]
- Resnick SM, Pham DL, Kraut MA, Zonderman AB, Davatzikos C. Longitudinal magnetic resonance imaging studies of older adults: a shrinking brain. J Neurosci. 2003;23:3295–3301. doi: 10.1523/JNEUROSCI.23-08-03295.2003. [DOI] [PMC free article] [PubMed] [Google Scholar]
- Reuter M, Fischl B. Avoiding asymmetry-induced bias in longitudinal image processing. NeuroImage. 2011;57:19–21. doi: 10.1016/j.neuroimage.2011.02.076. [DOI] [PMC free article] [PubMed] [Google Scholar]
- Reuter M, Rosas HD, Fischl B. Highly accurate inverse consistent registration: a robust approach. NeuroImage. 2010;53:1181–1196. doi: 10.1016/j.neuroimage.2010.07.020. [DOI] [PMC free article] [PubMed] [Google Scholar]
- Reuter M, Schmansky NJ, Rosas HD, Fischl B. Within-subject template estimation for unbiased longitudinal image analysis. NeuroImage. 2012;61:1402–1418. doi: 10.1016/j.neuroimage.2012.02.084. [DOI] [PMC free article] [PubMed] [Google Scholar]
- Rosas HD, Liu AK, Hersch S, Glessner M, Ferrante RJ, Salat DH, van der Kouwe A, Jenkins BG, Dale AM, Fischl B. Regional and progressive thinning of the cortical ribbon in Huntington’s disease. Neurology. 2002;58:695–701. doi: 10.1212/wnl.58.5.695. [DOI] [PubMed] [Google Scholar]
- Salat DH, Buckner RL, Snyder AZ, Greve DN, Desikan RSR, Busa E, Morris JC, Dale AM, Fischl B. Thinning of the cerebral cortex in aging. Cereb Cortex. 2004;14:721–730. doi: 10.1093/cercor/bhh032. [DOI] [PubMed] [Google Scholar]
- Ségonne F, Dale AM, Busa E, Glessner M, Salat D. A hybrid approach to the skull stripping problem in MRI. NeuroImage. 2004 doi: 10.1016/j.neuroimage.2004.03.032. [DOI] [PubMed] [Google Scholar]
- Ségonne F, Pacheco J, Fischl B. Geometrically accurate topology-correction of cortical surfaces using nonseparating loops. Medical Imaging. 2007 doi: 10.1109/TMI.2006.887364. [DOI] [PubMed] [Google Scholar]
- Singh V, Chertkow H, Lerch JP, Evans AC, Dorr AE, Kabani NJ. Spatial patterns of cortical thinning in mild cognitive impairment and Alzheimer’s disease. 2006;129:2885–2893. doi: 10.1093/brain/awl256. [DOI] [PubMed] [Google Scholar]
- Thambisetty M, Wan J, Carass A, An Y, Prince JL, Resnick SM. Longitudinal changes in cortical thickness associated with normal aging. NeuroImage. 2010;52:1215–1223. doi: 10.1016/j.neuroimage.2010.04.258. [DOI] [PMC free article] [PubMed] [Google Scholar]