

Abstract
GABAergic synaptic transmission plays an important role in resetting and synchronizing circadian rhythms in the suprachiasmatic nucleus (SCN). Although the circadian modulation of intrinsic membrane currents and biochemical signaling have been examined in the SCN, the modulation of specific synaptic pathways within the SCN is unexplored. In addition, little is known about the functional properties of these pathways, including which ones involve GABAA receptors (GABAA-Rs). In brain slices obtained from mice, we examined synaptic responses originating from the SCN neurons expressing vasoactive intestinal peptide (VIP+ neurons). Focusing on the local projection within the ventromedial SCN, we found that VIP+ afferents provided input onto 49% of neurons with a preference for VIP-negative (VIP−) neurons. Responses were mediated by GABAA-Rs. The projection was sparsely connected and preferentially targeted a subset of SCN neurons unrelated to postsynaptic VIP expression. For most aspects of VIP+ network output, there was no circadian regulation. Excitability and spontaneous firing of the presynaptic VIP+ neurons were unchanged between day and night, and their network connectivity and synaptic function up through the evoked synaptic conductance were also unchanged. On the other hand, VIP+ input onto VIP− neurons became less inhibitory at night suggesting a postsynaptic alteration in the coupling of GABAA-R conductances to action potential firing. These data suggest that components of the VIP network and its synaptic output up through GABAA-R opening are invariant during the circadian cycle, but the effect on action potential firing is modulated by postsynaptic processes occurring after GABAA-R channel opening.
Keywords: circadian, GABA, network, SCN, synapse, VIP
Introduction
The suprachiasmatic nucleus (SCN) acts as a master pacemaker for regulating circadian rhythms in mammals (Welsh et al., 2010; Mohawk and Takahashi, 2011). Through intercellular coupling mechanisms of its heterogeneous population of neurons, the SCN maintains a uniform and robust molecular circadian rhythm and effectively adapts to external light changes (Hogenesch and Herzog, 2011; Maywood et al., 2011; Mohawk and Takahashi, 2011; Hong et al., 2012).
One coupling mechanism is synaptic communication through GABAA receptors (GABAA-Rs) which is the predominant type of ionotropic receptor mediating intra-SCN communication (Kim and Dudek, 1992; Moore and Speh, 1993; Jiang et al., 1997; Strecker et al., 1997; Castel and Morris, 2000; Itri and Colwell, 2003; Belenky et al., 2008). GABAergic transmission in the SCN is thought to play a critical role in resetting and modulating circadian synchrony among these neurons (Liu and Reppert, 2000; Albus et al., 2005; Han et al., 2012; Evans et al., 2013; Freeman et al., 2013). To understand how this is accomplished, it is first necessary to determine which SCN neuron subtypes form functional GABAergic synapses onto other SCN neurons and determine the connectivity design of these subtype-specific networks.
Vasoactive intestinal peptide-expressing (VIP+) SCN neurons play a key role in regulating the circadian cycle. They receive direct glutamatergic input from the retina and relay ambient light information to neurons in the SCN and other brain regions. VIP+ neurons release VIP which is critical for regulating the circadian cycle and its synchrony among SCN neurons (Harmar et al., 2002; Aton et al., 2005; Brancaccio et al., 2013). Ultrastructural data suggest that VIP+ neurons corelease VIP and GABA at their synapses (Castel and Morris, 2000), but functional GABAA-R-mediated transmission from VIP+ neurons has not been demonstrated. Moreover, it is unknown whether VIP+ input has any physiological effect on the firing of target neurons. Therefore, it is unclear whether VIP+ neurons are even able to participate in the regulation of circadian rhythms through GABAA-Rs. Moreover, determining the GABAergic connectivity structure of the VIP+ network would provide clues as to how they might modulate the circadian cycle.
In the SCN, GABAergic transmission switches between being excitatory and inhibitory depending on circadian phase (Wagner et al., 1997; De Jeu and Pennartz, 2002; Choi et al., 2008). This switch is due to changes in the driving force for Cl−. However, a full understanding of the circadian regulation of GABAergic transmission is still incomplete because Cl− driving force is only one component of synaptic input provided by a particular pathway. Other important components include the firing properties of the presynaptic neurons, the connectivity design, and the strength of transmission. Circadian regulation of these other components would also critically impact SCN function.
We used optical stimulation to selectively stimulate VIP+ neurons and record synaptic responses in ventromedial SCN neurons. We find that the VIP+ projection evokes functional GABAergic responses, is sparse in its connectivity, involves preferred targeting of particular “responsive” neurons, and is only modulated by the circadian cycle via postsynaptic mechanisms coupling GABAA-R channel opening to action potential firing.
Materials and Methods
Mice.
VIP-IRES-Cre knock-in mice express Cre-recombinase (Cre) in neurons expressing VIP which was kindly provided by Dr Z. J. Huang (Cold Spring Harbor Laboratory, Cold Spring Harbor, NY 11724; Taniguchi et al., 2011). Ai27 and Ai32 mice express channelrhodopsin 2 (ChR2) in a Cre-dependent manner (Madisen et al., 2012). Both lines express the H134R mutant of ChR2 which is fused to either tdTomato (Ai27, ChR2(H134R)-tdTomato) or EYFP (Ai32, ChR2(H134R)-EYFP). The VIP-IRES-Cre mouse was crossed to either ChR2 reporter mice to produce offspring that expressed ChR2 in VIP-expressing neurons in the SCN. Most data in this study were obtained by crossing the VIP-IRES-Cre and Ai32 mice, and both male and female offspring were used for experiments. The Ai27 line required ∼10× the laser power compared with Ai32 to perform experiments and stimulus localization was degraded when using the Ai27 line, which resulted in more diffuse, less precise response maps. This may have stemmed from increase light scattering at the higher laser power. Therefore, Ai27 mice were only adequate for determining the existence of an optically evoked PSC or for examining properties unrelated to optical excitation, but they were not adequate for analyzing PSC amplitudes, PSC maps, or action potential excitation profiles (Fig. 2C,D). When Ai27 mice were used, this is explicitly stated. All mice were bred and maintained under a 12 h light/dark cycle. There were two light/dark cycle mouse groups: lights on 7:00–19:00 h for the “day” dataset and lights on 19:00–7:00 h for the “night” dataset, and this enabled all experiments to be performed during the day. Mice were acclimated to a given cycle for at least 2 weeks before experiments. In Figure 10, we crossed AVP-IRES-Cre knock-in mice (provided by David P. Olson University of Michigan, Ann Arbor, Michigan, USA; Pei et al., 2014) with Ai27 mice. AVP-IRES-Cre mice express Cre-recombinase in neurons expressing arginine vasopressin (AVP). The accurate expression pattern of the AVP-IRES-Cre mouse has been confirmed in the paraventricular nucleus of the hypothalamus (Pei et al., 2014).
Figure 2.

No change in spontaneous firing or excitability spatial profiles for VIP+ neurons between day and night. A, Locations of VIP+ neuron somata that underwent cell-attached recordings. Day and night recordings are depicted in separate SCNs only for illustrative purposes. Gray marks the third ventricle (above) and optic chiasm (below). B, Spontaneous firing frequency is unchanged between day and night. C, The number of evoked action potentials as a function of laser power is plotted. For each cell, only the location where the highest number of action potentials was evoked was analyzed (the best location). The blue vertical bar indicates the standard 100 μW power used in most experiments. The dashed gray and black horizontal lines indicate the baseline signals for day and night, respectively, which are based on the spontaneous firing rates. D, Average excitability profiles during the day and night are plotted as color maps aligned to soma location for each neuron examined (Materials and Methods). The approximate map area in the averages is indicated in the anatomical map (left, light gray). White dashed vertical lines indicate the analysis column used in the two-dimensional graph (right) where each row of the analysis column was averaged and plotted as a function of vertical distance from the soma. No difference in the distribution or magnitude of evoked action potential number was observed between day and night. Baseline is indicated by the vertical dashed line.
Figure 10.

The AVP+ projection shares characteristics with the VIP+ projection. A, The population of responsive (Resp+) and unresponsive neurons (Resp−) overlapped in their locations in the medial SCN. B, An example of traces of PSCs evoked in an AVP− neuron after light activation of AVP+ afferents. These traces represent a subregion of a collected map. Responses at each stimulus location are plotted with individual traces (gray) and the average trace (black). C, A small subset of neurons displayed PSCs evoked from AVP+ input. D, E, Both evoked PSCs (D) and spontaneous PSCs (E) were mediated by GABAA-Rs as demonstrated by blockade with the antagonist, picrotoxin (100 μm). F, sPSC frequency and amplitude plotted and divided into groups of responsive and unresponsive neurons. Statistical significance is determined with a two-factor ANOVA followed by multiple comparisons. G, Evoked PSC amplitude at the location with the strongest response (best location) plotted as a function of sPSC amplitude. All sPSCs had >5 ms width at half-height as in Figure 8; *p < 0.05, **p < 0.01, ***p < 0.001.
Acute SCN slice preparation.
Male and female mice (P25–P35) were killed by cervical dislocation at ZT3–5 or ZT15–17, corresponding to the day and night groups, respectively. This procedure was approved by the Institutional Animal Care and Use Committee at UT Southwestern. For the night group, dissections were performed under dim red light conditions (Kodak LED safelight LED, 660 nm peak wavelength, 0.32 lux, 4 ft distance). Following procedures previously described (Patel et al., 2013), the brain was immediately removed and placed into ice-cold artificial CSF (ACSF). Acute coronal slices containing the SCN were cut at 200 μm thickness on a VT1000S vibratome (Leica) at 4°C in dissection buffer. Slices were then placed in storage chamber containing 36°C oxygenated ACSF for 30 min. For another 30 min, slices and storage chamber slowly cooled to room temperature (22°–23°C) and were then ready for transfer to a recording setup for electrophysiological recordings.
Electrophysiology.
All recordings were performed at room temperature (22°–24°C) in the ventromedial SCN. The ACSF perfusion rate over the slice was 2–3 ml/min. Recordings were performed at the day and night time points described in the slicing procedure above with recordings during the day corresponding to ZT4–12 and during the night, ZT16–22. Recordings were performed in the SCN of either hemisphere, and both VIP+ and VIP− neurons were generally recorded in the same hemisphere. Neurons near the slice surface were visualized at 40× power using an Olympus BX51WI with infrared differential interference optics. VIP+ neurons were identified based on their expression of a fluorescent marker (YFP for Ai32 line) and their response to 473 nm light due to their ChR2 expression. All other neurons were categorized as VIP−. All data were collected with a 10 kHz sampling rate and a 3 kHz Bessel filter.
Electrophysiology solutions.
ACSF contained the following (in mm): 126 NaCl, 3 KCl, 1.25 NaH2PO4, 2 MgSO4, 26 NaHCO3, 25 dextrose, and 2 CaCl2. All slices were prepared in a sucrose dissection buffer as follows (in mm): 75 sucrose, 87 NaCl, 3 KCl, 1.25 NaH2PO4, 7 MgSO4, 26 NaHCO3, 20 dextrose, and 0.5 CaCl2. All solutions were pH 7.4. ACSF and dissection buffer were saturated with 95% O2/5% CO2. Whole-cell recording pipettes (resistance 5–7 MΩ) contained a solution consisting of the following (mm): 79 K-gluconate, 44 KCl, 6 NaCl, 0.007 CaCl2, 10 HEPES, 0.1 EGTA, 4 ATP-Mg, 0.3 GTP-Tris, 14 phosphocreatine-Tris, 15 sucrose. This was adjusted to pH 7.25 and 290 mOsm. The junction potential was ∼6 mV and was not corrected. Cell-attached recordings had ACSF in the pipette.
Laser-scanning photostimulation of ChR2.
We used a laser-scanning photostimulation (LSPS) system previously described (Shepherd et al., 2003; Petreanu et al., 2007). A blue laser beam (473 nm; Crystal Laser) was aimed at different locations around a recorded neuron with mirrors and delivered through an air immersion objective (4×, 0.16 NA; UPlanApo, Olympus). The stimulus locations formed a two-dimensional grid (typically 8 × 8) with 50 μm linear spacing. Based on the excitation profile of VIP+:ChR2+ neurons (Fig. 2D) from the VIP:Ai32 line, this sampling was sufficient to excite all neurons with a location inside the grid. All data were collected from the VIP:Ai32 mice using a 2 ms, 100 μW laser pulse. The transient, local application of light activated ChR2, which induced inward currents, depolarization, and action potential firing in presynaptic VIP+ neurons. This probably occurred in both axon and somal compartments (Petreanu et al., 2007; Madisen et al., 2012). Postsynaptic currents evoked by this method were most likely from afferents originating from the SCN because there is currently no other known external VIP+ afferent input. Most data acquisition parameters were controlled with custom software written in Labview (National Instruments) by J.R.G. For every trace collected, a power reading of the laser pulse was also saved. The diameter of the laser beam applied to the submerged slice was ∼20 μm as defined by 1/e*maxPower. This was measured with a power meter and the incremental obstruction of the laser with a razor.
Detection and measurements of optically evoked PSCs in single neurons.
Whole-cell recordings with LSPS were performed. Voltage-clamp was applied at a holding potential of −60 mV where GABAergic PSCs were inward currents because the internal [Cl−] was high (details in Electrophysiology solutions) resulting in ∼−30 mV reversal potential for Cl− mediated currents. The average PSC amplitude at each location was measured in the 5–55 ms window after onset of a 2 ms, 100 μW laser pulse. From the average map obtained for a single neuron, we measured the amplitude at the stimulus location that evoked the largest, or “best,” response. If that was >1.5 SDs of the noise, the cell was considered responsive. Because postsynaptic VIP+ neurons had ChR2-mediated currents superimposed on the light-evoked synaptic responses, their amplitude may have been underestimated due to the decrease in input resistance caused by the ChR2-mediated conductance. Based on the average amplitude of these ChR2-mediated currents (40–50 pA), we estimate that the postsynaptic VIP+ neurons may have had ∼50% decrease in input resistance when synaptic responses occurred. This would be expected to decrease the amplitude of the response, and because of this, some responses may have become undetectable. Therefore, comparisons with VIP− neurons may artifactually result in smaller amplitudes in postsynaptic VIP+ neurons and smaller numbers of responsive VIP+ neurons. We address this in three ways: (1) we do not compare VIP− and VIP+ PSC amplitudes; (2) we perform voltage-clamp recordings to measure synaptic responses as PSCs which are more independent of input resistance alterations, although not completely due to voltage-clamp error in dendrites; and (3) the smallest best amplitude for both VIP+ and VIP− responsive neurons was 7 pA, which was well above the noise in the average maps suggesting a clear separation between PSC and noise. Therefore, the underestimation of VIP+ response percentage was unlikely, which enabled a comparison of percentage responsive neurons between VIP+ and VIP− neurons. All PSCs were action potential-dependent because application of tetrodotoxin (TTX; 1 μm) abolished PSCs at all locations up to 1 mW (n = 3).
“Successes” and “failures” refer to detected and undetected PSCs in individual traces. For action potential-independent PSCs in Figures 4B, 6C, and 6D, LSPS with 2 ms, 1 mW laser pulses were applied to induce ChR2-mediated depolarization in presynaptic terminals as previously described (Petreanu et al., 2009).
Figure 4.

Optically evoked responses are likely due to monosynaptic transmission originating from VIP+ neurons. A, The cumulative distribution of action potential latencies obtained from cell-attached recordings (Fig. 1) and the PSCs observed in VIP+ and VIP− neurons. Example traces from single cell-attached (top right) and whole-cell recording (bottom right) illustrate the offset between action potential peak and PSC onset. B, A map of action potential-independent PSCs obtained during action-potential blockade (TTX, 1 μm; 4-AP, 100 μm) from a VIP− neuron.
Figure 6.
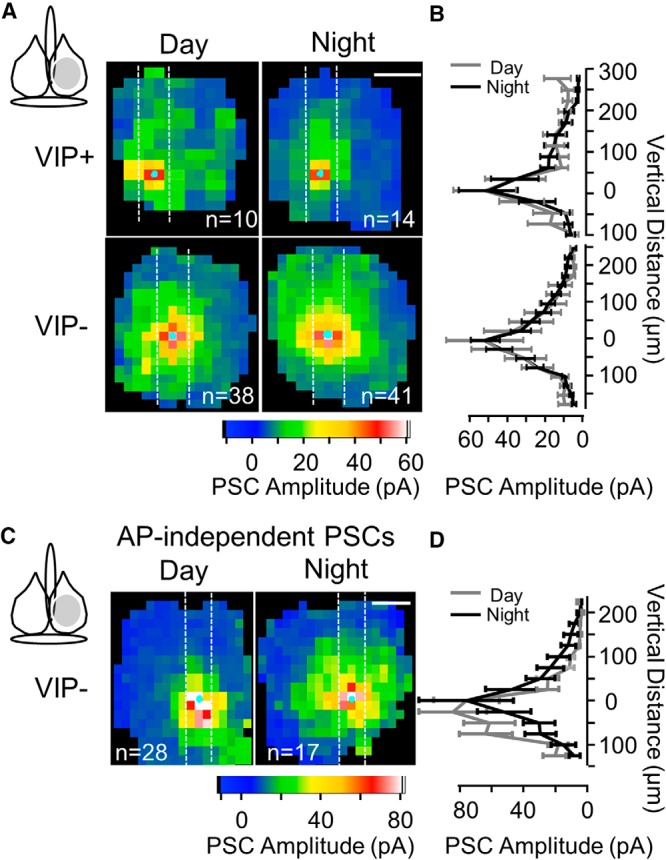
The amplitude and spatial pattern of PSCs originating from VIP+ neurons are invariant between day and night. A, Average color maps of PSC amplitude originating from VIP+ presynaptic neurons and measured in postsynaptic VIP+ and VIP− neurons during the day and at night. B, Each row of the analysis column (vertical white lines) from A was averaged and plotted as a function of vertical distance from the soma. C, Average color maps of action potential-independent PSC amplitude for VIP− neurons show no difference between day and night. D, Columnar quantification of C as described in B.
There were no dramatic changes in electrophysiological properties to confound our PSC measurements. No changes were detected in input resistance or the holding current to maintain a −60 mV clamp based on either cell type (VIP+ vs VIP−) or time of day (day vs night). The one exception was that VIP− neurons required more holding current during the day which is perhaps related to previous reports of higher membrane potential during the day (Jiang et al., 1997; Belle et al., 2009).
Action potential-independent PSCs and mPSCs.
We used a previously established method where laser application directly depolarizes the presynaptic terminals contacting the postsynaptic neuron (Petreanu et al., 2009) in an ACSF containing TTX (1 μm) to block action potentials and 4-AP (100 μm) to block a subpopulation of K+ channels, thereby promoting terminal depolarization. The latter was necessary to evoke PSCs. Depolarization of neuron compartments >25 μm from the presynaptic terminal do not evoke responses under these conditions (Petreanu et al., 2009). For miniature PSCs (mPSCs), only longer duration mPSCs (>5 ms) were analyzed to preferentially examine GABAergic mediated events (Itri et al., 2004).
Action potential firing measurements in single neurons.
Action potential firing was always measured with cell-attached recordings with a “loose” seal (<500 MΩ) to avoid altering the ionic and molecular composition of the cytoplasm (Perkins, 2006). For excitability profiles using LSPS (Figs. 1E, 2C,D), action potential number was counted in a 2–52 ms window after onset of a 2 ms laser pulse, and averaged across trials at each location. For the determination of excitation versus inhibition in Figure 9, a 5 ms, 300 mW/mm2 wide-field light pulse was applied to a 200 μm circle surrounding the neuron using a mercury lamp and narrow band blue filter. For each trial, the number of action potentials was counted in the 10–110 ms “response” window and −100 to −10 ms “baseline” window relative to LED onset. A paired t test was performed between the response and baseline action potential count to determine whether optical stimulation induced a response (≥50 trials). All traces were bandpass filtered between 30 and 300 Hz.
Figure 1.

An example of the excitability spatial profile of a VIP+:ChR2+ neuron obtained using LSPS. A, VIP-Cre mice were crossed to tdTomato reporter mice (Ai9; Madisen et al., 2010) to reveal the spatial profile of VIP-expressing neurons in the SCN ventral core. B, The slice image has marks for the laser stimulation positions (red dots) and the soma location (black circle). The recording pipette can be seen. Scale bar, 100 μm (same for all map images and color maps in subsequent figures). C, An example map of evoked action potentials. The traces represent the responses to laser application at each stimulus position (100 μW). Vertical blue bars mark the onset of laser application. The red asterisk marks the stimulus position closest to the soma. D, Examples of responsive (1) and unresponsive (2) locations in the map in C. E, The color map derived from C plotting the average number of action potentials evoked per trial at each location.
Figure 9.
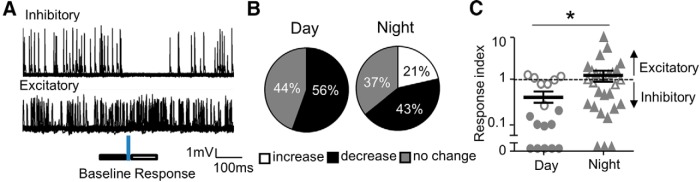
The final effect of VIP+ input is less inhibitory at night at postsynaptic VIP− neurons. A, Individual traces of a cell-attached recordings measuring action potential firing in two different VIP− neurons; one exhibiting an inhibitory response (top) and the other excitatory (bottom). Laser application is denoted by the blue vertical bar and the analysis windows are indicated by solid and empty horizontal bars. B, Day and night distributions of neurons responding to blue light with an increase, decrease, or no detectable change in firing. C, Plots of a response index which is the ratio of action potential number in the response window (A, empty bar) to that in the control window (A, solid bar; n = 18,28). Solid symbols represent neurons that displayed an index statistically different from 1. Indices >1 and <1 indicate excitation and inhibition, respectively; *p < 0.05.
Construction of a color map and average color map.
A color map obtained for an individual neuron was based on averaging at least five responses at each location. Only stimulation locations in the SCN were used for analysis, and any locations outside of the SCN were marked black in the color map. For average color maps, all individual maps were rotated, flipped, scaled in both x and y dimensions, and offset to a soma location equal to (0, 0) to best align the SCN boundaries to approximate a standard anatomical map of a right hemisphere SCN (Figs. 1B, 2D). The stimulus location number was virtually doubled (to 25 μm spacing) to better accommodate the staggered locations of the stimulus locations of the different maps. For each location in the average map, the sample in each individual map closest was included in the averaging. If an individual map did not have a location within 50 μm, no value from that individual map was used for that new grid location. Black in average color maps indicate insufficient sample number (<5) for that location. Differences between average maps was usually performed by picking a vertical “analysis column” centered around the soma location and for each individual map, compressing the data in that column into a single one-dimensional array of numbers by averaging each row of locations in the column. This array represents response strength at different vertical distances from the soma. Then the average and SE across all maps could be calculated and response strength plotted as a function of vertical distance from the soma (Figs. 2, 6). Then averages from day and night are compared using a two-factor ANOVA with repeated measures in the distance dimension.
Determining multiple inputs and estimates of multiple inputs.
To determine whether at least two presynaptic partners were involved in a map, we determined whether PSC successes in at least two locations had detectably different average amplitudes. A t test was performed between all locations with a detectable PSC, and a Bonferroni correction was applied based on this location number (≥6 trials per location). From this, we obtained the percentage of responsive neurons that had at least two inputs. We then estimated what this percentage should be based on random targeting of presynaptic 1100 VIP+ neurons (For the AVP+ pathway calculation, 2100 presynaptic AVP+ neurons; Welsh et al., 2010). We used a unique binomial distribution which was constrained by the percentage of unresponsive neurons in our actual data, Pr(X = 0 VIP+ neurons providing input), in the following binomial equation:
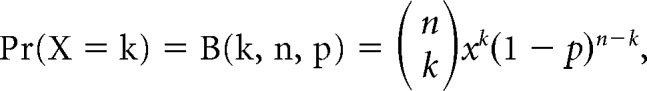 |
where k is the number of presynaptic VIP+ neurons providing input to a given SCN neuron and n = 1100 total possible presynaptic VIP+ neurons. This allowed us to solve for p, which represents the percentage chance that a given SCN neuron receives input from k presynaptic VIP+ neurons. After obtaining p, we calculated the percentage of neurons we would expect to have at least two presynaptic inputs from this binomial distribution by applying a modified version of the binomial equation as follows:
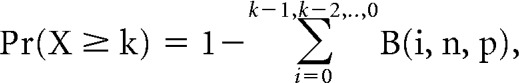 |
with k = 2. This was compared with the percentage with at least two inputs actually observed. The 95% confidence lower and upper limits for the predicted probability were derived by using the above procedure on the 95% confidence limits of the experimental data. The unresponsive probability from our data were the inverse of the responsive percentage graphed in Figure 5B.
Figure 5.

A fraction of neurons displayed functional input from VIP+ neurons. A, The population of responsive (Resp+) and unresponsive neurons (Resp−) overlapped in their locations in the ventral SCN. Postsynaptic neuron subtypes are depicted in separate SCNs for illustrative purposes. Positions are depicted for 90 and 65% of VIP+ and VIP− neurons examined. B, A higher proportion of VIP− neurons displayed optically evoked PSCs compared with VIP+ neurons. C, No difference in the proportion of responsive neurons was observed between day (D) and night (N). D, Responsive neurons typically displayed response successes of differing amplitude indicating multiple presynaptic VIP+ neurons providing input. E, Percentage of responsive neurons where at least two inputs could be detected. Light gray bars depict the expected percentage based on data in B. All error bars span the 95% CI. In All of panel E, the 99% CI is also depicted (light gray). ***p < 0.001.
Spontaneous and mPSCs.
We only analyzed events with a width at half-height >5 ms. The shorter duration spontaneous PSCs (sPSCs) removed are more typical of those mediated by AMPA-Rs (Itri et al., 2004). We find that ∼3% of sPSCs are removed from analysis with this criterion, and this small number is consistent with the 97% drop in sPSC frequency after application of the GABAA-R antagonist, picrotoxin (Fig. 8C). Analysis was performed using MiniAnalysis (Synaptosoft).
Figure 8.

Responsive neurons have higher frequencies of spontaneous PSCs. A, Individual traces in responsive and unresponsive neurons showing sPSCs occurring before and after laser onset. This is shown before (above) and after application of the GABAA-R antagonist, picrotoxin (100 μm, below), indicating that most synaptic events are GABAergic. B, Frequency of sPSCs with WHH > 5 ms before and after picrotoxin indicating mediation by GABAA-Rs. Experiments with 0 Hz frequency after picrotoxin application are indicated by the dashed line intersecting the x-axis. C, Frequency of all sPSCs before and after picrotoxin indicating that nonGABAergic events are also occurring. D, sPSC frequency and amplitude plotted and divided into groups of responsive and unresponsive neurons. White and black bars indicate day and night data, respectively. Gray bars indicate that day and night data are pooled. Cell numbers are indicated below each bar; * and # refer to responsive/unresponsive and VIP+/VIP− comparisons, respectively. Statistical significance is determined with a two-factor ANOVA followed by multiple-comparisons applied to each group of four bars separately. E, mPSC frequency plotted for responsive and unresponsive neurons (cell numbers: n = 10,8 and n = 13,5 for VIP+ and VIP−, respectively). F, Evoked PSC amplitude at the location with the strongest response (best location) plotted as a function of sIPSC amplitude. For panels B,D,E, and F, only sPSCs >5 ms WHH are examined (Materials and Methods and Results); *p < 0.05, **p < 0.01, ***p < 0.001. Twenty-five percent of data in D and F were obtained in Ai27 mice.
Statistics.
Most data in the text and figures are presented as mean ± SE unless stated otherwise. Percentages of responsive neurons were binomial data, were analyzed with χ2 methods, and presented as mean ± 95% confidence interval. The confidence interval was determined using the Clopper–Pearson method. Measurements were performed with Labview (National Instruments) using programs written by J.R.G. t Test, χ2, and two-factor ANOVA methods were performed with Prism (v 6; GraphPad Software).
Results
Light-induced excitability of VIP+ neurons is unchanged between day and night
We crossed VIP-IRES-Cre mice (Taniguchi et al., 2011) with ChR2(H134R)-YFP mice (Ai32 line) to produce mice whose VIP+ neurons expressed ChR2. These mice express Cre in just VIP-expressing neurons (Taniguchi et al., 2011) and have been used in a previous study to isolate the VIP+ population in the SCN (Brancaccio et al., 2013). Accordingly, we found that Cre-dependent recombination occurs in the same ventral SCN location as established for VIP expression (Fig. 1A; Abrahamson and Moore, 2001; Morin, 2013).
Before we examined VIP+ synaptic inputs onto SCN neurons, we needed to determine the optical excitation properties of the presynaptic VIP+ neurons because if these change between day and night, it would confound our comparison of day and night synaptic responses. We performed cell-attached recordings and used LSPS with a blue laser (Shepherd et al., 2003; Petreanu et al., 2007; Fig. 1B). The ACSF was identical to that used for examining synaptic responses (next section). Superimposed on spontaneous firing, action potentials could be reliably evoked at laser locations closest to the soma, and less reliably farther away (Fig. 1C,D). Latencies were shorter with positions closer to the soma. A spatial excitation profile could be derived from each neuron based on the average action potential number evoked by stimulation at each location (Fig. 1E, locations with a value <1 indicate that action potentials did not fire after every stimulation).
We compared both the spontaneous and evoked firing of VIP+ neurons between night and day. These neurons were primarily located in the ventromedial SCN (Fig. 2A; only Ai32 neurons shown). Spontaneous firing rates were similar to a previous report (Belle et al., 2009), and the rate did not differ between day and night (Fig. 2B; 3.6 ± 0.4 vs 3.6 ± 0.3 Hz; n = 27,19; day vs night; n = 7,8 obtained from Ai27 mice). There were also no detectable changes in firing frequency when plotted in a scatter plot as a function of circadian time (data not shown). Based on all the whole-cell recordings performed in this study, other intrinsic membrane properties were also unchanged between day and night. Specifically, input resistance and the holding current required to hold these VIP+ neurons at −60 mV were unchanged [input resistance (MΩ): 2427 ± 172 vs 2355 ± 175, n = 43, 33; holding current (pA): −19.3 ± 1.2 vs −17.8 ± 1.5, n = 54, 56; ordered by day, night].
We also examined light-evoked firing properties in the ChR2-expressing VIP neurons. By varying power in a subset of LSPS recordings, we determined 2 things. First, 25 μW was sufficient to reliably evoke an action potential in response to almost every laser pulse in at least one location (the best location; Fig. 2C). Second, there was no detectable difference in our ability to evoke action potentials at the day and night time windows (Fig. 2C). We decided on 100 μW as the standard experimental power to reliably evoke action potentials in VIP+ neurons both at the top and bottom surface of the slice. We determined that laser power was attenuated by ∼73% by the complete slice thickness (200 μm) resulting in a beam intensity of 27 μW light at the slice bottom; still enough to evoke an action potential.
With the 100 μW standard stimulation, the excitation profiles of VIP+ neurons were determined by spatial maps of evoked action potential number. An average map was obtained for day and night by aligning all single-neuron maps to their soma location (Fig. 2D). An analysis column (white dashes) was collapsed and averaged into a single vertical dimension for statistical comparison (Fig. 2D, far right; see Materials and Methods). The excitation profile did not differ between day and night, and action potentials could be reliably evoked by laser application in ∼125 μm radius surrounding the recorded neuron. Similar results were obtained when analysis was performed in the horizontal dimension. We also observed no differences in excitability between day and night when the Ai27 line was used (n = 5, 5; data not shown). In summary, both the evoked and spontaneous action potential data suggest that VIP+ neurons are equally excitable at the day and night time points.
Using whole-cell recordings, the spatial profile of the underlying ChR2-induced currents was determined, and again, there was no difference between day and night (n = 18, 24; day, night; data not shown). The spatial profile of these ChR2-mediated currents was narrower (∼50 μm radius around the soma) than that of the action potential distribution. This is most likely due to expression of ChR2 in axons and action potentials being optically induced in axons. Optically induced action potentials in the axon require similar light intensity and have a similar onset latency as action potentials induced in somatic and dendritic compartments (Petreanu et al., 2007; Madisen et al., 2012). Consistent with this, in whole-cell recordings in current-clamp mode, we occasionally observed action potentials that appeared antidromic because they were not preceded by any detectable prepotential (Petreanu et al., 2007; Madisen et al., 2012). Therefore, local laser stimulation not only excites VIP+ somas and proximal dendrites inside the illumination region, but outside the region as well through axon stimulation.
VIP+ neurons provide monosynaptic input to SCN neurons through GABAA receptors
We first tested the hypothesis that the VIP+ network provides functional synaptic input and that it is mediated by GABAA-Rs. Indeed, functional synaptic input was observed since we were able to obtain maps of optically evoked PSCs for both VIP+ and VIP− postsynaptic neurons that were located in the ventromedial SCN (Fig. 3A, 3B). This ventromedial region corresponds to the location of the presynaptic VIP+ neurons, and thus our study is limited to a local projection. This was done so that a comparison of inputs onto VIP+ and VIP− neurons would: (1) not be confounded by the distance of the projection, and (2) at least include one postsynaptic neuron of known genetic identity (the VIP+ neurons).
Figure 3.

Selective stimulation of presynaptic VIP+ neurons evokes fast GABAA-R mediated PSCs in both VIP+ and VIP− neurons. A, An example map of PSCs evoked in a VIP− neuron from different locations. Stimulus locations are depicted by red dots superimposed on the slice image (left). Responses collected from each stimulus location are plotted with individual traces (gray) and the average trace (black) (right). B, Example traces of PSCs evoked in VIP+ neurons. The early ChR2-mediated current was subtracted out of the trace to isolate PSCs for all subsequent figures and analysis. Both individual (gray) and average traces (black) are shown. C, PSCs in a VIP+ neuron were blocked by the GABAA-R specific antagonist, picrotoxin (100 μm). D, Paired plot of PSCs evoked from the location generating the largest amplitude before and after application of picrotoxin; *p < 0.05.
A significant component of the PSC maps is probably due to light activation of action potentials in axons (Last paragraph in previous section), and therefore, the position of laser stimulation does not reliably indicate the somatic location of the presynaptic neuron. This does not diminish the utility of the LSPS approach that we use because we can more readily limit our stimulation locally to a subset of VIP+ afferent sources compared with wide-field illumination and more readily assess the relative direction from which afferent input arrives. Moreover, the ability to excite axons has the advantage of exciting afferents whose somas have been severed during slice preparation (Petreanu et al., 2007; Madisen et al., 2012) allowing us to more closely measure the total VIP+ input.
For VIP+ neurons, responses had two components: an early current mediated by direct activation of ChR2 in the recorded neuron and a later PSC (Fig. 3B). These components were easily distinguished because the ChR2-mediated component peaked well before the onset of the PSC (3.4 ± 0.1 ms, n = 23). To both analyze and display PSCs in VIP+ neurons, the average ChR2-mediated current was estimated using an α function and then subtracted out of the average trace (Fig. 3B; Materials and Methods).
The duration of the PSCs was not different between VIP+ and VIP− neurons (28.5 ± 2.9 vs 24.8 ± 1.5, width at half-height, n = 18, 20; VIP+, VIP−). All PSCs were mediated by GABAA-Rs because 94 ± 2% of the synaptic response was blocked by application of picrotoxin (100 μm; Fig. 3C,D).
We examined latency data to provide evidence that the evoked PSCs represent monosynaptic transmission from optically stimulated VIP+ neurons. For every map, we determined the stimulation location that evoked the largest PSC (the best location) and measured the latency of that response with respect to laser onset. We made the same best location latency measurement for the action potential data described above. Cumulative distributions of these latencies were consistent with the idea that action potentials evoked in presynaptic VIP+ expressing neurons mediated the observed PSCs in a direct and monosynaptic manner (Fig. 4A). Although we expected a delay of ∼1–2 ms between action potential and PSC latencies if monosynaptic connections were involved, the average delay was actually 2.5 ms (AP peak latency = 5.5 ± 0.3 ms, n = 21; synaptic onset latency = 8.0 ± 0.3 ms; combining all PSCs depicted in Fig. 4A, n = 67). This slightly longer than expected delay in PSC latencies may have resulted from the slower processes occurring at our room temperature conditions or from the attenuated laser power hitting afferents deeper in the slice. The latter would induce longer latencies in PSCs because our measurements of action potential latency as a function of power at the slice surface demonstrated that lower-power resulted in longer latencies (n = 33; data not shown, from same experiments in Fig. 2C).
Because polysynaptic input most likely requires action potential firing, we determined whether we could observe action potential-independent PSCs mediated by VIP+ afferents. If so, then the PSCs observed above are likely monosynaptic. In a separate group of experiments, TTX (1 μm) was added to the bath to block action potentials, and under these conditions, PSCs depended on direct depolarization of the presynaptic terminals (Petreanu et al., 2009; Materials and Methods). We only examined action potential-independent PSCs in postsynaptic VIP− neurons because ChR2 expression together with the high laser intensity required made an examination of VIP+ neurons less reliable. We found clear action potential-independent PSCs in roughly the same proportion of neurons as that observed for action potential-dependent PSCs (Fig. 4B). Therefore, VIP+ neurons are capable of providing monosynaptic input, and the action potential-dependent PSCs that we observe are likely monosynaptic.
A fraction of neurons receive VIP+ input and this is invariant between day and night
We called a neuron responsive if a PSC was detectably evoked from at least one location in the map. We examined this using both Ai32 (n = 166) and Ai27 (n = 80) ChR2 mice, and because both groups showed identical trends, we pooled these data. Not all neurons were responsive, and therefore, did not display functional input from VIP+ neurons. There was no detectable relationship between responsiveness and the location of the recorded neuron (Fig. 5A). Forty-nine percent of all neurons were responsive, and VIP− neurons were more likely to be responsive compared with VIP+ neurons (35% vs 59%, p < 0.001, VIP+ vs VIP−; Fig. 5B). The percentage of VIP+ responsive neurons may, in principle, be underestimated due to simultaneously occurring ChR2-mediated currents decreasing cell input resistance, but this was unlikely based on the clear separation between the smallest PSC best amplitudes and the noise in average traces (Materials and Methods). No changes in connectivity were detected between day and night, even when both VIP+ and VIP− data were pooled (Fig. 5C). The proportion of responsive neurons do not appear to depend on action potential firing since we observed similar proportions of responsive neurons when examining action potential-independent PSCs (64%, 23/39 and 63/96 for VIP+ and VIP−, respectively). It is unlikely that the lack of a response is due to axons severed from somas during the slice preparation because synaptic transmission occurs from cut axons that are excited through ChR2 (Petreanu et al., 2007), and most, if not all, axon afferents that existed in vivo should exist in our slice in the vicinity of the recorded neuron. Some unresponsive neurons may be an artifact of slicing away a portion of the dendritic tree, but in the Discussion, we argue that this is unlikely and that indeed there is a distinct class of “unresponsive” neurons.
A lack of response did not simply indicate that a particular slice was incapable of generating a PSC because 93% (229/246) of the neurons examined were in slices that contained both responsive and unresponsive neurons. It is unlikely that insufficient laser power resulted in unresponsive neurons because we varied laser power in a subset of experiments and found that the maximum amplitude PSC was obtained at 50 uW power and was unchanged up to 500 uW (n = 16,28, VIP+ and VIP− neurons, day time point; data not shown). This suggests that our PSCs were collected at a power sufficient to evoke most of all possible inputs.
VIP+ inputs preferentially contact a subset of neurons independent of postsynaptic VIP expression
To determine whether VIP+ connectivity was biased independently of postsynaptic VIP expression, we determined whether the number of responsive neurons receiving inputs from multiple presynaptic VIP+ neurons (≥2) was higher than expected. Using a randomly picked sample, we determined the percentage of responsive neurons that had PSC successes at different locations with different average amplitudes (Materials and Methods). If two locations have different average amplitudes, we presume there must be at least two presynaptic VIP+ neurons providing input to the recorded neuron (Fig. 5D), and the frequency of this occurring was obtained (Fig. 5E). We then performed a calculation to determine whether this frequency matched what we would expect for 1100 presynaptic VIP+ neurons, the known number of unilateral SCN VIP+ neurons (Welsh et al., 2010), randomly targeting SCN neurons based on binomial distribution statistics constrained by the responsive neuron frequency in Figure 5B (Materials and Methods).
In all instances, the percentage of neurons with multiple presynaptic VIP+ partners was two to three times higher than that expected for random targeting modeled by binomial statistics (Fig. 5E). The 95% confidence intervals (CIs) are nonoverlapping in all instances of “actual” versus “expected” comparisons, and when VIP+ and VIP− data are pooled (Fig. 5, “All”) the 99% confidence intervals are nonoverlapping. Our twofold to threefold estimate represents a bias of VIP+ input onto responsive neurons and is probably an underestimate since our ability to detect different success amplitudes in a map was hampered by the limited sample number of traces acquired at each location and by the likelihood that inputs from different presynaptic VIP+ neurons had similar amplitudes. These data indicate that individual presynaptic VIP+ neurons do not randomly target neurons, but instead, preferentially target a subset of SCN neurons.
VIP+ local projection appears “sparsely” connected
The best fit binomial equation derived above to predict the probability of neurons with multiple inputs indicated that a neuron would have a 0.06% probability of receiving input from a single given presynaptic VIP+ neuron (“p” in Materials and Methods and using Fig. 5B, All data). This would represent a sparse projection. Even though this probability is derived from the binomial model of random targeting, this is a fair approximation because the deviation from randomness is not extreme. For reasons stated in the previous paragraph, this probability estimate likely represents a lower bound (more comment in the Discussion section).
To confirm that the connectivity is sparse, we used simultaneous recordings of two adjacent VIP+ neurons (<30 μm intersomal distance) to more directly examine the frequency of cell-to-cell connections originating from VIP+ neurons. We did not investigate postsynaptic VIP− neurons due to the experiment difficulty. We evoked a train of four action potentials in one cell and measured the average PSC in the other. This was done for both possible one-way connections in a recording pair. VIP+ neurons were marked by tdTomato fluorescence by crossing VIP-IRES-Cre mice with a tdTomato reporter mouse (Ai9; Madisen et al., 2010). Of 22 pairs representing 44 possible one-way connections, no PSC was detected. This suggests that the connectivity frequency is <2% which is consistent with the probability of 0.06% that we derive with the LSPS method.
PSC amplitude is invariant between day and night
We could evoke the same amount of presynaptic stimulation at both the day and night time windows because presynaptic VIP+ neuron excitability (Fig. 2) and presumably VIP+/ChR2+ neuron number were unchanged at these times. Therefore, we could determine whether the synaptic input to responsive neurons was altered without presynaptic confounds. The maps indicated that the amplitude and spatial distribution of evoked inputs were unchanged between day and night for both postsynaptic VIP+ and VIP− neurons (Fig. 6A,B). Maps based only on response successes revealed no differences as well (data not shown). When we plotted PSC amplitude at best (peak) location as a function of circadian time in a scatter plot, no pattern was observed (data not shown) suggesting that the lack of any change was not an artifact of the particular time windows examined. Comparing optically evoked PSC peak amplitude between VIP+ and VIP− neurons was not possible because the postsynaptic activation of ChR2 in VIP+ neurons most likely decreased membrane resistance and decreased IPSC amplitude to an unknown extent. We repeated these experiments for VIP− neurons examining action-potential independent PSCs, and again, there was no change between day and night suggesting that the synapses themselves are invariant in their properties (Fig. 6C,D). It is important to note that we only examined low-frequency synaptic transmission (one optical stimulus applied with an interval >1 min at each location), and we cannot rule out possible changes with high-frequency synaptic transmission.
In the maps, the strongest input was evoked by stimulation near the soma which is consistent with our recordings being performed in the same region where the presynaptic VIP+ neurons are located. However, it was not possible to determine how these locally evoked PSCs were more precisely related to the location of the presynaptic somas because axon afferents were also likely stimulated. Our simultaneous recordings of adjacent neuron pairs above suggest that, at the very least, there is not a prolific local projection from adjacently located somas.
Is the size of inputs from putative single presynaptic neurons altered between day and night? Similar to minimal stimulation paradigms using metal stimulating electrodes (Raastad et al., 1992), we focused on single stimulus locations in a map, and instead of the standard laser intensity of 100 μW, we lowered the intensity to a threshold level where successes occurred ≤40% of the time (Fig. 7A). In this circumstance, we assume that most of the responses are mediated by a single presynaptic VIP+ neuron. We found no difference between day and night for these threshold responses for either VIP+ or VIP− neurons (Fig. 7B). The response evoked from standard power was often larger than that at threshold power suggesting multiple presynaptic VIP+ neurons providing input. We found no difference in the ratio of these two quantities between day and night suggesting that the number of presynaptic VIP+ neurons was unchanged (Fig. 7C).
Figure 7.

Unitary PSCs are not detectably different between day and night. A, Example responses obtained from one cell during the day (left) and another cell at night (right). Individual trials are in gray and the averages of successes, excluding failures, are in black. PSCs were obtained at standard power (top, 100 μW) and at a threshold power (bottom) with >60% response failures. With this paradigm, IPSCs were assumed to be primarily unitary; originating from single presynaptic VIP+ neurons. B, Average success amplitude obtained at threshold power. Each point is the average from a single neuron. C, The ratio of standard/threshold amplitudes for data plotted in B.
Neurons with VIP+ synaptic input have high spontaneous synaptic transmission frequency
Is there anything different about the synapses targeting responsive neurons? sPSCs provide an approximate measure of the number and properties of synapses on a recorded neuron. In the same experiments in which we measured light-evoked synaptic transmission, we also measured sPSCs (Fig. 8A). To bias the analysis to GABAergic transmission, all analysis was restricted to PSCs that had >5 ms width-at-half-height (WHH) (Itri et al., 2004). These particular sPSCs were completely eliminated with the GABAA-R antagonist, picrotoxin (100 μm; Fig. 8B). Even if this criterion were not applied, the frequency of sPSCs decreased 97 ± 2% with addition of picrotoxin indicating that most sPSCs were GABAergic (Fig. 8C).
We first found that sPSC frequency was approximately threefold higher in VIP− neurons compared with VIP+ neurons (Fig. 8D). However, more interestingly, the sPSC properties in both subtypes appeared to be linked with evoked transmission from VIP+ inputs. Spontaneous PSC frequency was twofold to threefold higher for both VIP+ and VIP− responsive neurons compared with unresponsive neurons (Fig. 8D). Average sPSC frequency did not differ between the day and night time under any circumstances which is consistent with a previous study (Itri et al., 2004). In our experiments examining action potential-independent PSCs (dataset depicted in Fig. 6C), a similar phenomenon was observed where responsive neurons had higher mPSC frequencies (Fig. 8E). Therefore, the correlation between spontaneous synaptic events (sPSCs or mPSCs) and light evoked responses occurs at a synaptic locus and is not due to differing action potential firing properties of presynaptic neurons (such as firing rate). These data support the contention that responsive and unresponsive neurons appear to be distinct neuronal classes with different properties. In this context, responsive neurons have some generalized form of enhanced GABAergic input, and because this enhancement does not require action potential firing, the enhanced input reflects differences occurring only at synapses; either through higher synapse number or enhanced presynaptic neurotransmitter release.
Spontaneous PSC amplitude was correlated with optically evoked PSC amplitude in VIP− neurons (measured at the best location; Fig. 8F). No such relationship was observed in VIP+ neurons or between sPSC frequency and best location amplitude for either neuron subtype. No other parameters were linked to responsiveness including sPSC amplitude (Fig. 8D), input resistance, and holding current (latter data not shown).
VIP+ input suppresses spontaneous action potential firing less at night
To this point, our PSC measurements more accurately reflect synaptic conductances and not the actual physiological current since we clamp the driving force of these PSCs by perfusing the pipette [Cl−] into the recorded neuron. But how these conductances actually influence the postsynaptic neuron may change between day and night (Wagner et al., 1997; De Jeu and Pennartz, 2002; Choi et al., 2008). Moreover, it is not even clear that the VIP+ projection can even influence firing in postsynaptic neurons. To assess the physiological effect of PSCs mediated by the VIP+ input, we determined how spontaneous action potential firing was modulated by this input. We performed cell-attached recordings to monitor action potential firing in VIP− neurons. This technique has the advantage of not interfering with the ionic contents of the cytoplasm since the membrane is not ruptured. We could not examine postsynaptic VIP+ neurons because of their direct excitation through ChR2.
We applied wide-field illumination, and found that stimulation could either be inhibitory or excitatory on spontaneous action potential firing in VIP− neurons (Fig. 9A). The window for action potential rate change was 100–150 ms after the 5 ms light pulse, and this is consistent with the long PSPs expected for the long membrane time constant of these neurons. Overall, responses were more commonly inhibitory compared with excitatory [22/46 (48%) vs 6/46 (13%), p < 0.05, χ2; 18/46 neurons had no detectable response]. The percentage of inhibitory responses was not detectably different between day and night [Fig. 9B; 10/18 (56%) vs 12/28 (43%)], whereas the percentage of excitatory responses was higher at night [Fig. 10B; 0/18 (0%) vs 6/28 (21%), p < 0.05, χ2]. We quantified these responses by taking the action potential number ratio of the response to the immediately preceding baseline, where a ratio of 1 is no response, <1 is inhibitory, and >1 is excitatory (see Materials and Methods). On average, the ratio was higher at night compared with day (Fig. 9C). Excitation was likely not due to later rebound from inhibition since when excitatory responses were examined, action potential number in the first half of the response window (10–60 ms) was clearly higher than that in the second half (ratio of early/late = 1.68 ± 0.62, n = 4). In summary, although our PSC measurements indicate that synaptic conductances are not altered between day and night, the coupling of these conductances to action potentials is altered.
AVP+ afferent input shares similar properties with VIP+ afferent input
How specific are the properties of the VIP+ afferent projection compared with other pathways in the SCN? To determine this, we performed a more limited investigation of the afferent projection originating from AVP+ SCN neurons. A parallel Cre-loxP, ChR2 afferent stimulation, and postsynaptic neuron recording strategy was used except the focus was on presynaptic AVP+ afferents and on postsynaptic responses in AVP+ and AVP− SCN neurons. This was accomplished by crossing AVP-IRES-Cre knock-in (Pei et al., 2014) and Ai27 mice. Recording locations were slightly more dorsal in the SCN compared with our VIP+ experiments (Fig. 10A) reflecting the known location of AVP neurons (Welsh et al., 2010). As with VIP+ afferents, input maps of AVP+ input were collected.
We report no findings related to differences in the spatial distribution of maps between postsynaptic AVP+ and AVP− neurons or related to differences between night and day since sample numbers collected were too small to address these comparisons reliably. However, other measurements were more reliable, and striking similarities were observed for AVP+ afferent input when compared with the VIP+ afferent pathway. First, we observed light-evoked PSCs only in a minority of neurons (Fig. 10B,C), and using the same binomial calculation as used above for the VIP+ pathway to determine a “lower bound” for connectivity probability (with “p” derived from the combined probability depicted in Fig. 10C; Materials and Methods), the probability of a postsynaptic neuron receiving input from a given single presynaptic AVP+ neuron is 0.009%. Therefore, the AVP+ projection has a sparse connectivity design. Second, light-evoked PSCs were mediated by GABAA-Rs, and the vast majority of sPSCs were mediated by GABAA-Rs (Fig. 10D,E). Third, neurons which had light-evoked PSCs also had a high-frequency of sPSCs (Fig. 10F), which again is consistent with a specific responsive neuron population like that observed for the VIP+ pathway. And fourth, the maximum PSC amplitude in a map was highly correlated with the average sPSC amplitude (Fig. 10G). Therefore, many of the properties that we observe above are not unique for the VIP+ afferent projection and may represent a general design for synaptic pathways within the SCN.
Discussion
The projection from the VIP+ network evokes responses through GABAA-Rs at both postsynaptic VIP+ and VIP− neurons; there is a connectivity bias toward the VIP− neurons. This projection appears to sparsely target postsynaptic neurons. Neurons receiving VIP+ input preferentially receive input from more presynaptic VIP+ neurons than would be expected for a random targeting of afferents and this targeting bias was independent of postsynaptic VIP expression. Based on this targeting bias and on characteristics of spontaneously occurring synaptic events, neurons appear to fall into distinct responsive and “nonresponsive” categories. We find that action potential firing in VIP+ neurons and the GABAA-R mediated synaptic conductances they provide are invariant between the day and night time windows that we examined. In other words, VIP+ synaptic input is invariant up through the opening of the GABAA-R channels that mediate the evoked conductance. On the other hand, the final physiological effect of this conductance in VIP− neurons has a less inhibitory effect on spontaneous firing at night compared with the day.
The invariant spontaneous and optically evoked action potential firing in VIP+ neurons was surprising. It is commonly observed that SCN neurons are more excitable and display higher spontaneous firing rates during the day (Gillette et al., 1995; Liu et al., 1997; Mrugala et al., 2000; Cutler et al., 2003; Schaap et al., 2003; Albus et al., 2005; Kudo et al., 2011; Wang et al., 2012), and this includes the ZT4–12 window that we examined. Per2-luciferase imaging of dissociated SCN cultures suggest that a proportion of VIP+ neurons have an intrinsic circadian rhythm (Webb et al., 2009), but circadian-dependent changes in spontaneous firing of VIP+ neurons have not ever been directly examined. Therefore, our data do not directly contradict previous findings. This invariance in spontaneous firing may not be specific for VIP+ neurons because it has also been reported for calbindin-expressing neurons (Jobst and Allen, 2002).
Although postsynaptic alterations in membrane currents and driving force for GABAergic currents are reported to be modulated by the circadian rhythm in the SCN (Jiang et al., 1997; Wagner et al., 1997; De Jeu and Pennartz, 2002; Pennartz et al., 2002; Itri et al., 2005; Belle et al., 2009), we tested the hypothesis that aspects of synaptic transmission independent of these postsynaptic mechanisms would be modulated. Because our PSCs were obtained with whole-cell recordings where pipette [Cl−] set cytoplasmic [Cl−], the effects of the above postsynaptic alterations were eliminated. Therefore, our comparison of PSCs between day and night was effectively a comparison of postsynaptic conductances; a quantity independent of the driving force and more directly linked to the number of GABAARs that are opened. In this context, we observed no changes in connectivity or in PSC maps, which indicates that components of synaptic transmission up through the evoked conductance were invariant over the circadian cycle. It is important to note that this conclusion is restricted to conditions of low-frequency synaptic transmission and with no neuromodulators present.
This invariance in evoked synaptic conductances in the ventromedial SCN is consistent with in vivo evidence of circadian gene expression where the ventral SCN region is modulated less compared with the dorsal region (Hamada et al., 2001). Invariance in GABAergic transmission is supported by previous observations that properties of GABAergic sPSCs in ventral SCN neurons and mPSCs in dorsal SCN neurons are invariant between night and day (Itri et al., 2004). These latter findings suggest that the invariance in synaptic transmission up through the synaptic conductance that we observe may be applicable to multiple intra-SCN pathways.
Our finding of a decreased inhibitory role for VIP+ input onto VIP− neurons at night is consistent with previous reports of GABAergic input originating from unspecified pathways (De Jeu and Pennartz, 2002; Choi et al., 2008). Our data substantiate these previous observations by stimulating a specific subset of presynaptic afferents without possible artifacts that may occur using nonselective extracellular stimulation with a metal electrode, such as stimulating fibers of passage or depolarizing the postsynaptic neuron directly. The shift to a less inhibitory role may be mediated by an increase in the difference between the Cl− reversal potential and the resting membrane potential. There are two possibilities that may underlie this change: (1) Cl− reversal potential increases, and/or (2) the membrane potential decreases. Both of these have been reported to occur and may synergistically contribute to the excitatory shift at night (Jiang et al., 1997; De Jeu and Pennartz, 2002; Pennartz et al., 2002; Choi et al., 2008; Belle et al., 2009). Studies have reported that changes in the excitatory versus inhibitory nature of GABAergic transmission are more salient in the dorsal compared with the ventral SCN (Albus et al., 2005; Choi et al., 2008), but our ability to see this change in the ventral SCN may be due to our optical method where we more precisely stimulate an isolated synaptic pathway and avoid the artifacts stated above.
Our data suggest that the connectivity originating from the VIP+ network is sparse. Based on the frequency of responsive neurons, we derived a lower bound of 0.06% for the probability of one SCN postsynaptic neuron receiving input from a given presynaptic VIP+ neuron. As stated in results, while these estimates are based on random targeting with binomial statistics, they do approximate the low probability of connectivity that exists in the VIP+ network projection since a more sophisticated formulation incorporating the targeting bias that we uncovered would not change our conclusions regarding sparseness. For instance, if we underestimated the number of presynaptic partners by a factor of 10, a sparse connection scheme is still supported. It is likely that our estimates are within this error based on our observations that: (1) the targeting bias was not extremely deviant from randomness (2- to 3-fold), (2) there were no detectable connections with simultaneously recorded presynaptic and postsynaptic VIP+ neurons, and (3) putative unitary responses were on average half the maximal response (Fig. 7C). The consequences of this sparse connectivity design are unclear. Studies of the reticular nucleus in the thalamus suggest that sparse GABAergic connectivity decreases synchronized firing in that brain region (Huntsman et al., 1999; Landisman et al., 2002).
It is possible that our results were affected by the artifactual removal of dendrites during the slice preparation. In this scenario, a physiologically responsive neuron may have become unresponsive after slice preparation. We think that the proportion of dendrites removed was probably <40% on average since most recordings were on somas that were at least 15 μm beneath the slice surface. This possible artifact might impact our conclusion that there exists a specific population of unresponsive SCN neurons. However, we think this is unlikely for two reasons. First, because responsive neurons receive multiple synapses from multiple presynaptic VIP+ neurons, it is unlikely that complete removal of VIP+ inputs would occur. Second, the strong correlation between neurons unresponsive to evoked VIP+ input and low-frequency spontaneous synaptic events suggests there is a distinct class of less responsive neurons.
Although sparse connectivity of all internal SCN projections in culture preparations has been inferred from action potential correlations (Freeman et al., 2013) and calcium imaging (Hong et al., 2012), we build on this by providing direct measurements of VIP+ mediated synaptic input. Moreover, we do this using acutely prepared slices which strengthens the contention that the sparse network design exists in vivo. In addition to sparseness, our calculations of multiple presynaptic VIP+ partners suggest that VIP+ input is biased toward a subset of neurons and is not simply randomly targeting SCN neurons (Fig. 5E). How this sparse projection scheme applies to VIP+ input to dorsal SCN cell populations remains unknown.
We make the novel observation that neurons receiving VIP+ input (the responsive neurons) have some form of enhanced GABAergic input as observed by higher sPSC frequencies. Moreover, responsive neurons had higher mPSC frequency indicating that this enhancement is action potential-independent and not due to responsive neurons receiving input from presynaptic neurons with higher spontaneous action potential firing rates. Instead, these changes are mediated by mechanisms occurring locally at the synapse. We do not know whether this increase in spontaneous events is due to more functional GABAergic synapses or an increase in spontaneous release probability at these synapses. It is also unclear whether this higher frequency of spontaneous events originates selectively from VIP+ afferents or from all GABAergic synapses contacting the neuron. Future examination of afferents from other subtypes would be required to resolve this. This correlation between VIP+ input and global spontaneous transmission, together with the targeting bias of the VIP+ projection onto responsive neurons, supports our contention that responsive and unresponsive neurons represent distinct SCN neuron populations.
Finally, our data indicate that some properties of the VIP+ projection pathway are not unique but are shared with other SCN pathways as well. The exclusive use of GABAA-Rs, the sparse projection design, and the differing aspects of spontaneously occurring synaptic transmission between responsive and unresponsive neurons were also observed in the AVP+ projection that we briefly examined. Therefore, these properties may be the rule, and not the exception, among the many SCN pathways. Further studies will be required to determine the generality of these rules and if the circadian properties of the VIP+ projection are shared by other SCN pathways.
In summary, we have established that the VIP+ synaptic pathways in the SCN could, in principle, play a role in the GABAergic modulation of the circadian cycle. We have provided a complete and precise functional understanding of circadian modulation of SCN circuits in terms of all components of synaptic transmission in a particular pathway; the excitability of the presynaptic neuron, the connectivity, the induced postsynaptic currents, and the final effect on postsynaptic firing. Our data provide a foundation for determining the precise structure of GABAergic input provided by the VIP+ network and its role in the modulation, resetting, and synchronizing of the circadian rhythm in the SCN (Liu and Reppert, 2000; Albus et al., 2005; Han et al., 2012; Evans et al., 2013; Freeman et al., 2013).
Footnotes
This research was supported by NIH P50 MH074924 (J.S.T.), R01 MH078024 (J.S.T.), NIH R01 D056370 (J.R.G.), and NIH R01 NS045711 (K.M.H.). J.S.T. is an investigator in the Howard Hughes Medical Institute. We thank Dr Z. J. Huang of Cold Spring Harbor Laboratory for generously providing the VIP-IRES-CRE knock-in mice; and Drs Michael Beierlein, Jennifer A. Mohawk, and Kristofer Loerwald for comments on the paper.
The authors declare no competing financial interests.
References
- Abrahamson EE, Moore RY. Suprachiasmatic nucleus in the mouse: retinal innervation, intrinsic organization and efferent projections. Brain Res. 2001;916:172–191. doi: 10.1016/S0006-8993(01)02890-6. [DOI] [PubMed] [Google Scholar]
- Albus H, Vansteensel MJ, Michel S, Block GD, Meijer JH. A GABAergic mechanism is necessary for coupling dissociable ventral and dorsal regional oscillators within the circadian clock. Curr Biol. 2005;15:886–893. doi: 10.1016/j.cub.2005.03.051. [DOI] [PubMed] [Google Scholar]
- Aton SJ, Colwell CS, Harmar AJ, Waschek J, Herzog ED. Vasoactive intestinal polypeptide mediates circadian rhythmicity and synchrony in mammalian clock neurons. Nat Neurosci. 2005;8:476–483. doi: 10.1038/nn1419. [DOI] [PMC free article] [PubMed] [Google Scholar]
- Belenky MA, Yarom Y, Pickard GE. Heterogeneous expression of gamma-aminobutyric acid and gamma-aminobutyric acid-associated receptors and transporters in the rat suprachiasmatic nucleus. J Comp Neurol. 2008;506:708–732. doi: 10.1002/cne.21553. [DOI] [PubMed] [Google Scholar]
- Belle MD, Diekman CO, Forger DB, Piggins HD. Daily electrical silencing in the mammalian circadian clock. Science. 2009;326:281–284. doi: 10.1126/science.1169657. [DOI] [PubMed] [Google Scholar]
- Brancaccio M, Maywood ES, Chesham JE, Loudon AS, Hastings MH. A Gq-Ca2+ axis controls circuit-level encoding of circadian time in the suprachiasmatic nucleus. Neuron. 2013;78:714–728. doi: 10.1016/j.neuron.2013.03.011. [DOI] [PMC free article] [PubMed] [Google Scholar]
- Castel M, Morris JF. Morphological heterogeneity of the GABAergic network in the suprachiasmatic nucleus, the brain's circadian pacemaker. J Anat. 2000;196:1–13. doi: 10.1046/j.1469-7580.2000.19610001.x. [DOI] [PMC free article] [PubMed] [Google Scholar]
- Choi HJ, Lee CJ, Schroeder A, Kim YS, Jung SH, Kim JS, Kim do Y, Son EJ, Han HC, Hong SK, Colwell CS, Kim YI. Excitatory actions of GABA in the suprachiasmatic nucleus. J Neurosci. 2008;28:5450–5459. doi: 10.1523/JNEUROSCI.5750-07.2008. [DOI] [PMC free article] [PubMed] [Google Scholar]
- Cutler DJ, Haraura M, Reed HE, Shen S, Sheward WJ, Morrison CF, Marston HM, Harmar AJ, Piggins HD. The mouse VPAC2 receptor confers suprachiasmatic nuclei cellular rhythmicity and responsiveness to vasoactive intestinal polypeptide in vitro. Eur J Neurosci. 2003;17:197–204. doi: 10.1046/j.1460-9568.2003.02425.x. [DOI] [PubMed] [Google Scholar]
- De Jeu M, Pennartz C. Circadian modulation of GABA function in the rat suprachiasmatic nucleus: excitatory effects during the night phase. J Neurophysiol. 2002;87:834–844. doi: 10.1152/jn.00241.2001. [DOI] [PubMed] [Google Scholar]
- Evans JA, Leise TL, Castanon-Cervantes O, Davidson AJ. Dynamic interactions mediated by nonredundant signaling mechanisms couple circadian clock neurons. Neuron. 2013;80:973–983. doi: 10.1016/j.neuron.2013.08.022. [DOI] [PMC free article] [PubMed] [Google Scholar]
- Freeman GM, Jr, Krock RM, Aton SJ, Thaben P, Herzog ED. GABA networks destabilize genetic oscillations in the circadian pacemaker. Neuron. 2013;78:799–806. doi: 10.1016/j.neuron.2013.04.003. [DOI] [PMC free article] [PubMed] [Google Scholar]
- Gillette MU, Medanic M, McArthur AJ, Liu C, Ding JM, Faiman LE, Weber ET, Tcheng TK, Gallman EA. Intrinsic neuronal rhythms in the suprachiasmatic nuclei and their adjustment. Ciba Found Symp. 1995;183:134–144. doi: 10.1002/9780470514597.ch8. discussion 144–153. [DOI] [PubMed] [Google Scholar]
- Hamada T, LeSauter J, Venuti JM, Silver R. Expression of period genes: rhythmic and nonrhythmic compartments of the suprachiasmatic nucleus pacemaker. J Neurosci. 2001;21:7742–7750. doi: 10.1523/JNEUROSCI.21-19-07742.2001. [DOI] [PMC free article] [PubMed] [Google Scholar]
- Han S, Yu FH, Schwartz MD, Linton JD, Bosma MM, Hurley JB, Catterall WA, de la Iglesia HO. Na(V)1.1 channels are critical for intercellular communication in the suprachiasmatic nucleus and for normal circadian rhythms. Proc Natl Acad Sci U S A. 2012;109:E368–377. doi: 10.1073/pnas.1115729109. [DOI] [PMC free article] [PubMed] [Google Scholar]
- Harmar AJ, Marston HM, Shen S, Spratt C, West KM, Sheward WJ, Morrison CF, Dorin JR, Piggins HD, Reubi JC, Kelly JS, Maywood ES, Hastings MH. The VPAC(2) receptor is essential for circadian function in the mouse suprachiasmatic nuclei. Cell. 2002;109:497–508. doi: 10.1016/S0092-8674(02)00736-5. [DOI] [PubMed] [Google Scholar]
- Hogenesch JB, Herzog ED. Intracellular and intercellular processes determine robustness of the circadian clock. FEBS Lett. 2011;585:1427–1434. doi: 10.1016/j.febslet.2011.04.048. [DOI] [PMC free article] [PubMed] [Google Scholar]
- Hong JH, Jeong B, Min CH, Lee KJ. Circadian waves of cytosolic calcium concentration and long-range network connections in rat suprachiasmatic nucleus. Eur J Neurosci. 2012;35:1417–1425. doi: 10.1111/j.1460-9568.2012.08069.x. [DOI] [PubMed] [Google Scholar]
- Huntsman MM, Porcello DM, Homanics GE, DeLorey TM, Huguenard JR. Reciprocal inhibitory connections and network synchrony in the mammalian thalamus. Science. 1999;283:541–543. doi: 10.1126/science.283.5401.541. [DOI] [PubMed] [Google Scholar]
- Itri J, Colwell CS. Regulation of inhibitory synaptic transmission by vasoactive intestinal peptide (VIP) in the mouse suprachiasmatic nucleus. J Neurophysiol. 2003;90:1589–1597. doi: 10.1152/jn.00332.2003. [DOI] [PubMed] [Google Scholar]
- Itri JN, Michel S, Vansteensel MJ, Meijer JH, Colwell CS. Fast delayed rectifier potassium current is required for circadian neural activity. Nat Neurosci. 2005;8:650–656. doi: 10.1038/nn1448. [DOI] [PMC free article] [PubMed] [Google Scholar]
- Itri J, Michel S, Waschek JA, Colwell CS. Circadian rhythm in inhibitory synaptic transmission in the mouse suprachiasmatic nucleus. J Neurophysiol. 2004;92:311–319. doi: 10.1152/jn.01078.2003. [DOI] [PMC free article] [PubMed] [Google Scholar]
- Jiang ZG, Yang Y, Liu ZP, Allen CN. Membrane properties and synaptic inputs of suprachiasmatic nucleus neurons in rat brain slices. J Physiol. 1997;499:141–159. doi: 10.1113/jphysiol.1997.sp021917. [DOI] [PMC free article] [PubMed] [Google Scholar]
- Jobst EE, Allen CN. Calbindin neurons in the hamster suprachiasmatic nucleus do not exhibit a circadian variation in spontaneous firing rate. Eur J Neurosci. 2002;16:2469–2474. doi: 10.1046/j.1460-9568.2002.02309.x. [DOI] [PubMed] [Google Scholar]
- Kim YI, Dudek FE. Intracellular electrophysiological study of suprachiasmatic nucleus neurons in rodents: inhibitory synaptic mechanisms. J Physiol. 1992;458:247–260. doi: 10.1113/jphysiol.1992.sp019416. [DOI] [PMC free article] [PubMed] [Google Scholar]
- Kudo T, Loh DH, Kuljis D, Constance C, Colwell CS. Fast delayed rectifier potassium current: critical for input and output of the circadian system. J Neurosci. 2011;31:2746–2755. doi: 10.1523/JNEUROSCI.5792-10.2011. [DOI] [PMC free article] [PubMed] [Google Scholar]
- Landisman CE, Long MA, Beierlein M, Deans MR, Paul DL, Connors BW. Electrical synapses in the thalamic reticular nucleus. J Neurosci. 2002;22:1002–1009. doi: 10.1523/JNEUROSCI.22-03-01002.2002. [DOI] [PMC free article] [PubMed] [Google Scholar]
- Liu C, Reppert SM. GABA synchronizes clock cells within the suprachiasmatic circadian clock. Neuron. 2000;25:123–128. doi: 10.1016/S0896-6273(00)80876-4. [DOI] [PubMed] [Google Scholar]
- Liu C, Weaver DR, Jin X, Shearman LP, Pieschl RL, Gribkoff VK, Reppert SM. Molecular dissection of two distinct actions of melatonin on the suprachiasmatic circadian clock. Neuron. 1997;19:91–102. doi: 10.1016/S0896-6273(00)80350-5. [DOI] [PubMed] [Google Scholar]
- Madisen L, Mao T, Koch H, Zhuo JM, Berenyi A, Fujisawa S, Hsu YW, Garcia AJ, 3rd, Gu X, Zanella S, Kidney J, Gu H, Mao Y, Hooks BM, Boyden ES, Buzsáki G, Ramirez JM, Jones AR, Svoboda K, Han X, et al. A toolbox of Cre-dependent optogenetic transgenic mice for light-induced activation and silencing. Nat Neurosci. 2012;15:793–802. doi: 10.1038/nn.3078. [DOI] [PMC free article] [PubMed] [Google Scholar]
- Madisen L, Zwingman TA, Sunkin SM, Oh SW, Zariwala HA, Gu H, Ng LL, Palmiter RD, Hawrylycz MJ, Jones AR, Lein ES, Zeng H. A robust and high-throughput Cre reporting and characterization system for the whole mouse brain. Nat Neurosci. 2010;13:133–140. doi: 10.1038/nn.2467. [DOI] [PMC free article] [PubMed] [Google Scholar]
- Maywood ES, Chesham JE, O'Brien JA, Hastings MH. A diversity of paracrine signals sustains molecular circadian cycling in suprachiasmatic nucleus circuits. Proc Natl Acad Sci U S A. 2011;108:14306–14311. doi: 10.1073/pnas.1101767108. [DOI] [PMC free article] [PubMed] [Google Scholar]
- Mohawk JA, Takahashi JS. Cell autonomy and synchrony of suprachiasmatic nucleus circadian oscillators. Trends Neurosci. 2011;34:349–358. doi: 10.1016/j.tins.2011.05.003. [DOI] [PMC free article] [PubMed] [Google Scholar]
- Moore RY, Speh JC. GABA is the principal neurotransmitter of the circadian system. Neurosci Lett. 1993;150:112–116. doi: 10.1016/0304-3940(93)90120-A. [DOI] [PubMed] [Google Scholar]
- Morin LP. Neuroanatomy of the extended circadian rhythm system. Exp Neurol. 2013;243:4–20. doi: 10.1016/j.expneurol.2012.06.026. [DOI] [PMC free article] [PubMed] [Google Scholar]
- Mrugala M, Zlomanczuk P, Jagota A, Schwartz WJ. Rhythmic multiunit neural activity in slices of hamster suprachiasmatic nucleus reflect prior photoperiod. Am J Physiol Regul Integr Comp Physiol. 2000;278:R987–R994. doi: 10.1152/ajpregu.2000.278.4.R987. [DOI] [PubMed] [Google Scholar]
- Patel AB, Hays SA, Bureau I, Huber KM, Gibson JR. A target cell-specific role for presynaptic Fmr1 in regulating glutamate release onto neocortical fast-spiking inhibitory neurons. J Neurosci. 2013;33:2593–2604. doi: 10.1523/JNEUROSCI.2447-12.2013. [DOI] [PMC free article] [PubMed] [Google Scholar]
- Pei H, Sutton AK, Burnett KH, Fuller PM, Olson DP. AVP neurons in the paraventricular nucleus of the hypothalamus regulate feeding. Molecular metabolism. 2014;3:209–215. doi: 10.1016/j.molmet.2013.12.006. [DOI] [PMC free article] [PubMed] [Google Scholar]
- Pennartz CM, de Jeu MT, Bos NP, Schaap J, Geurtsen AM. Diurnal modulation of pacemaker potentials and calcium current in the mammalian circadian clock. Nature. 2002;416:286–290. doi: 10.1038/nature728. [DOI] [PubMed] [Google Scholar]
- Perkins KL. Cell-attached voltage-clamp and current-clamp recording and stimulation techniques in brain slices. J Neurosci Methods. 2006;154:1–18. doi: 10.1016/j.jneumeth.2006.02.010. [DOI] [PMC free article] [PubMed] [Google Scholar]
- Petreanu L, Huber D, Sobczyk A, Svoboda K. Channelrhodopsin-2-assisted circuit mapping of long-range callosal projections. Nat Neurosci. 2007;10:663–668. doi: 10.1038/nn1891. [DOI] [PubMed] [Google Scholar]
- Petreanu L, Mao T, Sternson SM, Svoboda K. The subcellular organization of neocortical excitatory connections. Nature. 2009;457:1142–1145. doi: 10.1038/nature07709. [DOI] [PMC free article] [PubMed] [Google Scholar]
- Raastad M, Storm JF, Andersen P. Putative single quantum and single fibre excitatory postsynaptic currents show similar amplitude range and variability in rat hippocampal slices. Eur J Neurosci. 1992;4:113–117. doi: 10.1111/j.1460-9568.1992.tb00114.x. [DOI] [PubMed] [Google Scholar]
- Schaap J, Albus H, VanderLeest HT, Eilers PH, Détári L, Meijer JH. Heterogeneity of rhythmic suprachiasmatic nucleus neurons: implications for circadian waveform and photoperiodic encoding. Proc Natl Acad Sci U S A. 2003;100:15994–15999. doi: 10.1073/pnas.2436298100. [DOI] [PMC free article] [PubMed] [Google Scholar]
- Shepherd GM, Pologruto TA, Svoboda K. Circuit analysis of experience-dependent plasticity in the developing rat barrel cortex. Neuron. 2003;38:277–289. doi: 10.1016/S0896-6273(03)00152-1. [DOI] [PubMed] [Google Scholar]
- Strecker GJ, Wuarin JP, Dudek FE. GABAA-mediated local synaptic pathways connect neurons in the rat suprachiasmatic nucleus. J Neurophysiol. 1997;78:2217–2220. doi: 10.1152/jn.1997.78.4.2217. [DOI] [PubMed] [Google Scholar]
- Taniguchi H, He M, Wu P, Kim S, Paik R, Sugino K, Kvitsani D, Fu Y, Lu J, Lin Y, Miyoshi G, Shima Y, Fishell G, Nelson SB, Huang ZJ. A resource of Cre driver lines for genetic targeting of GABAergic neurons in cerebral cortex. Neuron. 2011;71:995–1013. doi: 10.1016/j.neuron.2011.07.026. [DOI] [PMC free article] [PubMed] [Google Scholar]
- Wagner S, Castel M, Gainer H, Yarom Y. GABA in the mammalian suprachiasmatic nucleus and its role in diurnal rhythmicity. Nature. 1997;387:598–603. doi: 10.1038/42468. [DOI] [PubMed] [Google Scholar]
- Wang TA, Yu YV, Govindaiah G, Ye X, Artinian L, Coleman TP, Sweedler JV, Cox CL, Gillette MU. Circadian rhythm of redox state regulates excitability in suprachiasmatic nucleus neurons. Science. 2012;337:839–842. doi: 10.1126/science.1222826. [DOI] [PMC free article] [PubMed] [Google Scholar]
- Webb AB, Angelo N, Huettner JE, Herzog ED. Intrinsic, nondeterministic circadian rhythm generation in identified mammalian neurons. Proc Natl Acad Sci U S A. 2009;106:16493–16498. doi: 10.1073/pnas.0902768106. [DOI] [PMC free article] [PubMed] [Google Scholar]
- Welsh DK, Takahashi JS, Kay SA. Suprachiasmatic nucleus: cell autonomy and network properties. Annu Rev Physiol. 2010;72:551–577. doi: 10.1146/annurev-physiol-021909-135919. [DOI] [PMC free article] [PubMed] [Google Scholar]