Abstract
In Caenorhabditis elegans, gentle touch is sensed by the anterior (ALM and AVM) and posterior (PLM) touch receptor neurons. Anterior, but not posterior, touch is affected by several stress conditions via the action of AKT kinases and the DAF-16/FOXO transcription factor. Here we show that a ubiquitination-dependent mechanism mediates such effects. AKT-1/AKT kinase and DAF-16 alter the transcription of mfb-1, which encodes an E3 ubiquitin ligase needed for the ubiquitination of the mechanosensory channel subunit MEC-4. Ubiquitination of MEC-4 reduces the amount of MEC-4 protein in the processes of ALM neurons and, consequently, the mechanoreceptor current. Even under nonstress conditions, differences in the amount of MFB-1 appear to cause the PLM neurons to be less sensitive to touch than the ALM neurons. These studies demonstrate that modulation of surface mechanoreceptors can regulate the sensitivity to mechanical signals.
Keywords: C. elegans, DEG/ENaC, mechanosensation, neuromodulation, ubiquitination
Introduction
Senses adapt to environmental changes through diverse mechanisms. For example, the vertebrate rod and cone cells adapt to light through bleaching and regeneration of photopigments (Fain et al., 2001). Additionally, the gap junction connections between neurons in the retina are also regulated by ambient illumination (Bloomfield and Völgyi, 2009). These changes balance visual acuity with sensitivity. Furthermore, the visual cortex can integrate additional modulatory information, such as attention (Reynolds and Chelazzi, 2004). Together, these modulatory switches allow fine tuning of sensory inputs by diverse conditions.
Mechanosensation is similarly regulated in multiple ways. The vertebrate hair cells, for example, adapt to dynamic sound pressure through nonlinear mechanical amplification by the outer hair cells (Robles and Ruggero, 2001; Hudspeth, 2008). This mechanical amplification is further inhibited by medial olivocochlear efferents during repeated stimulation (Wersinger and Fuchs, 2011). The transduction in the inner hair cells quickly adapt to sustained deflection through a combination of mechanical adaptation by MYO1C and a reduction of channel opening induced by increased intracellular calcium (Holt and Corey, 2000). Other forms of mechanosensation, such as the sense of touch, are modulated by efferent neurons signaling motor programs (Cattaert et al., 2002) or by facilitating interneurons signaling other senses (Castellucci and Kandel, 1976). Both hearing and touch sensation can also be sensitized by sustained stimulation (Kujawa and Liberman, 1999; Govindaraju et al., 2006). The mechanism of how mechanotransduction itself is regulated in either touch sensation or hearing, however, is unknown.
Caenorhabditis elegans sense gentle touch along the body with six touch receptor neurons (TRNs). In these neurons, mechanical force is transduced by MEC-4 (O'Hagan et al., 2005), a DEG/ENaC channel. Although both the ALM neurons, the anterior TRNs, and the PLM neurons, can initiate a response to gentle touch, using calcium imaging, we have shown the PLM neurons are less sensitive to force than the ALM neurons (Chen and Chalfie, 2014). These cells also differ in another aspect: several conditions (high salt, hypoxia, Dauer formation, and sustained vibration) modulate anterior, but not posterior, touch sensitivity (Chen and Chalfie, 2014) through AKT-1/AKT kinase and DAF-16/FOXO. A second AKT kinase, AKT-2, acts redundantly with AKT-1 but has less effect on touch sensitivity. Force-response curves for the ALM cells under these conditions, as measured by calcium imaging, suggested that the change in touch sensitivity was due to changes in the amount of active MEC-4 channel.
In this report, we confirm this hypothesis. MEC-4 expression is regulated by transcriptional control of MFB-1, an Atrogin-1-like E3 ubiquitin ligase that ubiquitinates MEC-4. This pathway not only regulates anterior touch response under various conditions but is also partially responsible for the reduced touch sensitivity in the PLM neurons compared with the ALM neurons under normal conditions. This pathway thus appears to be a major regulator of mechanotransduction.
Materials and Methods
C. elegans strains and culture.
C. elegans strains were cultured as described previously (Brenner, 1974) at 20°C. For a list of all strains used and additional information, see Table 1. Wild-type (N2) and all TU strains were from laboratory stocks, and the non-TU strains were from the Caenorhabditis Genetics Center. Animals were subjected to various stresses as described previously (Chen and Chalfie, 2014). For sustained vibration, animals were vibrated with 50 Hz square waves for 24 h with an average acceleration of 1.5 × g. For high salt treatment, animals were grown with NGM supplemented with 180 mm NaCl for 24 h. For hypoxia, animals were grown with 1% oxygen for 24 h. Dauer larvae were induced by starving the animals for 5 d at 25°C. Hermaphrodites were used for all experiments.
Table 1.
C. elegans strains used in this study
| Strain | Genotype | Notes |
|---|---|---|
| N2 | + | Wild type |
| GR1310 | akt-1(mg144) V | |
| GR1307 | daf-16 (mgDf50) I | |
| TU4286 | uba-1(it129) IV; akt-1(ok525) V | |
| TU4284 | mfb-1(gk311) I; akt-1(ok525) V | |
| TU4287 | cav-1(ok2089) IV; akt-1(ok525) V | |
| TU4386 | cav-1(ok2089) IV; akt-1(ok525) V; uEx881(mec-18p::cav-1::gfp, pCFJ90, mec-3p::rfp) | TRN::cav-1 in cav-1; akt-1 |
| TU4387 | cav-1(ok2089) IV; akt-1(ok525) V; uEx882(mec-18p::cav-1::gfp, pCFJ90, mec-3p::rfp) | TRN::cav-1 in cav-1; akt-1 |
| TU4388 | daf-16 (mgDf50) I; uEx881(mec-18p::cav-1::gfp, pCFJ90, mec-3p::rfp) | TRN::cav-1 in daf-16 |
| TU4389 | daf-16 (mgDf50) I; uEx882(mec-18p::cav-1::gfp, pCFJ90, mec-3p::rfp) | TRN::cav-1 in daf-16 |
| TU4390 | uEx883(mec-18p::mfb-1c, pCFJ90, mec-3p::rfp) | TRN::mfb-1 |
| TU4391 | uEx884(mec-18p::mfb-1c, pCFJ90, mec-3p::rfp) | TRN::mfb-1 |
| TU4392 | cav-1(ok2089) IV; uEx883(mec-18p::mfb-1c, pCFJ90, mec-3p::rfp) | TRN::mfb-1 in cav-1 |
| TU4393 | cav-1(ok2089) IV; uEx884(mec-18p::mfb-1c, pCFJ90, mec-3p::rfp) | TRN::mfb-1 in cav-1 |
| TU3971 | uIs146 | mec-4::rfp |
| TU4468 | akt-1 (ok525) V; uIs146 | akt-1; mec-4::rfp |
| TU4701 | mfb-1(gk311) I; akt-1(ok525) V; uIs146 | |
| TU3929 | uIs128 (ins-10p::ins-10(i), ins-10p::rfp, pCW2.1) | ins-10(i) strain |
| TU3595 | sid-1(pk3321) him-5(e1490) V; lin-15B(n744) X; uIs72 | Neuronally enhanced RNAi |
| TU4470 | sid-1(pk3321) him-5(e1490) V; lin-15B(n744) X; uIs72; uEx889[unc-54p::gfp, mec-17p::rfp, mec-4(+)] | TU3595+mec-4(+) |
| TU4471 | sid-1(pk3321) him-5(e1490) V; lin-15B(n744) X; uIs72; uEx890[unc-54p::gfp, mec-17p::rfp, mec-4(+)] | TU3595+mec-4(+) |
| TU4472 | sid-1(pk3321) him-5(e1490) V; uIs72; uIs146/+ | |
| TU4469 | uIs126; uIs146 | ins-10(i); mec-4::rfp |
| VC708 | mfb-1(gk311) I | |
| TU2769 | uIs31 III | For electrophysiology |
| TU4702 | uIs31 III; akt-1(ok525)V | |
| TU4703 | mfb-1(gk311) I; uIs31 III; akt-1(ok525) V | |
| TU4704 | wwp-1(ok1102) I; akt-1(ok525)V | |
| TU4705 | Y92H12A.2 (tm5771) I; akt-1(ok525)V |
For drug treatments, animals were grown on NGM plates containing 1.4 mm PYR-41, 13 μm bortezomib, 11 μm MG-132, or 0.4 μm concanamycin A for one generation before testing.
Constructs.
Most constructs were made using the Multisite Gateway Three-fragment Vector system (Invitrogen). For a list of all plasmids and primers used and additional information, see Tables 2, 3, and 4.
Table 2.
Plasmid and primers used in this study: gateway expression plasmids
| Designation | Description | Promoter | CDS | 3′UTR |
|---|---|---|---|---|
| TU#1127 | mec-18p::cav-1::gfp | TU#1114 | TU#1107 | TU#1103 |
| TU#1128 | mec-18p::mfb-1c | TU#1114 | TU#1108 | TU#1102 |
Table 3.
Plasmid and primers used in this study: entry clones and nongateway plasmidsa
| Designation | Description | Primer 1 | Primer 2 | Vector | Description |
|---|---|---|---|---|---|
| TU#1114 | mec-18p::atg | GGGGACAACTTTGTATAGAAAAGTTGAATTAATTCGTCTACTATCCACGTGTCGAT | GGGGACTGCTTTTTTGTACAAACTTGCCATGCTCACAACCTTCTTGGAAGGCG | PDONR-P4P1r | mec-18 promoter, to last gene, including ATG |
| TU#1107 | cav-1 | GGGGACAAGTTTGTACAAAAAAGCAGGCTTAATGAGATTGTGCAACGTGTGGAATG | GGGGACCACTTTGTACAAGAAAGCTGGGTGGACGCATGGAGCAGTAGTTTCTTG | PDONR221 | cav-1 genomic DNA |
| TU#1108 | mfb-1c | GGGGACAAGTTTGTACAAAAAAGCAGGCTTAATGCCATTCATTGGACGTGATTGG | GGGGACCACTTTGTACAAGAAAGCTGGGTGTTACAAATAAATCAACATATCGACAAATTGTCTGGG | PDONR221 | mfb-1 cDNA |
| TU#1102 | utr | GGGGACAGCTTTCTTGTACAAAGTGGTTTAGCATTCGTAGAATTCCAACTGAGCG | GGGGCCTTTGTTAATAAAGTTGGGAAACAGTTATGTTTGGTATATTGGGAATG | pDONR-P2rP3 | unc-54 3′UTR from pPD95.75 |
| TU#1103 | gfp::utr | GGGGACAGCTTTCTTGTACAAAGTGGTTTGGCCAAAGGACCCAAAGGTATG | GGGGCCTTTGTTAATAAAGTTGGGAAACAGTTATGTTTGGTATATTGGGAATG | pDONR-P2rP3 | gfp + unc-54 3′UTR from pPD95.75 |
| pCW2.1 | ceh-22p::gfp | ceh-22p::gfp (Okkema and Fire, 1994) | |||
| pCFJ90 | myo-2p::mCherry | Addgene (Frokjaer-Jensen et al., 2008) | |||
| TU#929 | mec-3p::mrfp | pPD95.77_HcRed1 | 1.9kb Pst-1/BamHI mec-3 promoter sequence inserted into modified pPD95.77 carrying mTagRFP (generated by Irini Topalidou, pers. comm.) |
aThe primer sequences used to PCR the inserted sequences were provided.
Table 4.
Plasmid and primers used in this study: sequencing primers
| Designation | Sequence | Description |
|---|---|---|
| gk311_Seq | CCTGTATGCCGACTCCTTGT | mfb-1(gk311) genotyping primers |
| gk311_Seqr | TGCGGTGTAATATGAGCCAA | mfb-1(gk311) genotyping primers |
| it129_seq1 | AGAGTAGCGAATGTATGGAACTTCGAC | uba-1(it129) genotyping primer |
| it129_seqr | AGCCAAGTTCTGGTCAGGAGC | uba-1(it129) genotyping primer |
| mgDf50_seq_forw | CAATGAGCAATGTGGACAGC | daf-16(mgDf50) genotyping primer |
| mgDf50_seq_rev | CCGTCTGGTCGTTGTCTTTT | daf-16(mgDf50) genotyping primer |
| ok1102_seq1 | AGTTCAGAGGCATCCACGTC | wwp-1(ok1102) genotyping primer |
| ok1102_seqr | ATCTCTGTACCGCCCTCCTT | wwp-1(ok1102) genotyping primer |
| ok2089_seq | CCATTTCCCATCTGTTACCG | cav-1(ok2089) genotyping primer |
| ok2089_seqr | TGGATGAAAGAGCACACAGC | cav-1(ok2089) genotyping primer |
| ok525_seqf | TTGAGCGAACATTCTATGCG | akt-1(ok525) genotyping primer |
| ok525_seqr | GTCGTGGTGACAAGGGAAGT | akt-1(ok525) genotyping primer |
| tm5771_seq | GCACTCCAATGAAGCTGTGT | Y92H12A.2 (tm5771) genotyping primer |
| tm5771_seqr | CTTTCCGGCGGTGTGAACTG | Y92H12A.2 (tm5771) genotyping primer |
Touch assay.
The touch assays were done by touching the side of the animal gently using an eyebrow hair either behind the pharynx for anterior touch or near the anus for posterior touch (Chen and Chalfie, 2014). Each animal was touched five times alternately on each end and scored by the number of responses elicited. All touch assays were performed blind to genotype. At least three biologically independent samples (with at least 8 animals for each sample) were tested for each strain and/or condition. Mean and 95% CI of the averages from each independent repeat was reported.
Electrophysiology.
All electrophysiological measurements were done as described previously (O'Hagan et al., 2005) with minor modifications to the stimulus protocol to ensure saturated stimulation. We used an unfiltered 5 ms pulse of 150 mV to drive a piezo-driven glass probe with a tip diameter of 22 μm to touch the animal, followed by a200 mV voltage to pull the probe away from the animal. The probe touched near the second pharyngeal bulb for ALM measurements, and posterior to the vulva for posterior measurements. The longer distance (160 ± 10 μm for five ALM neurons and 220 ± 30 μm for five PLM as measured from animals with video recordings) compared with O'Hagan et al. (2005) (∼100 μm) minimizes mechanical disruption on the patch during saturated stimulation. Because the probe we used had a resonant frequency of ∼70 Hz, the 5 ms pulse of stimulation allows the probe to move in one continuous motion until it reaches the maximum displacement. Compared with the original stimulation (O'Hagan et al., 2005), this protocol generates slightly higher mechanoreceptor currents (MRCs), probably because filtering of the stimulation signal limits the speed that the probe can move at. The stimuli were also less sensitive to the distance between the probe and the animal. The saturated stimulus was chosen so that a 50% reduction in the driving voltage would result in the same MRCs. This pulse protocol was used for all peak MRC responses in ALM and PLM neurons. All data were analyzed using Igor (Wavemetrics).
Alternatively, a step protocol (O'Hagan et al., 2005) was used for I-V relation. The step protocol was only modified so that the stimuli were unfiltered. The unfiltered step protocol and pulse protocol generated similar peak MRCs (data not shown).
Nonstationary noise analysis was performed as previously described (Heinemann and Conti, 1992; O'Hagan et al., 2005). Briefly, the variance and mean current from 20 repeated stimuli were fitted using the following:
where σI2 is the variance of the current I, I is the mean current of the 20 stimuli, N is the number of channels fluctuating, and i is the single-channel current. For noise analysis, a combination of data generated using the pulse and step protocols were used.
Microscopy.
All fluorescent pictures and antibody-staining pictures were taken on a Zeiss observer Z1 equipped with a CoolSnap HQ2 camera (Photometrics). Samples were blinded before observation and analysis.
Single molecule mRNA fluorescent in situ hybridization (smFISH) was performed as described previously (Topalidou et al., 2011). At least 29 PLM neurons, 30 AVM neurons, and 70 ALM neurons were examined for each genotype, as indicated in the figures.
Antibody staining and quantification.
Animals were stained using a polyclonal mouse-α-MEC-4 antibody (Abcam) and a polyclonal rabbit-α-MEC-18 antibody at 1:200 dilution (Zhang, 2004), or using a mouse anti-GFP antibody (3E6; Invitrogen) as described by Bellanger et al. (2012). Whole animals were stained under permeabilized conditions. ALM processes were imaged near the second pharyngeal bulb, and the PLM processes were imaged between the PVM and PLM cell bodies.
Cultured cells were fixed with 4% PFA in BSA for 10 min at room temperature, and blocked in 1% BSA in PBS with or without 0.5% Triton for 30 min at 4°C for permeabilized and nonpermeabilized staining, respectively. The slides were then washed in PBS, incubated in PBS with the above α-MEC-4 and α-MEC-18 antibodies for 1 h at 4°C, then washed overnight before incubation with the secondary antibodies for 1 h at 4°C. The slides were then washed four times and mounted for microscopy. The TRNs were identified using MEC-18 staining in the processes (for permeabilized staining) and in the cell bodies (for both permeabilized and nonpermeabilized staining). ALM and PLM neurons were distinguished using the morphology of the processes, which is >80% accurate (C. Zheng and M.C., personal communication). Because MEC-18 is cytoplasmic in the processes of the TRNs, the MEC-18 staining was also used as a control in the processes for nonpermeabilized staining. Some TRN processes could be damaged during the staining process, and MEC-18 antibody staining would show a strong signal in some sections of the processes. These sections were not used in determining the MEC-4 levels.
The intensities of MEC-4 puncta were quantified using ImageJ (Schneider et al., 2012) by calculating the average intensity of a 5-pixel circle on a MEC-4 punctum minus background in the nearby region off the process of the cell (∼10–15 pixels away). The intensities from mutant animals were then normalized to wild-type levels, and the intensities from RNAi-treated TU3595 animals were normalized to animals treated with gfp RNAi. At least three independent biological replicates were performed for each condition/strain, and the mean and 95% CI of the average of the replicas were reported. For cultured cells, the mean and 95% CI of the cells were reported.
The interpuncta distance was calculated by dividing the length of the processes by the number of MEC-4 puncta. The MEC-4 puncta were located and counted in ImageJ using the FindMaxima function with a tolerance set to 40. This tolerance level allows the best recognition of MEC-4 puncta as determined by visual inspection.
Immunoprecipitation and Western blotting.
To preserve ubiquitinated proteins, animals were grown with 13 μm bortezomib from hatching. Immunoprecipitation was performed on L4 animals in CSK buffer (Walhout and Boulton, 2006) supplemented with 2% Triton X-100, 0.5% deoxycholic acid, 10 mm N-ethylmaleimide (Sigma), and complete protease inhibitors (Roche) using a rabbit polyclonal anti-ubiquitin antibody (ab19247; Abcam) or a mouse anti-GFP antibody (3E6; Invitrogen) as controls. Protein samples were run on 8% SDS-PAGE and blotted using a rabbit polyclonal antibody against RFP (ab62341; Abcam) in 5% nonfat milk. Band intensities were quantified using ImageJ and normalized to wild-type levels.
Statistical analysis.
Student's t test or Welch's test with Bonferroni correction was performed for all touch assays, electrophysiological data, and most staining data depending on whether the data being compared have equal variance. All smFISH data were analyzed using Mann–Whitney's U test, and when applicable, subjected to Bonferroni correction. Western blot data were analyzed using one-sample t test and Student's t test, both with Bonferroni correction. All p values reported are after correction except where noted.
Results
AKT-1 modifies touch sensitivity through MFB-1
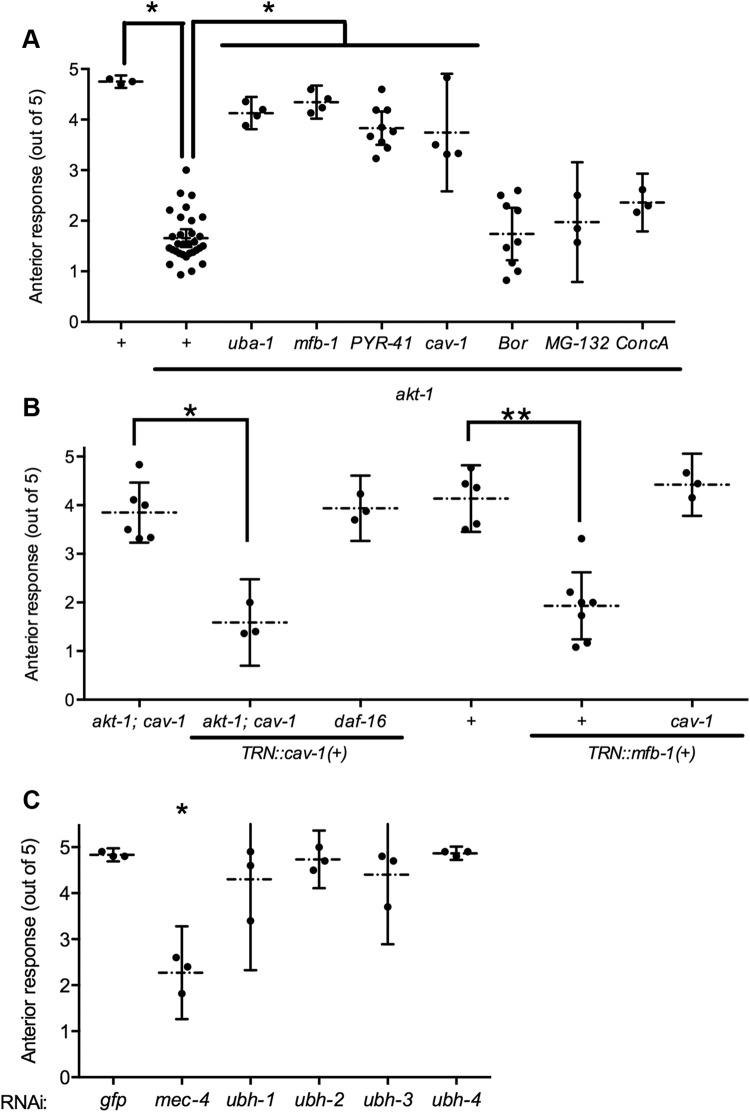
Several conditions, including high salt, hypoxia, and Dauer formation, reduce anterior touch sensitivity through AKT-1 (Chen and Chalfie, 2014). akt-1 mutant animals responded less when touched on the anterior part of the animal (Fig. 1A). This change in touch sensitivity requires ubiquitination: loss of uba-1, which encodes an E1 ubiquitin activating enzyme, or inhibition of ubiquitination by the drug PYR-41 restored anterior touch sensitivity to akt-1 mutants. Blocking proteasomal and lysosomal degradation with MG-132, bortezomib, and concanamycin A did not restore the touch sensitivity, suggesting that ubiquitination, but not the subsequent protein degradation, is important for the modulation of touch sensitivity.
Figure 1.
AKT-1 modulates touch sensitivity through MFB-1 and ubiquitination. A, The anterior touch sensitivity of animals with the indicated genotypes or akt-1 animals treated with 1.4 mm PYR-41, 13 μm bortezomib (Bor), 11 μm MG-132, or 0.4 μm concanamycin A (ConcA). Here and in subsequent panels and figures, individual data points, mean, and the 95% confidence interval (CI) are shown. *p < 0.005, comparing akt-1 with wild-type or comparing the indicated mutants with akt-1. B, The anterior touch sensitivity of animals with the indicated genotypes with or without mec-18p::mfb-1 or mec-18p::cav-1::gfp. *p < 0.01. **p < 0.005. C, The anterior touch sensitivity of TU3595 animals treated with RNAi against the indicated genes. *p < 0.01, compared with RNAi against gfp. For Figures 1–5, each data point indicates the value of one biological replicate. Each biological replicate contains at least eight animals. For Figures 6–8, each data point indicates one animal.
Mammalian ENaC channels are ubiquitinated by the E3 ubiquitin ligase Nedd4.2, and then removed from the plasma membrane through a caveolin-dependent process (Bhalla and Hallows, 2008). Similar to the control of mammalian ENaC channels, the touch sensitivity of akt-1 animals was restored by a mutation in cav-1/caveolin (Fig. 1A). The loss of the Nedd-4-like E3 ubiquitin ligases WWP-1 or Y92H12A.2 in C. elegans, however, did not prevent the touch insensitivity of akt-1 mutants (data not shown). Instead, mutation in a gene encoding an Atrogin-like E3 ubiquitin ligase, mfb-1, restored touch sensitivity (Fig. 1A). Both mfb-1 and cav-1 act cell autonomously: TRN-specific expression of mfb-1(+) in wild-type reduced anterior touch sensitivity (Fig. 1B); similarly, TRN-specific expression of cav-1(+) in akt-1; cav-1 animals, but not in daf-16 animals, reduced anterior touch sensitivity. Expressing mfb-1(+) in cav-1 animals, however, failed to reduce anterior touch sensitivity, suggesting that caveolin acts downstream of ubiquitination in the regulation of MEC-4. Therefore, MFB-1 negatively regulates touch sensitivity by acting upstream of caveolin. These results suggest that the ubiquitin-dependent change in touch sensitivity is mediated by the removal of the active channel protein from the cell surface.
Insulin signaling also controls the expression of UBH-4, a deubiquiting enzyme that counteracts ubiquitination and decreases proteasome activity (Matilainen et al., 2013). Knocking down ubh-4 or its paralogs (ubh-3, ubh-2, and ubh-1) using neuron-enhanced RNAi, however, produced no effect on anterior touch sensitivity in TU3595 (Fig. 1C). These results suggest that either the deubiquitinating enzymes do not contribute significantly to the control of touch sensitivity under normal conditions, possibly due to a low level of baseline ubiquitination activity, or the deubiquitinating enzymes act redundantly.
AKT-1 and DAF-16 regulate the transcription of mfb-1
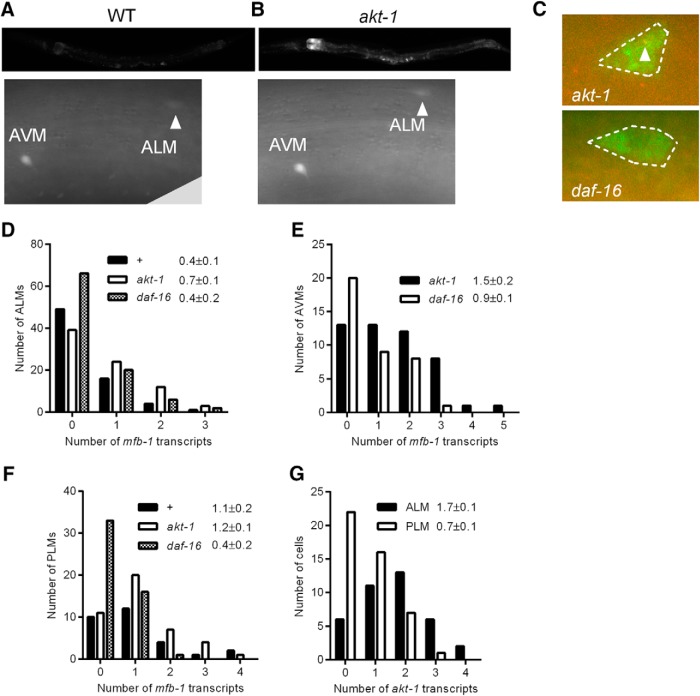
MFB-1::GFP was expressed throughout the animal with the highest concentration in the gut, the spermatheca, and the nervous system (Fig. 2A, top). By feeding the animals with bacteria expressing RNAi constructs against GFP to reduce non-neuronal GFP expression, we were able to identify GFP expression in the ALM and AVM neurons (Fig. 2A, bottom) (Calixto et al., 2010). An akt-1 mutation increased MFB-1::GFP expression throughout the animal, including in the ALM and AVM neurons (Fig. 2B).
Figure 2.
AKT-1 and DAF-16 regulate mfb-1 transcription. A, B, mfb-1p::gfp expression in a wild-type animal (A) and an akt-1 mutant (B) fed with non-RNAi bacteria (top), and in ALM (arrow) and AVM neurons in a animals fed with RNAi against gfp, which reduced gfp expression in non-neuronal tissues (bottom). All pictures of the same magnification were taken at the same exposure. C, Representative pictures of smFISH against mfb-1 (red) and mec-18 (green) in ALM cells in akt-1 and daf-16 mutants. The positions of the mec-18 (green) dots delineate the shape of the ALM cell bodies (dashed circles). An mfb-1 transcript in the cell is indicated with an arrowhead. D–F, Quantification of mfb-1 transcripts in ALM cells (D), AVM cells (E), and PLM cells (F) in akt-1, daf-16, and wild-type animals as measured by single molecule mRNA FISH. Data are mean ± SEM labeled for each genotype. D, n ≥ 70, p < 0.05, comparing akt-1 with daf-16. E, n ≥ 38, p < 0.01, comparing akt-1 with daf-16. F, n ≥ 70, p < 0.0005, comparing akt-1 with daf-16 and p < 0.01, comparing wild-type with daf-16. G, Quantification of akt-1 transcripts in ALM (black) and PLM (white) cells. Data are mean ± SEM labeled for each population of cells. p < 0.0005 comparing ALM and PLM cells.
We also examined mfb-1 expression in the TRNs using smFISH (Fig. 2C–F). Although we had not been able to identify GFP expression specifically in the PLM neurons (feeding RNAi against GFP failed to suppress non-neuronal GFP expression near the PLM neurons due to inefficient feeding RNAi near the tail, Calixto et al., 2010; preventing us from identifying GFP expression in the PLM neurons because of uniform fluorescence in both the PLM neurons and the surrounding tissues), we could see its expression by smFISH. Moreover, we saw an increase in the number of mfb-1 transcripts in the ALM (Fig. 2D; p < 0.05), AVM (Fig. 2E; p < 0.01), and PLM (Fig. 2F; p < 0.0005) neurons in akt-1 animals compared with daf-16 animals. Therefore, AKT-1 and DAF-16 regulate mfb-1 transcription in both the anterior and posterior TRNs.
The sensitivity of the PLM neurons to touch is approximately half of that of the ALM neurons in wild-type animals as measured by calcium imaging (Chen and Chalfie, 2014). This difference in touch sensitivity could be caused by differences in MFB-1 levels. Consistent with a negative regulatory role of MFB-1 in touch sensitivity, we saw more mfb-1 transcripts in the PLM neurons than in the ALM neurons in wild-type animals (Fig. 2D,F; p < 0.01). Moreover, the mfb-1 levels in wild-type animals are closer to that of daf-16 animals in ALM neurons (Fig. 2D; 0.4 ± 0.1 transcripts in wild-type vs 0.7 ± 0.1 in akt-1 and 0.4 ± 0.1 in daf-16) and that of akt-1 animals in PLM neurons (Fig. 2F; 1.1 ± 0.2 in wild-type vs 1.2 ± 0.2 in akt-1 vs 0.4 ± 0.1 in daf-16). Therefore, although AKT-1 and DAF-16 regulate mfb-1 transcription in both the ALM and PLM neurons, the strength of insulin signaling may be lower in the PLM neurons than in the ALM neurons under normal conditions. This difference would lead to higher mfb-1 expression and thus lower touch sensitivity to force. Consistent with this hypothesis, the PLM neurons have ∼60% fewer akt-1 transcripts than the ALM neurons (Fig. 2G), which may reduce the strength of insulin signaling.
MFB-1 controls the amount of MEC-4 through ubiquitination
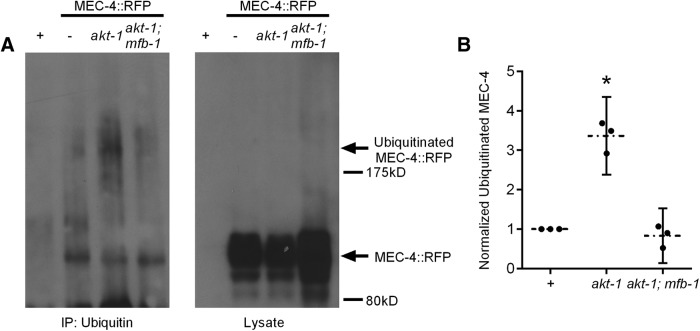
Because MFB-1 is an E3 ubiquitin ligase, we hypothesized that MFB-1 regulates touch sensitivity by ubiquitinating MEC-4 and regulating the amount of this protein. Indeed, we found that MEC-4::RFP was ubiquitinated (Fig. 3A). In addition, more MEC-4::RFP is ubiquitinated in akt-1 mutants than in wild-type animals (Fig. 3A,B). This ubiquitination is dependent on MFB-1 because the increase in ubiquitinated MEC-4 was eliminated in animals lacking mfb-1 (Fig. 3A,B). These results indicate that a loss of akt-1 activity induces an MFB-1-dependent ubiquitination of MEC-4.
Figure 3.
MFB-1 ubiquitinates MEC-4 to regulate its expression. A, Western blot against RFP for lysate (right) or after immunoprecipitation against ubiquitin (left) in wild-type animals with (−) or without (+) MEC-4::RFP, and akt-1 and akt-1;mfb-1 animals with MEC-4::RFP. The lysate samples represent 1/20th of the protein of the ubiquitinated samples. No ubiquitinated MEC-4::RFP was immunoprecipitated with a GFP antibody as a negative control (data not shown). B, Quantification of band intensities from three independent biological replicates. All intensities were normalized to wild-type controls. *akt-1 is significantly different (p < 0.05) from wild-type using one-sample t test and from akt-1; mfb-1 (p < 0.01) using Student's t test. N = 3.
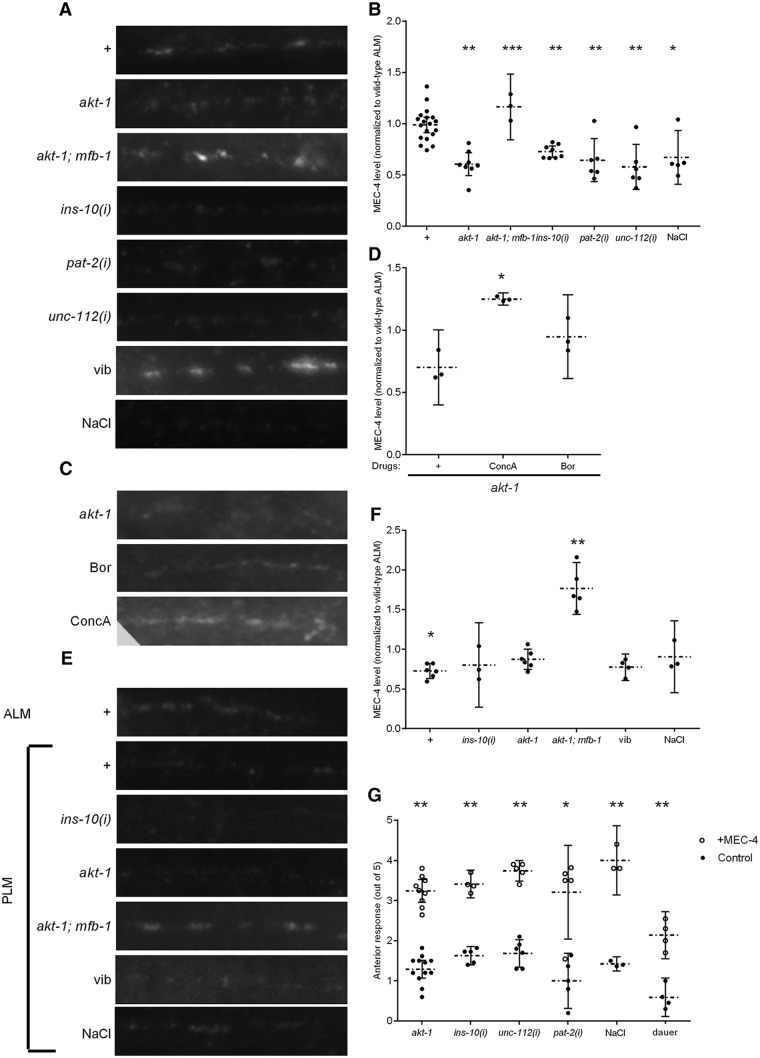
Consistent with our model, the total amount of MEC-4 expression was reduced in akt-1 TRNs (Fig. 4A,B). The AKT kinases are activated by both the focal adhesion proteins, such as PAT-2/α-integrin and UNC-112/Mig-2, which activate integrin signaling, and the insulin-like peptide INS-10, which activates insulin signaling (Chen and Chalfie, 2014), in the regulation of touch sensitivity. RNAi against ins-10, unc-112, and pat-2 also reduced MEC-4 expression (Fig. 4A,B). The MEC-4 expression in akt-1 animals, however, was restored by an mfb-1 mutation (Fig. 4A,B). The punctate organization of MEC-4 along the TRN processes in mutants with reduced MEC-4 expression, however, remained indistinguishable from wild-type animals (interpuncta distance is 1.3 ± 0.2 μm for wild-type animals, 1.5 ± 0.1 μm for akt-1 animals, and 1.2 ± 0.2 μm for ins-10(i) animals; p = 0.5 between akt-1 and wild-type and p = 0.7 between ins-10(i) and wild-type without Bonferroni correction). Therefore, mfb-1 expression is negatively correlated with MEC-4 expression, supporting the hypothesis that MFB-1-dependent ubiquitination reduces MEC-4 expression.
Figure 4.
MEC-4 expression regulates touch sensitivity. Representative pictures (A) and quantifications (B) of permeabilized antibody staining of MEC-4 (normalized to wild-type) in the processes of ALM neurons of animals with the indicated phenotype, or treated with RNAi [indicated by (i)] against unc-112, pat-2, or ins-10, or treated with high salt (NaCl) or sustained vibration (vib). *p < 0.05, compared with wild-type. **p < 0.005, compared with wild-type. ***p < 0.005, comparing akt-1; mfb-1 with akt-1. N ≥ 3. Representative pictures (C) and quantifications (D) of permeabilized antibody staining of MEC-4 (normalized to wild-type) in the processes of ALM neurons of akt-1 animals with or without bortezomib (Bor) or concanamycin A (ConcA). *p < 0.005, compared with no drug condition. N = 3 for all conditions. Representative pictures (E) and quantifications (F) of permeabilized antibody staining of MEC-4 (normalized to wild-type ALM neurons) in the processes of PLM neurons of animals with the indicated phenotype, or treated with RNAi against ins-10, or treated with high salt (NaCl). *p < 0.05, comparing wild-type PLM to wild-type ALM (B). **p < 0.005, comparing akt-1; mfb-1 to akt-1or to wild-type. N ≥ 3. G, The anterior touch sensitivity of animals with the indicated genotypes with (circles) or without (dots) MEC-4 overexpression in the TRNs. *p < 0.05, comparing each strain with or without MEC-4 overexpression. **p < 0.005, comparing each strain with or without MEC-4 overexpression.
Treating akt-1 animals with concanamycin A, which blocks lysosomal degradation, also increased overall MEC-4 expression (Fig. 4C,D) but did not restore touch sensitivity in akt-1 mutants (Fig. 1A). Bortezomib, which blocks proteasomal degradation, had a smaller and statistically insignificant effect on MEC-4 expression. Although we cannot exclude proteasomal degradation in the removal of MEC-4, these results suggest that MEC-4 is likely to be degraded primarily through the lysosomal pathways. Regardless of the mechanism of degradation, these data suggest that the ubiquitination of MEC-4 and its removal from the surface, but not its subsequent degradation, are important for the regulation of touch sensitivity.
The PLM neurons, which are less sensitive than the ALM neurons (Chen and Chalfie, 2014), have less MEC-4 than the ALM neurons in wild-type animals (Fig. 4E,F). Because insulin and integrin signaling does not affect the posterior touch response (Chen and Chalfie, 2014), we predicted that MEC-4 expression should not be reduced by mutations in insulin signaling. Indeed, MEC-4 expression in the PLM neurons in akt-1 animals and animals treated with RNAi against ins-10 were not reduced compared with wild-type animals (Fig. 4E,F). akt-1; mfb-1 doubles, however, had increased MEC-4 expression in the PLM neurons. MFB-1 thus regulates MEC-4 expression in both ALM and PLM neurons. Because MFB-1 is also regulated by AKT-1 in both ALM and PLM neurons, the lack of reduction in posterior response of akt-1 animals, therefore, is not caused by a different regulatory mechanism of MEC-4, but rather by differences in the signal strength.
If the change in MEC-4 expression causes changes in touch sensitivity, then restoring MEC-4 expression should overcome the reduction of touch sensitivity. Indeed, overexpressing MEC-4::RFP or MEC-4 in akt-1 animals, ins-10(i) animals, and animals treated with RNAi against unc-112 or pat-2 restored their anterior touch sensitivity (Fig. 4G). Overexpressing MEC-2, MEC-6, or MEC-10, other TRN membrane proteins needed for touch sensitivity, had no such effects (data not shown). Therefore, the change in the amount of MEC-4 appears to underlie the modulation of touch sensitivity through the AKT-1 pathway.
Environmental factors modulate touch sensitivity by regulating MEC-4 expression
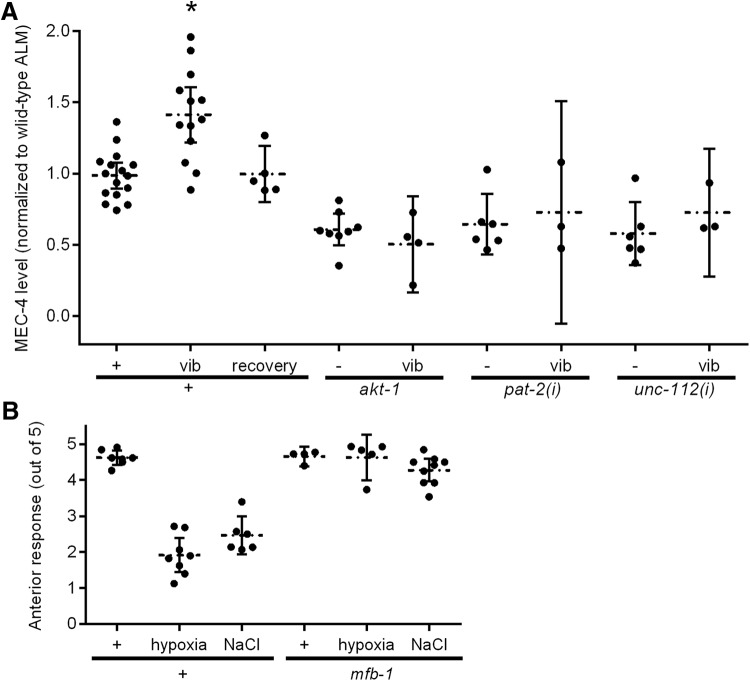
High salt reduces anterior, but not posterior, touch sensitivity through insulin signaling, and prolonged vibration sensitizes the anterior touch response through integrin signaling (Chen and Chalfie, 2014). Both pathways then converge on AKT-1. Consistent with the hypothesis that these conditions regulate touch sensitivity through changing the expression of MEC-4, high salt reduced MEC-4 expression in the ALM neurons (Fig. 4A,B), and prolonged vibration increased MEC-4 expression in the ALM neurons (Figs. 4A and 5A). No change in MEC-4 expression was seen in the PLM neurons (Fig. 4E,F). MEC-4 expression returns to normal in vibrated animals after 12 h of rest (Fig. 5A), during which time the touch sensitivity also returns to normal level (Chen and Chalfie, 2014). Reduced activities in akt-1, pat-2, and unc-112 through mutations or RNA interference blocked sensitization (Chen and Chalfie, 2014). Consistent with a role of MEC-4 regulation in modulating the touch response, changes in the amount of MEC-4 were also blocked by these mutations or RNAi (Fig. 5A).
Figure 5.
Environmental conditions alter MEC-4 expression. A, Quantification of antibody staining of MEC-4 (normalized to wild-type) in the processes of ALM neurons of animals with the indicated phenotype with or without sustained vibration (vib), and wild-type animals recovered from sustained vibration (recovery). *p < 0.005, compared with wild-type; and p < 0.05, compared with recovery. N ≥ 3. B, The anterior touch sensitivity of wild-type and mfb-1 animals grown under normal condition, hypoxia, or high salt. p < 0.005, comparing mfb-1 with wild-type under hypoxia and high salt conditions. N ≥ 4.
Similar to akt-1 mutants, the reduced touch sensitivity of wild-type animals treated with high salt and of Dauer animals can be restored by overexpressing MEC-4 (but not MEC-2, MEC-6, or MEC-10; Fig. 4G), and the touch sensitivity of those treated with high salt or hypoxia were restored by a mutation in mfb-1 (Fig. 5B). These results indicate that environmental conditions control anterior touch sensitivity by altering MEC-4 expression through MFB-1.
Control of mechanoreceptor current by regulating MEC-4 surface expression
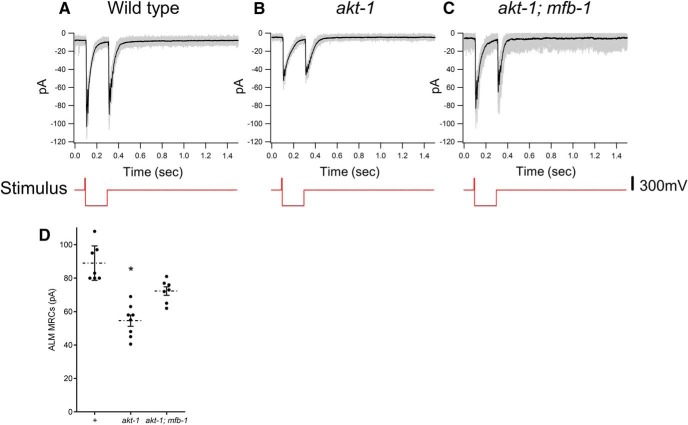
Although the total amount of MEC-4 in ALM processes is lower in mutants with reduced touch sensitivity, the more relevant change should be in the amount of functional MEC-4 channels at the plasma membrane. A change in the amplitude of the MRC elicited by saturated mechanical stimuli will reflect a change in these channels. We therefore recorded MRCs in ALM and PLM neurons when they were stimulated by saturated force. When stimulated with a pulse of force (5 ms; Fig. 6, red traces), both wild-type and akt-1 MRCs in ALM neurons were qualitatively similar to previously reported MRC recordings from PLM neurons (O'Hagan et al., 2005) (Fig. 6A,B). The amplitude of the currents in response to saturated stimuli, however, was smaller in akt-1 animals than in wild-type animals (55 ± 3 pA in akt-1 mutants, n = 8 vs 89 ± 4 pA in wild-type, n = 7; p < 0.0005; Fig. 6A,B,D). The saturated MRC was partially, but significantly, restored in akt-1 animals by an mfb-1 mutation (72 ± 3 pA in akt-1; mfb-1 mutants, n = 7; p < 0.005 compared with akt-1; Fig. 6C,D). All ALM neurons displayed similar responses to voltage steps, and the MRCs displayed similar voltage dependence (data not shown).
Figure 6.
MRCs in ALM neurons. A–C, Representative MRCs to saturated response in the ALM neurons in wild-type (A), akt-1 (B), and akt-1; mfb-1(C) animals. Gray lines indicate overlays of 20 repeats of stimuli to a single animal. Black lines indicate the average. Red lines below indicate the voltage driving the stimulus probe. D, MRCs of ALM neurons in wild-type, akt-1, and akt-1; mfb-1 animals. *p < 0.0005, compared with wild-type; and p < 0.005, compared with akt-1; mfb-1.
The change in peak MRC in response to saturated stimuli could either be caused by changes in single-channel conductance or by changes in the amount of MEC-4 channels. The current carried by a single channel in akt-1 animals, as estimated by nonstationary noise analysis (Heinemann and Conti, 1992; O'Hagan et al., 2005), was similar to that in wild-type animals (0.8 ± 0.2 pA, n = 4 in akt-1 animals vs 0.7 ± 0.1 pA, n = 5 in wild-type, p = 0.47). These results suggest that changes in single-channel conductance are unlikely to explain the reduction of peak MRC in akt-1 animals and that changes in the amount of MEC-4 channels are the more likely cause of the change in MRC.
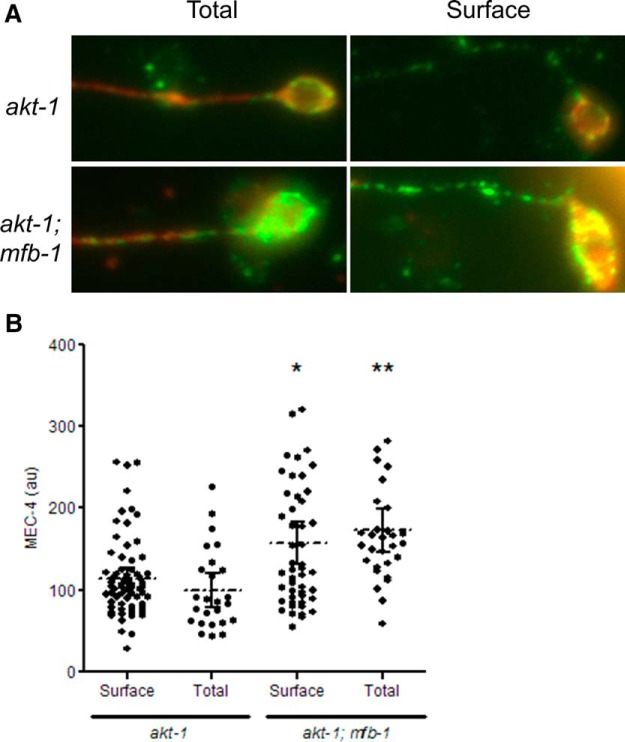
We were unable to detect MEC-4 on the plasma membrane in vivo because permeabilization of the cuticle to allow antibody access to the TRNs would also permeabilize the plasma membrane. Antibody staining to MEC-4 in nonpermeabilized cultured TRNs from akt-1 and akt-1; mfb-1 animals, however, indicated that the surface population of MEC-4 indeed changed to a similar degree to the total population (Fig. 7A,B). These results further support the hypothesis that the change in the saturated MRCs is caused by a change in the amount of surface MEC-4.
Figure 7.
MFB-1 alters surface MEC-4 in cultured TRNs. A, Representative pictures of permeabilized (Total) and nonpermeabilized (Surface) antibody staining of MEC-4 (green) and MEC-18 (red) in the processes of cultured ALM neurons. B, Quantifications of permeabilized (Total) and nonpermeabilized (Surface) antibody staining of MEC-4 in the processes of cultured ALM neurons. *p < 0.05, comparing surface MEC-4 (Welch's test). **p < 0.001, comparing total MEC-4 (Student's t test).
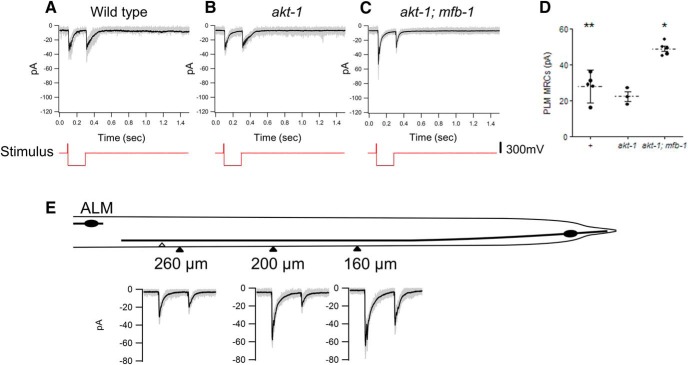
We also examined MRCs in the PLM neurons under these conditions (Fig. 8A–D). The saturated MRCs (28 ± 3 pA, n = 5) we observed in wild-type PLM neurons were smaller than those seen in the wild-type ALM neurons (p < 0.0001; Fig. 8A,D). The values for the PLM neurons were also smaller than those we previously reported for PLM neurons (∼54 pA) (O'Hagan et al., 2005). This latter difference could have been caused by different stimulation sites. In our experiments, we moved the stimulation site to the distal end of the PLM anterior process to reduce mechanical disruption of the pipette seal, which is more severe during saturated stimulation (for details, see Materials and Methods). The long distance between the patch site (i.e., the cell body) and the stimulation site could result in diminished current measurements because the PLM neurons are not isopotential (O'Hagan et al., 2005). In addition, differences in MEC-4 distribution along the PLM process could also result in differences in MRCs elicited at different stimulation sites. Indeed, in one animal where we were able to measure MRCs elicited by stimulation at three positions along the PLM process, there was a 50% reduction in MRCs elicited by stimulation at the distal end than MRCs elicited at closer positions (Fig. 8E). Nonetheless, we feel the reduction relative to the ALM values is significant because even our previous values for the MRCs in the PLM neurons were lower than those we saw in the ALM neurons. Moreover, these data were also consistent with the reduced sensitivity of PLM neurons as measured by calcium imaging (Chen and Chalfie, 2014) and the lower amount of MEC-4 in the PLM processes (Fig. 4F).
Figure 8.
MRCs in PLM neurons. A–C, Representative MRCs to saturated response in the PLM neurons in wild-type (A), akt-1 (B), and akt-1; mfb-1(C) animals. Gray lines indicate overlays of 20 repeats of stimuli to a single animal. Black lines indicate the average. Red lines below indicate the voltage driving the stimulus probe. D, MRCs of PLM neurons in wild-type, akt-1, and akt-1; mfb-1 animals. *p < 0.005, compared with wild-type; and p < 0.0005, compared with akt-1; mfb-1. **p < 0.0001, compared with wild-type ALM MRCs in Figure 6D. E, PLM MRCs elicited by stimulation at different positions in one animal. The vulva is labeled with a white triangle. The approximate positions of the stimulation sites are labeled with black triangles, and the distances to the PLM cell body are labeled beneath with the corresponding MRCs. For the MRCs, gray lines indicate overlays of 20 repeats of stimuli at a specific site, and the black lines indicate the average.
The MRCs in akt-1 and akt-1; mfb-1 PLM neurons were also consistent with the amount of MEC-4 in each mutant: the MRCs in akt-1 PLM neurons (22 ± 3 pA, n = 3; Fig. 8B,D) were not significantly different from wild-type MRCs (p = 0.28 without Bonferroni correction), but akt-1;mfb-1 PLM neurons (49 ± 2 pA, n = 5; Fig. 8C,D) had MRCs larger than both wild-type and akt-1 MRCs (p < 0.0005 compared with akt-1 MRCs and p < 0.005 compared with wild-type MRC). Although the MRCs from the ALM and PLM neurons of akt-1; mfb-1 animals were still different from each other, these results indicate that the amount of MFB-1 significantly accounts for the differences in the touch sensitivity between ALM and PLM neurons.
Discussion
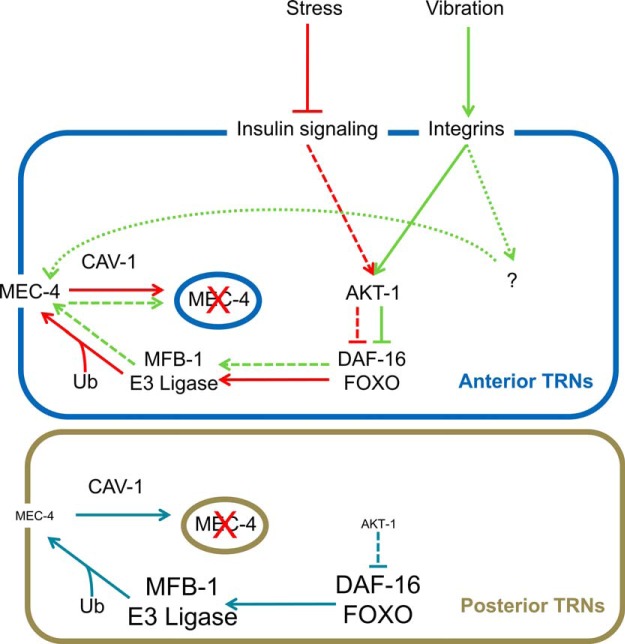
Modulation of sensory transduction through regulating the level of the transduction complex has been shown to occur in several sensory systems, including vision and gustation (Fain et al., 2001; Zhang et al., 2013). Our results indicate that such control also occurs in mechanosensation. Changes in the amount of MEC-4 channels modulate anterior touch sensitivity in the ALM neurons under four conditions (prolonged vibration, hypoxia, high salt, and Dauer formation), which signal through AKT kinases and DAF-16/FOXO (Chen and Chalfie, 2014). This control of the amount of MEC-4 relies on the levels of MFB-1, an E3 ubiquitin ligase needed for the ubiquitination of MEC-4. This mechanism not only regulates anterior touch sensitivity under different environmental conditions but also contributes to reduced PLM sensitivity under normal conditions (Fig. 9).
Figure 9.
Regulation of mechanotransduction in the TRNs. MFB-1-dependent ubiquitination and removal of MEC-4 mediates the change in touch sensitivity by both integrin (green pathway) and insulin signaling (red pathway). Integrin signaling may increase MEC-4 activity through additional pathways (green dotted pathway and “?”). The same pathway also partially contributes to less sensitivity in the posterior TRNs (blue pathway). Dashed lines indicate that the signaling strength is reduced in the specific conditions/cells. Dotted lines indicate the hypothesized pathway. In the posterior TRNs, the size of the labels of proteins indicates the relative abundance (or activity) of that protein compared with the anterior TRNs under normal conditions.
Independent gain control of anterior and posterior sensitivity
In addition to the changes in anterior touch response, the amount of MEC-4 can also account for two differences between the ALM and the PLM neurons: that the PLM neurons are less sensitive than the ALM neurons as measured by both calcium imaging and MRCs (Figs. 6D and 8D) and that the PLM sensitivity is not controlled by reduced insulin signaling (Chen and Chalfie, 2014). Our results suggest that the reduced sensitivity in the PLM neurons is partially caused by having less MEC-4 than the ALM neurons, and that this control of the amount of MEC-4 requires MFB-1. akt-1; mfb-1 animals had both higher MEC-4 levels and bigger MRCs in the PLM neurons even when compared with wild-type PLM neurons, suggesting that MFB-1 keeps MEC-4 levels low in the PLM neurons. Consistent with this hypothesis, mfb-1 transcription is higher in the PLM neurons compared with the ALM neurons (Fig. 2D,F). The difference in the amount of MEC-4, however, may not solely account for the different sensitivity in ALM and PLM neurons because the MRCs in the ALM and PLM neurons of akt-1; mfb-1 animals are still different. This residual difference could partially be explained by the position of the stimulation sites (Fig. 8E). Other differences, such as cell morphology and the expression levels of other genes (C. Zheng and M.C., personal communication), may also contribute to the difference in touch sensitivity.
Nevertheless, the PLM neurons are able to mediate normal touch responses. If the animals have reduced ALM sensitivity similar to the PLM levels, they become partially insensitive to anterior touch (Chen and Chalfie, 2014). This difference in the requirement of sensitivity in the ALM and PLM neurons may reflect differences in the downstream circuits driven by these cells (Chalfie et al., 1985). Indeed, gap junctions between the command interneurons bias the nervous system, so animals usually move forward (Kawano et al., 2011). Because the TRNs are activated by graded sensory potentials, the ALM neurons may need to be depolarized more than the PLM neurons to overcome the bias of the downstream command circuit, thus requiring higher sensitivity to operate normally.
Unlike the anterior touch response, the posterior touch response is not affected by reduced insulin signaling and/or stress conditions (Chen and Chalfie, 2014). Similar to the behavioral responses, only the MRCs in the ALM neurons, not those in the PLM neurons, are affected by akt-1 mutation (Figs. 6D and 8D). Because mfb-1 mutation increases MRCs in akt-1 PLM neurons, the lack of change in touch sensitivity in akt-1 PLM neurons is not caused by differences in the modulatory mechanism for transduction, but by differences in signaling strength. smFISH for akt-1 supports this hypothesis: the PLM neurons express less AKT-1 than the ALM neurons (Fig. 2G), thus leading to increased MFB-1 expression and reduced touch sensitivity. Because insulin signaling activates AKT-1 through phosphorylation, less AKT-1 also leads to less capacity to regulate touch sensitivity, thus rendering the posterior response insensitive to modulation. Different accessibility to signaling peptides, such as INS-10 (Chen and Chalfie, 2014), may also reduce insulin signaling in the PLM neurons.
MFB-1/Atrogin-1 responds to sustained force in diverse systems
AKT-1 and DAF-16 alter touch sensitivity by regulating the transcription of mfb-1. Because mfb-1 transcription depends on AKT-1 and DAF-16, a likely hypothesis is that mfb-1 transcription is regulated by DAF-16. This hypothesis is supported by ModEncode Chip-seq data demonstrating that mfb-1 promoter regions contain several DAF-16 binding sites (Celniker et al., 2009). The relatively slow rate of transcriptional regulation predicts that any condition modulating touch sensitivity through this pathway should also act slowly. Indeed, all four conditions that act through AKT-1 and DAF-16 require >2 h to take effect (Chen and Chalfie, 2014).
Integrin signaling activates AKT-1 to mediate sensitization by sustained vibration (Chen and Chalfie, 2014). This sensitization pathway is conserved in mammalian muscle hypertrophy. Atrogin-1, an MFB-1 homolog, is the target in the mammalian pathway (Sandri et al., 2004; Marino et al., 2008). Although the target proteins for ubiquitination are different in muscle hypertrophy and modulation of touch sensitivity, in both cases integrin signaling and MFB-1/Atrogin-1 modulate the primary function of the cells in response to sustained force. This similarity suggests that integrin signaling through MFB-1/Atrogin-1 may be a conserved force-modulated pathway across species and cell types.
Because a mutation in mfb-1 fully restored anterior touch sensitivity under stress conditions, MFB-1 regulation of MEC-4 is likely the main cause of touch insensitivity under these conditions. Sensitization caused by sustained vibration, however, may not be solely caused by the regulation of mfb-1 transcription. ALM neurons after vibration did show increased MEC-4 expression (Fig. 5A), suggesting that regulation of the amount of MEC-4 may still contribute to sensitization. This hypothesis, however, is hard to confirm electrophysiologically because the time involved in preparing the animals (usually from 30 min to 1 h) may variably negate the effect of sensitization.
Sustained vibration causes a small increase in MEC-4 expression (<50%; Fig. 5A), and this adequately explains the suppression by vibration of the effects of hypoxia, high salt, and the Dauer state. We do not, however, believe that the increase in MEC-4 alone can account for the rapid recovery from habituation seen in animals vibrated for long periods (Chen and Chalfie, 2014). Immediately after prolonged vibration, animals are habituated anteriorly, so simply having somewhat more channels would not be expected to overcome the block to mechanosensation. Other mechanisms may additionally regulate MEC-4 or other TRN activities following prolonged vibration (Fig. 9, “?”). One possible mechanism is through the regulation of deubiquitination pathway and UBH-4. Like mfb-1, ubh-4 expression is controlled by insulin signaling (Matilainen et al., 2013). Although knocking down ubh-4 or its three homologs in C. elegans (ubh-1, ubh-2, and ubh-3) did not reduce touch sensitivity, we cannot rule out the possibility that these genes act redundantly.
Conserved regulation of transduction channels by ubiquitination
MFB-1 modulates touch sensitivity by ubiquitinating and subsequently reducing MEC-4. This modulation, however, does not simply rely on changing the amount of MEC-4 channels because blocking protein degradation alone did not restore touch sensitivity (Fig. 1A). This result suggests that the channels are inactivated before being degraded. Because a mutation in cav-1/caveolin also blocked the reduction of touch sensitivity, we propose that ubiquitination, per se, does not reduce channel activity. Instead, ubiquitination of MEC-4 allows the removal of the channels from the plasma membrane.
The mammalian ENaC channels are similarly regulated by ubiquitination and subsequent caveolin-dependent endocytosis (Bhalla and Hallows, 2008). This system, however, uses a different E3 ligase, Nedd-4.2. Nedd-4-like E3 ligases in C. elegans did not affect the modulation of touch sensitivity, suggesting that multiple E3 ligases may regulate DEG/ENaC channels. The fact that different E3 ligases are used for similar modulation in different systems suggests that the mechanism of channel regulation is more conserved than the specific components involved.
Regulation of sensory transduction through ubiquitination is not limited to mechanosensation and DEG/ENaC channels. For example, Drosophila adapts to bitter taste by reducing TRPL channels in gustatory receptor neurons through ubiquitination (Zhang et al., 2013). In addition, a large number of G-protein coupled receptors are regulated by ubiquitination (Miranda and Sorkin, 2007). Because G-protein coupled receptors are involved directly in diverse sensory transduction, including vision, gustation, and olfaction, ubiquitination may also directly regulate transduction in these senses. Together, these and our findings suggest that ubiquitination-dependent regulation of transduction molecules may be a common mechanism of sensory modulation.
Footnotes
This work was supported by Grant GM30997 to M.C. from the National Institutes of Health. We thank the Caenorhabditis Genetics Center, which is funded by NIH Office of Research Infrastructure Programs (P40 OD010440), and the C. elegans Gene Knockout Consortium for providing strains. We thank Bob O'Hagan for help with the electrophysiology, Liz Miller for suggestions about protein degradation, and Madeleine Durbeej-Hjalt and members of our lab for discussions.
The authors declare no competing financial interests.
References
- Bellanger JM, Cueva JG, Baran R, Tang G, Goodman MB, Debant A. The doublecortin-related gene zyg-8 is a microtubule organizer in Caenorhabditis elegans neurons. J Cell Sci. 2012;125:5417–5427. doi: 10.1242/jcs.108381. [DOI] [PMC free article] [PubMed] [Google Scholar]
- Bhalla V, Hallows KR. Mechanisms of ENaC regulation and clinical implications. J Am Soc Nephrol. 2008;19:1845–1854. doi: 10.1681/ASN.2008020225. [DOI] [PubMed] [Google Scholar]
- Bloomfield SA, Völgyi B. The diverse functional roles and regulation of neuronal gap junctions in the retina. Nat Rev Neurosci. 2009;10:495–506. doi: 10.1038/nrn2636. [DOI] [PMC free article] [PubMed] [Google Scholar]
- Brenner S. The genetics of Caenorhabditis elegans. Genetics. 1974;77:71–94. doi: 10.1093/genetics/77.1.71. [DOI] [PMC free article] [PubMed] [Google Scholar]
- Calixto A, Chelur D, Topalidou I, Chen X, Chalfie M. Enhanced neuronal RNAi in C. elegans using SID-1. Nat Methods. 2010;7:554–559. doi: 10.1038/nmeth.1463. [DOI] [PMC free article] [PubMed] [Google Scholar]
- Castellucci V, Kandel ER. Presynaptic facilitation as a mechanism for behavioral sensitization in Aplysia. Science. 1976;194:1176–1178. doi: 10.1126/science.11560. [DOI] [PubMed] [Google Scholar]
- Cattaert D, Le Bon M, Le Ray D. Efferent controls in crustacean mechanoreceptors. Microsc Res Tech. 2002;58:312–324. doi: 10.1002/jemt.10139. [DOI] [PubMed] [Google Scholar]
- Celniker SE, Dillon LA, Gerstein MB, Gunsalus KC, Henikoff S, Karpen GH, Kellis M, Lai EC, Lieb JD, MacAlpine DM, Micklem G, Piano F, Snyder M, Stein L, White KP, Waterston RH, Waterston RH. Unlocking the secrets of the genome. Nature. 2009;459:927–930. doi: 10.1038/459927a. [DOI] [PMC free article] [PubMed] [Google Scholar]
- Chalfie M, Sulston JE, White JG, Southgate E, Thomson JN, Brenner S. The neural circuit for touch sensitivity in Caenorhabditis elegans. J Neurosci. 1985;5:956–964. doi: 10.1523/JNEUROSCI.05-04-00956.1985. [DOI] [PMC free article] [PubMed] [Google Scholar]
- Chen X, Chalfie M. Modulation of C. elegans touch sensitivity is integrated at multiple levels. J Neurosci. 2014;34:6522–6536. doi: 10.1523/JNEUROSCI.0022-14.2014. [DOI] [PMC free article] [PubMed] [Google Scholar]
- Fain GL, Matthews HR, Cornwall MC, Koutalos Y. Adaptation in vertebrate photoreceptors. Physiol Rev. 2001;81:117–151. doi: 10.1152/physrev.2001.81.1.117. [DOI] [PubMed] [Google Scholar]
- Govindaraju SR, Curry BD, Bain JL, Riley DA. Comparison of continuous and intermittent vibration effects on rat-tail artery and nerve. Muscle Nerve. 2006;34:197–204. doi: 10.1002/mus.20578. [DOI] [PubMed] [Google Scholar]
- Heinemann SH, Conti F. Nonstationary noise analysis and application to patch clamp recordings. Methods Enzymol. 1992;207:131–148. doi: 10.1016/0076-6879(92)07009-D. [DOI] [PubMed] [Google Scholar]
- Holt JR, Corey DP. Two mechanisms for transducer adaptation in vertebrate hair cells. Proc Natl Acad Sci U S A. 2000;97:11730–11735. doi: 10.1073/pnas.97.22.11730. [DOI] [PMC free article] [PubMed] [Google Scholar]
- Hudspeth AJ. Making an effort to listen: mechanical amplification in the ear. Neuron. 2008;59:530–545. doi: 10.1016/j.neuron.2008.07.012. [DOI] [PMC free article] [PubMed] [Google Scholar]
- Kawano T, Po MD, Gao S, Leung G, Ryu WS, Zhen M. An imbalancing act: gap junctions reduce the backward motor circuit activity to bias C. elegans for forward locomotion. Neuron. 2011;72:572–586. doi: 10.1016/j.neuron.2011.09.005. [DOI] [PubMed] [Google Scholar]
- Kujawa SG, Liberman MC. Long-term sound conditioning enhances cochlear sensitivity. J Neurophysiol. 1999;82:863–873. doi: 10.1152/jn.1999.82.2.863. [DOI] [PubMed] [Google Scholar]
- Marino JS, Tausch BJ, Dearth CL, Manacci MV, McLoughlin TJ, Rakyta SJ, Linsenmayer MP, Pizza FX. β2-Integrins contribute to skeletal muscle hypertrophy in mice. Am J Physiol Cell Physiol. 2008;295:C1026–C1036. doi: 10.1152/ajpcell.212.2008. [DOI] [PubMed] [Google Scholar]
- Matilainen O, Arpalahti L, Rantanen V, Hautaniemi S, Holmberg CI. Insulin/IGF-1 signaling regulates proteasome activity through the deubiquitinating enzyme UBH-4. Cell Rep. 2013;3:1980–1995. doi: 10.1016/j.celrep.2013.05.012. [DOI] [PubMed] [Google Scholar]
- Miranda M, Sorkin A. Regulation of receptors and transporters by ubiquitination: new insights into surprisingly similar mechanisms. Mol Interv. 2007;7:157–167. doi: 10.1124/mi.7.3.7. [DOI] [PubMed] [Google Scholar]
- O'Hagan R, Chalfie M, Goodman MB. The MEC-4 DEG/ENaC channel of Caenorhabditis elegans touch receptor neurons transduces mechanical signals. Nat Neurosci. 2005;8:43–50. doi: 10.1038/nn1362. [DOI] [PubMed] [Google Scholar]
- Reynolds JH, Chelazzi L. Attentional modulation of visual processing. Annu Rev Neurosci. 2004;27:611–647. doi: 10.1146/annurev.neuro.26.041002.131039. [DOI] [PubMed] [Google Scholar]
- Robles L, Ruggero MA. Mechanics of the mammalian cochlea. Physiol Rev. 2001;81:1305–1352. doi: 10.1152/physrev.2001.81.3.1305. [DOI] [PMC free article] [PubMed] [Google Scholar]
- Sandri M, Sandri C, Gilbert A, Skurk C, Calabria E, Picard A, Walsh K, Schiaffino S, Lecker SH, Goldberg AL. Foxo transcription factors induce the atrophy-related ubiquitin ligase atrogin-1 and cause skeletal muscle atrophy. Cell. 2004;117:399–412. doi: 10.1016/S0092-8674(04)00400-3. [DOI] [PMC free article] [PubMed] [Google Scholar]
- Schneider CA, Rasband WS, Eliceiri KW. NIH Image to ImageJ: 25 years of image analysis. Nat Methods. 2012;9:671–675. doi: 10.1038/nmeth.2089. [DOI] [PMC free article] [PubMed] [Google Scholar]
- Topalidou I, van Oudenaarden A, Chalfie M. Caenorhabditis elegans aristaless/Arx gene alr-1 restricts variable gene expression. Proc Natl Acad Sci U S A. 2011;108:4063–4068. doi: 10.1073/pnas.1101329108. [DOI] [PMC free article] [PubMed] [Google Scholar]
- Walhout AJM, Boulton SJ Biochemistry and molecular biology. WormBook, ed. The C. elegans Research Community, WormBook. 2006. Feb 13, http://www.wormbook.org.
- Wersinger E, Fuchs PA. Modulation of hair cell efferents. Hear Res. 2011;279:1–12. doi: 10.1016/j.heares.2010.12.018. [DOI] [PMC free article] [PubMed] [Google Scholar]
- Zhang S. New York: Columbia UP; 2004. Stomatin gene family in Caenorhabditis elegans. [Google Scholar]
- Zhang YV, Raghuwanshi RP, Shen WL, Montell C. Food experience-induced taste desensitization modulated by the Drosophila TRPL channel. Nat Neurosci. 2013;16:1468–1476. doi: 10.1038/nn.3513. [DOI] [PMC free article] [PubMed] [Google Scholar]


