Abstract
Objectives
Industry and occupation variables are overlooked in many public health surveillance efforts, yet they are useful for describing the burden and distribution of various public health diseases, behaviors, and conditions. This study is the first ever analysis of the Colorado Behavioral Risk Factor Surveillance System (BRFSS) to describe chronic conditions and risk behaviors by occupation. It is intended to provide a new perspective on this existing data source and demonstrate the value of occupation as a core demographic variable for public health research, policy, and practice.
Methods
Two standardized employment questions were included in the 2012 Colorado BRFSS survey and administered to eligible survey respondents who were employed, self-employed, or out of work for less than one year. Occupation data were coded using the National Institute for Occupational Safety and Health (NIOSH) Industry and Occupation Computerized Coding System. We analyzed health behaviors and conditions by major occupation groups. We calculated prevalence estimates and 95% confidence intervals (CIs).
Results
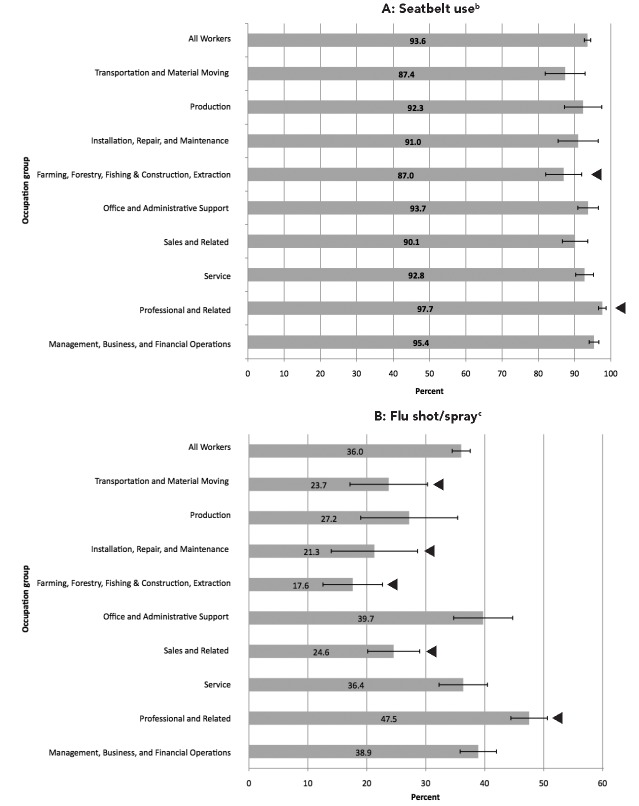
The prevalence of chronic conditions, health statuses, and risk behaviors (e.g., smoking and seatbelt use) varied significantly by occupation. For example, compared with all workers (93.6%, 95% CI 92.7, 94.5), significantly fewer workers in farming, forestry, fishing and construction, extraction jobs (87.0%, 95% CI 82.0, 92.0) reported always or nearly always wearing a seatbelt while driving. Additionally, significantly more office and administrative support workers (27.5%, 95% CI 22.5, 32.4) compared with all workers (20.6%, 95% CI 19.3, 22.0) were obese. Further observation and research is needed to understand the effects of occupation on health outcomes and behaviors.
Conclusion
There are no other Colorado state-level datasets that link health behaviors and chronic conditions with occupation. This study shows that the prevalence of chronic conditions and risk behaviors varies substantially by occupation. Other states conducting the BRFSS may choose to adopt the NIOSH industry and occupation module and add other questions to further investigate health issues by occupation.
Civilian workers in the U.S. spend up to 50% of their waking lives at work or commuting, yet industry and occupation variables are overlooked in many public health surveillance systems.1–4 This oversight not only poses a challenge for surveillance of work-related injury and illness, but also reduces the ability to examine associations between work and chronic conditions, as well as health behaviors and infectious diseases. Recent state efforts to include industry and occupation questions in the Centers for Disease Control and Prevention (CDC) Behavioral Risk Factor Surveillance System (BRFSS) survey have provided data needed to profile the health status of the workforce and describe specific risk factors and health conditions by industrial sector and occupation groups.5–12 Surveillance efforts that include indicators of disease, injury, and occupation provide opportunities to more specifically describe relationships between work and numerous other factors including health status, chronic diseases, and health behaviors. These examinations can suggest targeted work-related populations and inform public health interventions and prevention efforts.
The BRFSS is a random-digit-dial telephone survey of the U.S. adult population aged ≥18 years that is administered annually to households with landline and cellular telephones by state health departments in collaboration with CDC.13,14 The survey comprises three parts: core survey questions, optional modules, and state-added questions. It collects data on health-risk behaviors, chronic diseases and conditions, access to health care, and use of preventive health services and practices. Since its inception in the 1980s, the only question about employment asked of all survey respondents nationwide has been regarding employment status (e.g., employed, student, or retired). The National Institute for Occupational Safety and Health (NIOSH) recently standardized two questions for the BRFSS that collect information about respondents' current or most recent job. The Occupational Health and Safety Surveillance Program at the Colorado Department of Public Health and Environment sponsored inclusion of these two NIOSH-standard questions as a state-added question on the 2012 Colorado BRFSS. This article summarizes key findings from these new BRFSS data and demonstrates that the prevalence of health statuses, health behaviors, and chronic conditions varies by occupation.
METHODS
All Colorado 2012 BRFSS respondents who indicated that their current employment status was employed for wages, self-employed, or out of work for less than one year were asked two additional questions: (1) What kind of business or industry do you work in? and (2) What is your job title? Verbatim responses were documented during the interview and later coded by trained NIOSH staff to the 2000 Census Industry and Occupation classification schemes using the NIOSH Industry and Occupation Computerized Coding System and supplemental manual.15 The Census classification schemes were developed using the structures of the North American Industry Classification System and the Standard Occupation Classification system. These coding systems are federally recognized as the gold standard for classifying industry and occupation data into categories and groups suitable for statistical analysis and comparison.16,17 For our analysis, we created 10 broad occupation groups based on the 2000 Census occupation codes and following an approach commonly used in public health research and surveillance.18–20 Two occupation groups (farming, forestry, fishing and construction, extraction) were combined for analysis due to small sample size in each category (Figure 1).
Figure 1.
Examples of occupations contained within 10 major census occupation groups used to analyze the Colorado Behavioral Risk Factor Surveillance System, 2012
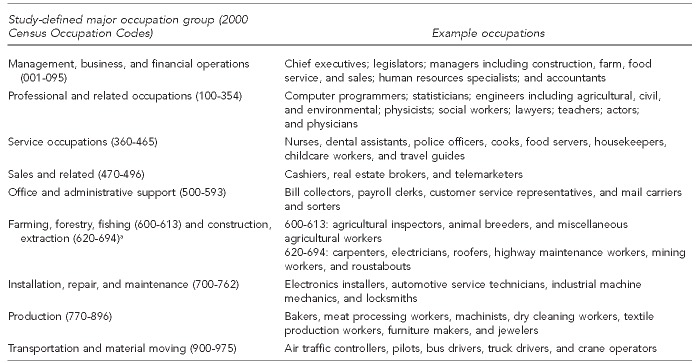
aThese two major occupation groups were combined for analysis due to small sample sizes.
This analysis was broad in scope, spanning all occupations and covering a variety of public health topics. We limited our analysis to the select BRFSS core survey questions, which remain consistent from year to year and are the same across states. We conducted occupation grouping and summary analyses using Microsoft® Excel® and SAS® version 9.3.21 The BRFSS data were weighted using a statistical process known as iterative proportional fitting (also known as “raking” weighting).22 We calculated prevalence estimates and 95% confidence intervals (CIs) by select occupation groups. In this article, any difference noted as statistically different or significant indicated that the 95% CIs for weighted percentages did not overlap.
RESULTS
Demographics
The response rate for the Colorado BRFSS was 65.9%. Of the 12,191 total respondents, 6,933 (56.9%) indicated they were employed or out of work for less than one year. This study population was predominantly male (55.6%, 95% CI 54.1, 57.1) and non-Hispanic white (72.7%, 95% CI 71.2, 74.2). About 68.2% of workers in the study had at least some college education, and most (67.5%) were aged 25–54 years (Table 1).
Table 1.
Distribution of demographic characteristics among employed and unemployed adults: Colorado Behavioral Risk Factor Surveillance System, 2012a
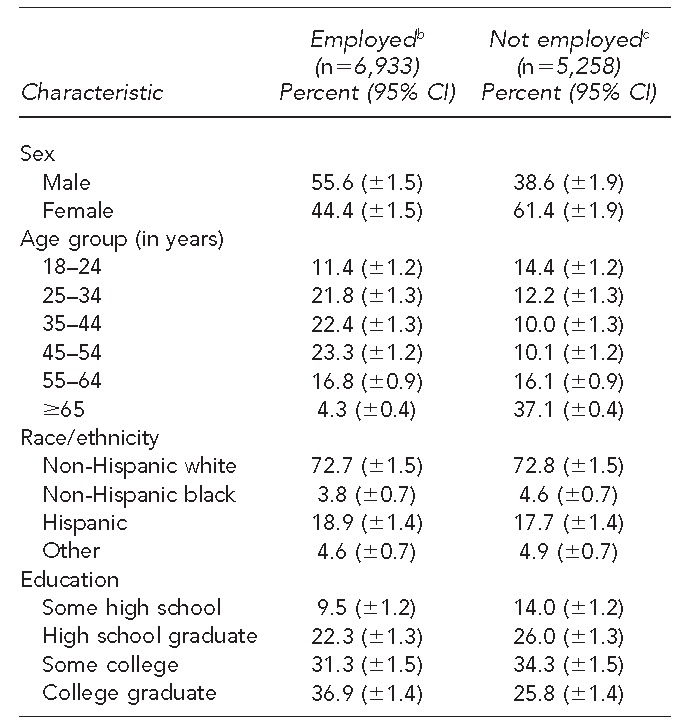
Source: Health Statistics Section, Colorado Department of Public Health and Environment
bPeople who reported employment status as “currently employed for wages,” “self-employed,” or “out of work for less than one year”
cThe nonworking population is included in this table for comparison.
CI = confidence interval
Health behaviors associated with occupational risks
Overall, 93.6% (95% CI 92.7, 94.5) of all workers reported always or nearly always wearing a seatbelt. However, the prevalence of seatbelt use was -significantly lower among workers in farming, forestry, fishing and construction, extraction jobs (87.0%, 95% CI 82.0, 92.0) than among those in other occupations. In contrast, the prevalence of seatbelt use was significantly higher among professional occupations (97.7%, 95% CI 96.6, 98.7) (Figure 2A). Additionally, while the prevalence of influenza vaccination among all workers was 36.0% (95% CI 34.5, 37.5), significantly fewer workers in farming, forestry, fishing and construction, extraction jobs (17.6%, 95% CI 12.6, 22.7); sales (24.6%, 95% CI 20.1, 29.0); installation, repair, and maintenance (21.3%, 95% CI 14.0, 28.6); and transportation and material moving (23.7%, 95% CI 17.1, 30.3) received a flu shot or nasal spray. The prevalence of flu vaccination was significantly higher in those working in professional occupations (47.5%, 95% CI 44.4, 50.6) (Figure 2B).
Figure 2.
Prevalence of selected health behaviors among employed adults, by occupation: Colorado Behavioral Risk Factor Surveillance System, 2012a
Note: Error bars represent the 95% confidence intervals (CIs) and t indicates significant 95% CI compared with all workers in the survey (p<0.05).
aSource: Health Statistics Section, Colorado Department of Public Health and Environment
bAlways or nearly always wear a seatbelt
cReceived a seasonal flu shot or nasal spray in the past 12 months
Health behaviors associated with morbidity and mortality
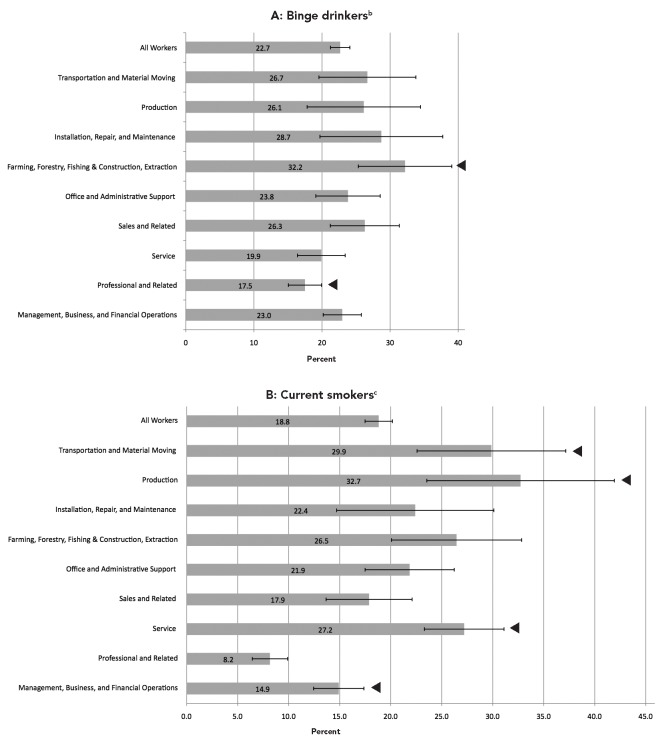
Overall, 22.7% (95% CI 21.2, 24.1) of all workers reported binge drinking in the previous month. The prevalence of binge drinking was significantly higher among workers in farming, forestry, fishing and construction, extraction jobs (32.2%, 95% CI 25.3, 39.1), but significantly lower among workers in professional occupations (17.5%, 95% CI 15.1, 19.9) (Figure 3A). Additionally, while about 18.8% (95% CI 17.5, 20.2) of all workers reported being current smokers, the prevalence of current smoking was significantly higher among service (27.2%, 95% CI 23.3, 31.1), transportation and material moving (29.9%, 95% CI 22.6, 37.2), and production (32.7%, 95% CI 23.5, 41.9) occupations. Significantly fewer workers in professional occupations (8.2%, 95% CI 6.4, 9.9) and management, business, and financial occupations (14.9%, 95% CI 12.4, 17.4) reported being current smokers (Figure 3B).
Figure 3.
Prevalence of selected health behaviors associated with morbidity and mortality among employed adults, by occupation: Colorado Behavioral Risk Factor Surveillance System, 2012a
Note: Error bars represent the 95% confidence intervals (CIs) and t indicates significant 95% CI compared with all workers in the survey (p<0.05).
aSource: Health Statistics Section, Colorado Department of Public Health and Environment
bBinge drinkers refers to males having ≥5 drinks on one occasion and females having ≥4 drinks on one occasion in the past 30 days.
cCurrent smokers refers to everyday smoker (now smokes every day) + some day smoker (now smokes some days).
Health status of Colorado's workforce
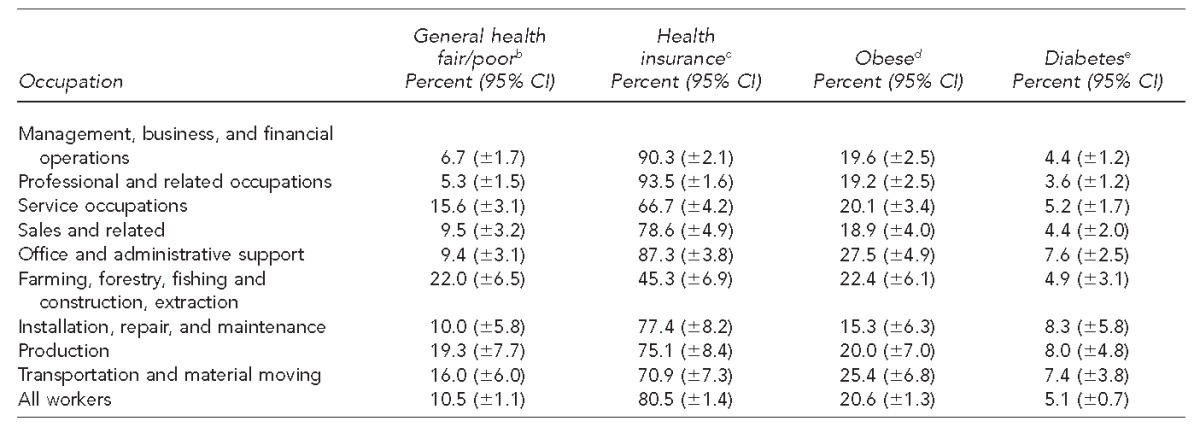
About 10.5% (95% CI 9.4, 11.6) of all workers reported their general health as fair or poor. This prevalence was significantly higher among workers in farming, forestry, fishing and construction, extraction (22.0%, 95% CI 15.5, 28.5), and service (15.6%, 95% CI 12.5, 18.7) professions. Workers in farming, forestry, fishing and construction, extraction (45.3%, 95% CI 38.4, 52.2); service (66.7%, 95% CI 62.5, 70.8); and transportation and material moving (70.9%, 95% CI 63.6, 78.2) were also less likely to have health insurance compared with all workers (80.5%, 95% CI 79.1, 82.0). The prevalence of obesity also varied significantly by occupation; 27.5% (95% CI 22.5, 32.4) of workers in office and administrative support jobs were obese compared with only 20.6% (95% CI 19.3, 22.0) of workers overall. The prevalence of diabetes did not vary significantly by occupation, ranging from 3.6% to 8.3% (Table 2).
Table 2.
Prevalence of selected health status measures among employed adults, by occupation: Colorado Behavioral Risk Factor Surveillance System, 2012a
Source: Health Statistics Section, Colorado Department of Public Health and Environment
bReport general health as fair or poor
cHave any health insurance coverage
dHave a body mass index ≥30 kilograms per meter squared, calculated from self-reported height and weight
eHave ever been told by a health-care provider that they have diabetes
CI = confidence interval
DISCUSSION
BRFSS industry and occupation data can be useful in a variety of public health topic areas. This analysis previews the realm of possibilities to use these data for targeted health promotion, safety intervention, and wellness education and activities.
Transportation events are widely known as a leading cause of fatal and nonfatal occupational injury.23,24 Occupation data in the BRFSS provide an opportunity to further investigate this occupational hazard by documenting workers' use of seatbelts. Fewer workers in farming, forestry, fishing and construction, extraction jobs reported always or nearly always wearing a seatbelt while driving, and transportation and material moving workers reported a similarly low prevalence of seatbelt use. Documenting this lower prevalence of seatbelt use in certain occupations provides the impetus to develop education and intervention strategies tailored for these workers.
Data in this study also show that influenza vaccination varies substantially by occupation. Respondents in the occupations of sales and related; farming, forestry, fishing and construction, extraction; installation, repair, and maintenance; and transportation and material moving reported a significantly lower prevalence of receiving a flu shot or nasal spray in the previous 12 months compared with those in other occupations. Certain health-care workers are at higher risk for influenza exposure and transmission. Colorado is one of several states with new legislation requiring influenza vaccination of employees in licensed health-care entities.25 In addition to serving as a source to monitor influenza vaccination rates among health-care workers, more detailed analysis of BRFSS occupation data can provide information about vaccination rates among other high-transmission-risk workers, such as childcare, food service, and emergency response workers.
Substantial differences in smoking prevalence have been observed across occupation and industry in national survey data.26 With BRFSS occupation data in Colorado, the distribution of smoking prevalence and other health behaviors across occupations and industries can be investigated. Our analysis demonstrates that prevalence of both smoking and binge-drinking behavior varies dramatically across occupation, and that occupation trends are similar for each behavior (Figure 3). More in-depth analyses of these findings with subsequent years of data and in combination with other demographic variables will provide the opportunity to more accurately identify target audiences for public health campaigns.
Public health practitioners and researchers can also use BRFSS occupation data to inform worksite wellness and health promotion efforts. In this study, the overall prevalence of the Colorado workforce who reported general health as fair or poor was 10.5%, but there were certain occupation groups that stood out above this rate, such as farming, forestry, fishing and construction, extraction workers and service workers. These two groups of workers, along with transportation and material moving workers, also reported a significantly lower prevalence of having health insurance. More research is needed to understand the correlations among health status, insurance, and occupation. However, at least one recent study demonstrated that people with health insurance were more likely to be in good, very good, or excellent health compared with those who lacked health insurance.27,28 In addition to providing the opportunity for a more complete understanding of these issues, these BRFSS occupation data can also be used to identify workers who may be in most need of information about the health insurance Exchange marketplaces.
This study also demonstrated differences in the -prevalence of obesity across occupations. A more detailed analysis of a similar observation in the Washington State BRFSS confirmed that obesity prevalence varies by occupation even after adjusting for relevant demographic and health behavior covariants.8 This finding reinforces the concept that BRFSS occupation data provide the opportunity for public health researchers and policy makers to develop and implement targeted strategies for health and wellness promotion.
Limitations
The results of this analysis were subject to the limitations of telephonic, self-report survey data, including recall and response bias, and interviewer and recording errors leading to misclassification. Although the response rate for the 2012 Colorado BRFSS was only 65.9%, BRFSS data have been recognized as a reliable and valid data source for several well-studied health topics.29 Also, none of the observations in this analysis were controlled for other possible confounding or modifying variables. As such, these cross-sectional study results should be interpreted simply as observations describing the burden and distribution of health outcomes and behaviors, and not as evidence for causality. Additionally, because this study used major occupational groups, there may have been substantial variability in the working conditions experienced by individuals in each defined group. Analysis using more detailed occupation groups is needed to draw conclusions regarding the implications of occupation for the various health outcomes and behaviors described.
CONCLUSION
This study provides a one-year, broad overview of the health status and behaviors observed in Colorado workers. Ongoing state-level collection of BRFSS occupation data will be helpful in assessing the need for and effectiveness of public health programs, policies, and practices that protect the working-age population. Subsequent years of occupation data collected through the BRFSS will increase the precision of population estimates, allow for more detailed analysis, and provide the opportunity to observe trends over time.
Occupation data in the BRFSS can provide public health practitioners with a more complete understanding of the burden and distribution of health behaviors and outcomes. This study shows that the prevalence of chronic conditions and risk behaviors, such as smoking and seatbelt use, varies by occupation. Similar data are not available from an alternate source. There are no other Colorado state-level surveillance resources that link health behaviors and population prevalence of chronic conditions with occupation. Analysis of these associations can lead to targeted outreach, education, and intervention for a variety of injury prevention and health promotion programs, as well as identify topics in need of more research. States may choose to adopt the CDC/NIOSH industry and occupation module in their BRFSS and include other state-added questions to further investigate health issues of the working public.
Footnotes
This publication was supported in part by Cooperative Agreement #5U60OH00 9842-05 from the National Institute of Occupational Safety and Health (NIOSH). Its contents are solely the responsibility of the authors and do not necessarily represent the official views of the Centers for Disease Control and Prevention-NIOSH.
REFERENCES
- 1.Department of Health and Human Services (US) Healthy people 2020 topics and objectives: occupational safety and health [cited 2014 Feb 10] Available from: URL: http://healthypeople.gov/2020/topicsobjectives2020/overview.aspx?topicid=30#one.
- 2.Shire JD, March GM, Talbott EO, Sharma RK. Advances and themes in occupational and environmental health surveillance. Annu Rev Public Health. 2011;32:109–32. doi: 10.1146/annurev-publhealth-082310-152811. [DOI] [PubMed] [Google Scholar]
- 3.Boulton ML, Hadler JL, Ferland L, Chao E, Lemmings J. Assessment of epidemiology capacity in state health departments—United States, 2009. MMWR Morb Mortal Wkly Rep. 2009;58(49):1373–7. [PubMed] [Google Scholar]
- 4.Melton GB, Manaktala S, Sarkar IN, Chen ES. Social and behavioral history information in public health datasets. AMIA Annu Symp Proc. 2012;2012:625–34. [PMC free article] [PubMed] [Google Scholar]
- 5.Massachusetts Department of Public Health. On-the-job exposure to environmental tobacco smoke (ETS) in Massachusetts. Occupational Lung Disease Bulletin Fall 2013 [cited 2014 Mar 6] Available from: URL: http://www.mass.gov/eohhs/docs/dph/occupational-health/sensor-lung-disease-bulletins/fall2013.pdf.
- 6.Anderson NJ, Bonauto DK, Fan ZJ, Spector JT. Distribution of influenza-like illness (ILI) by occupation in Washington State, September 2009–August 2010. PLoS One. 2012;7:e48806. doi: 10.1371/journal.pone.0048806. [DOI] [PMC free article] [PubMed] [Google Scholar]
- 7.Fan ZJ, Bonauto DK, Foley MP, Anderson NJ, Yragui NL, Silverstein BA. Occupation and the prevalence of current depression and frequent mental distress, Washington BRFSS 2006 and 2008. Am J Ind Med. 2012;55:893–903. doi: 10.1002/ajim.22094. [DOI] [PubMed] [Google Scholar]
- 8.Bonauto DK, Lu D, Fan ZJ. Obesity prevalence by occupation in Washington State, Behavioral Risk Factor Surveillance System. Prev Chronic Dis. 2014;11:130219. doi: 10.5888/pcd11.130219. [DOI] [PMC free article] [PubMed] [Google Scholar]
- 9.Fan ZJ, Anderson NJ, Foley M, Rauser E, Silverstein BE. The persistent gap in health-care coverage between low- and high-income workers in Washington State: BRFSS, 2003–2007. Public Health Rep. 2011;126:690–9. doi: 10.1177/003335491112600511. [DOI] [PMC free article] [PubMed] [Google Scholar]
- 10.Stanbury M, Rafferty AP, Rosenman K. Prevalence of hearing loss and work-related noise-induced hearing loss in Michigan. J Occup Environ Med. 2008;50:72–9. doi: 10.1097/JOM.0b013e31815b568c. [DOI] [PubMed] [Google Scholar]
- 11.Jarman DW, Naimi TS, Pickard SP, Daley WR, De AK. Binge drinking and occupation, North Dakota, 2004–2005. Prev Chronic Dis. 2007;4:A94. [PMC free article] [PubMed] [Google Scholar]
- 12.Park H, Sprince NL, Jensen C, Whitten P, Zwerling C. Health risk factors and occupation among Iowa workers. Am J Prev Med. 2001;21:203–8. doi: 10.1016/s0749-3797(01)00353-1. [DOI] [PubMed] [Google Scholar]
- 13.Centers for Disease Control and Prevention (US) About the Behavioral Risk Factor Surveillance System (BRFSS) [cited 2014 Mar 6] Available from: URL: http://www.cdc.gov/brfss/about/about_brfss.htm.
- 14.Xu F, Town M, Balluz LS, Bartoli WP, Murphy W, Chowdhury PP, et al. Surveillance for certain health behaviors among states and selected local area—United States, 2010. MMWR Morb Mortal Wkly Rep. 2013;62(SS1):1–247. [PubMed] [Google Scholar]
- 15.Centers for Disease Control and Prevention (US) Industry and occupation coding: NIOCCS system overview [cited 2014 Mar 6] Available from: URL: http://www.cdc.gov/niosh/topics/coding/overview.html.
- 16.Bureau of Labor Statistics (US) North American Industry Classification System (NAICS) at BLS [cited 2014 Mar 6] Available from: URL: http://www.bls.gov/bls/naics.htm.
- 17.Bureau of Labor Statistics (US) Standard Occupational Classification (SOC) system [cited 2014 Mar 6] Available from: URL: http://www.bls.gov/soc.
- 18.Census Bureau (US) Industry and occupation: occupation [cited 2014 Mar 6] Available from: URL: http://www.census.gov/people/io/about/occupation.html.
- 19.Kogevinas M. Commentary: standardized coding of occupational data in epidemiological studies. Int J Epidemiol. 2003;32:428–9. doi: 10.1093/ije/dyg087. [DOI] [PubMed] [Google Scholar]
- 20.Mannetje A, Kromhout H. The use of occupation and industry classifications in general population studies. Int J Epidemiol. 2003;32:419–28. doi: 10.1093/ije/dyg080. [DOI] [PubMed] [Google Scholar]
- 21.SAS Institute, Inc. SAS®: Version 9.3 for Windows. Cary (NC): SAS Institute, Inc.; 2011. [Google Scholar]
- 22.Pierannunzi C, Town M, Garvin W, Shaw FE, Balluz L. Methodologic changes in the Behavioral Risk Factor Surveillance System in 2011 and potential effects on prevalence estimates. MMWR Morb Mortal Wkly Rep. 2012;61(22):410–3. [PubMed] [Google Scholar]
- 23.Department of Labor (US), Bureau of Labor Statistics. Census of Fatal Occupational Injuries (CFOI)—current and revised data [cited 2014 Mar 6] Available from: URL: http://www.bls.gov/iif/oshcfoi1.htm.
- 24.Department of Labor (US), Bureau of Labor Statistics. Nonfatal occupational injuries and illnesses requiring days away from work, 2012 [news release] 2013 Nov 26 [cited 2014 Nov 12] Available from: URL: http://www.bls.gov/news.release/pdf/osh2.pdf.
- 25. 6 CCR 1011-1 Ch. 2, Part 10.
- 26.Syamlal G, Mazurek JM, Malarcher AM. Current cigarette smoking prevalence among working adults—United States, 2004–2010. MMWR Morb Mortal Wkly Rep. 2011;60(38):1305–9. [PubMed] [Google Scholar]
- 27.Allen H, Baicker K, Finkelstein A, Taubman S, Wright BJ. What the Oregon Health Study can tell us about expanding Medicaid. Health Aff (Millwood) 2010;29:1498–506. doi: 10.1377/hlthaff.2010.0191. [DOI] [PMC free article] [PubMed] [Google Scholar]
- 28.Baicker K, Finkelstein A. The effects of Medicaid coverage: learning from the Oregon experiment. N Engl J Med. 2011;365:683–5. doi: 10.1056/NEJMp1108222. [DOI] [PMC free article] [PubMed] [Google Scholar]
- 29.Pierannunzi C, Hu SS, Balluz L. A systematic review of publications assessing reliability and validity of the Behavioral Risk Factor Surveillance System (BRFSS), 2004–2011. BMC Med Res Methodol. 2013;13:49. doi: 10.1186/1471-2288-13-49. [DOI] [PMC free article] [PubMed] [Google Scholar]


