

Abstract
AIM: To explore the difference between cancer cells and normal cells, we investigated the Raman spectra of single cells from gastrointestinal cancer patients.
METHODS: All samples were obtained from 30 diagnosed as gastrointestinal cancer patients. The flesh tumor specimen is located in the center of tumor tissue, while the normal ones were 5 cm away from the outside tumor section. The imprint was put under the micros-cope and a single cell was chosen for Raman measure-ment. All spectra were collected at confocal Raman micro-spectroscopy (British Renishaw) with NIR 780 nm laser.
RESULTS: We measured the Raman spectra of several cells from gastrointestinal cancer patients. The result shows that there exists the strong line at 1002 /cm with less half-width assigned to the phenylalanine in several cells. The Raman lines of white cell were lower and less, while those of red cell were not only higher in intensity and more abundant, but also had a parti-cular C-N breathing stretching band of pyrrole ring at 1620-1540 /cm. The line at 1084 /cm assigned to phosphate backbone of DNA became obviously weaker in cancer cell. The Raman spectra of stomach cancer cells were similar to those of normal cells, but the Raman intensity of cancer cells was much lower than that of normal cells, and even some lines disappear. The lines of enteric cancer cells became weaker than spectra above and many lines disappeared, and the cancer cells in different position had different fluorescence intensity.
CONCLUSION: The Raman spectra of several cells from cancer patients show that the structural changes of cancer cells happen and many bonds rupture so that the biological function of cells are lost. The results indicate that Raman spectra can offer the experiment basis for the cancer diagnosis and treatment.
Keywords: Raman spectra, Gastrointestinal cancer
INTRODUCTION
Cancer is one of the most serious diseases threatening human health and life, and the influence of this disease becomes increasing. Due to the pathogeny of cancer and some correlative illness have not been found, and the effective diagnosis and complete therapy cannot be carried out at present. It is impossible to control the progress of the state of the illness for cancer patient in terminal stages. Therefore, early diagnosis and timely therapy is the most effective approach in improving the surviving chance of patient. It is very difficult to diagnose cancer in modality because the early symptom of cancer is not evident and it has no distinct difference from that of some other illness. Therefore, it is a research emphasis to find new, effective diagnosis technology and treatment method.
The vibration spectrum has promising potential as an analytical tool for diagnosing cancer because it can probe the chemical composition and molecular structure of the normal and pathological tissue, so that researchers have paid much attention to the field over the past decade[1-5]. The Raman method has the relative lower requirement to the preparation of sample, ordinary biological sample such as cell, living tissue, DNA and RNA can be measured directly. The measurement has no damage to sample and a large number of data can easily be obtained. Therefore, many application of Raman spectrum have been gained in biology, medicine, medicament analysis and filtration[6-10]. But to date, there is some lack of knowledge about the Raman spectra of a single cancer cell in the former reports. In the present paper, we report a study about the Raman spectra of single cells of stomach, rectal, and colon cancer tissue and corresponding normal cells.
MATERIALS AND METHODS
All samples were collected from the imprint with desquamation cells from fresh sample after operating on 30 diagnosed patients of Liaocheng People’s Hospital (20 men and 10 women, of ages 30-70 years). The tumor specimens were taken from the part of cancer tissue, the normal samples were 5 cm away from the outside cancer tissue. The residual samples after the patches were marked were stained and sliced so as to be analyzed and diagnosed in pathology.
All spectra were collected at confocal Raman micro-spectroscopy (British Renishaw), with NIR 780 nm laser whose power was maintained at 25 mW and the spectral resolution was less than 2 /cm.
RESULTS
The Raman spectra of single red cell and a string of red cell are shown in Figure 1A. The red cell is mainly composed of membrane and cytoplasm which has a large number of hemoglobin. We can see that hemoglobin has a typical band at 1620-1540 /cm in Figure 1A, which is assigned to C-N breathing stretching band of pyrrole ring. This band cannot be measured in other cells. There exists the peak at 1654 /cm assigned to α-helix, which has low intensity, but the peaks assigned to β-folding and random coil are not found. The band of amide-III at 1246 /cm is wide and strong, which is assigned to the overlapping of α-helix, β-folding and random coil. The Raman lines at 1447, 1369 and 1340 /cm correspond to the deformation vibration of CH2 and CH3. The strong line with 4 /cm half-width at 1001 /cm assigned to the phenylalanine is very steady and can be used as a standard line with respect to other Raman lines. The frequencies of other Raman lines and their assignment are shown in Table 1.
Figure 1.
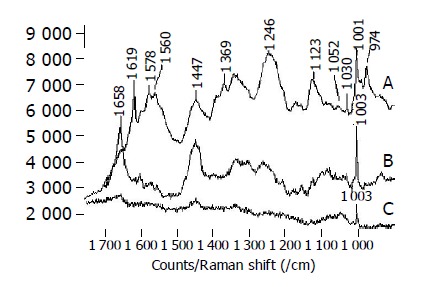
Raman spectra of several cells from cancer patients. A: red cell; B: lymphocyte; C: white cell.
Table 1.
Peak position and assignments of Raman spectra of several cells from cancer patients.
| Red cell | White cell | Lymphocyte | Normal cell | Colon, rectal cancer cell | Stomach cancer cell | Assignments |
| 1654 | 1658 | 1658 | 1657 | 1662 | 1660 | Amide-I , a-helix |
| 1619 | Tyr, Trp v (C = C) | |||||
| 1578 | Phe v (C = C) symmetric | |||||
| 1560 | Trp | |||||
| 1548 | Trp | |||||
| 1447 | 1445 | 1447 | 1449 | 1449 | 1449 | d(CH2, CH3) |
| 1369 | dCH2 | |||||
| 1340 | 1338 | 1338 | 1342 | dCH2 | ||
| 1246 | 1247 | 1247 | 1248 | Amide-III | ||
| 1209 | 1208 | 1206 | Tyr, Phe | |||
| 1123 | 1126 | 1126 | 1126 | v (C-N) | ||
| 1084 | 1084 | v (C-N) | ||||
| 1052 | 1053 | 1054 | 1054 | v (C-N) | ||
| 1030 | 1032 | 1032 | 1032 | Phe v (C-H) | ||
| 1001 | 1003 | 1003 | 1003 | 1002 | 1002 | Phe v (C-C) symmetric |
| Symmetric | ||||||
| 974 | CH2 | |||||
| 936 | 937 | 936 | 938 | v (CC)skeletal a-helix |
The Raman spectra of single white cell are shown in Figure 1B. Its peaks are very weak except the band of phenylalanine at 1003 /cm.
The Raman spectra of lymphocyte are shown in Figure 1C. We can see the wide and strong band at 1658 /cm, which is assigned to the characteristic vibration of Amide-I and may be correlated to the overlapping of α-helix, β-sheet and random coil. The strong Raman lines at 1447 /cm corresponds to the deformation of CH2 and CH3. The assignment of other Raman lines is shown in Table 1.
The Raman spectra of normal cell from rectal cancer patient are shown in Figure 2A similar to that of the lymphocyte. Figures 2B and 2C show the Raman spectra of cancer cells on rectal smooth muscle and rectal, respectively. The Raman line assigned to phenylalanine is still distinct and its intensity becomes low in cancer cells. There exist the Raman lines of Amide-I, CH2 and CH3 in two cases, these lines become weak and other lines disappear. The cancer cells in different position have distinctly different fluorescence intensity. The Raman spectra of colon cancer cells in Figure 3A are similar to that of rectal cancer cells in Figure 2C.
Figure 2.
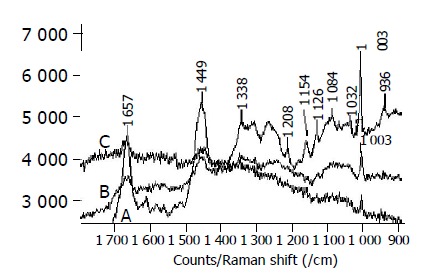
Raman spectra of normal and cancer cell from rectum cancer patients. A: normal cell; B: cancer cell on rectal smooth muscle; C: rectal cancer cell.
Figure 3.
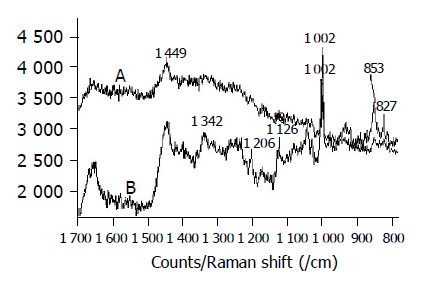
Raman spectra of cancer cell. A: colon cancer cell; B: stomach cancer cell.
The Raman spectra of stomach cancer cells are shown in Figure 3B. Its Raman spectra are similar to the normal cells, but the Raman intensity is much lower than that of normal cells. The peak at 1084 /cm of phosphate backbone of DNA disappears.
DISCUSSION
We studied the Raman spectra of several cells from gastroi-ntestinal cancer patients. There exists the strong line at 1002 /cm with less half-width assigned to the phenylalanine in several cells, whose intensity is not easy to change and can often be a standard of Raman lines of cell. The Raman intensity of white cell is low and lacking, while that of red cell is high and abundant and it has a particular C-N breathing stretching band of pyrrole ring from 1620 to 1540 /cm. The relative intensity of 1084 /cm of phosphate backbone of DNA becomes obviously weak in cancer cells. The Raman spectra of stomach cancer cells are similar to the normal cells, but the Raman intensity is much lower than that of normal cells. The lines of enteric cancer cells become weaker than that of stomach cancer and many lines disappear and the cancer cells in different part have different fluorescence intensity. These conclusions show that the structure changes of cancer cells happen and many bonds rupture so that the biological function of cells are lost. The results indicate that Raman spectra may offer the experiment basis for cancer diagnosis and treatment.
Footnotes
Supported by the National Natural Science Foundation of China, No. 60471049 and the Natural Science Foundation of Shandong Province of China, No. Y2004G09
Language Editor Elsevier HK
References
- 1.Huang Z, McWilliams A, Lui H, McLean DI, Lam S, Zeng H. Near-infrared Raman spectroscopy for optical diagnosis of lung cancer. Int J Cancer. 2003;107:1047–1052. doi: 10.1002/ijc.11500. [DOI] [PubMed] [Google Scholar]
- 2.Sun CW, Xu YZ, Sun KH, Wu QG, Li WH, Xu ZH, Wu JG. A study of the diagnosis of salivary gland tumors by means of mid infrared optical fiber technique. Spectroscopy Spectral Analysis. 1996;16:22–25. [Google Scholar]
- 3.Ling X, Li W, Song Y, Yang Z, Xu Y, Weng S, Xu Z, Fu X, Zhou X, Wu J. FT-Raman spectroscopic investigation on stomach cancer. GuangPuXue Yu GuangPu FenXi. 2000;20:692–693. [PubMed] [Google Scholar]
- 4.Crow P, Uff JS, Farmer JA, Wright MP, Stone N. The use of Raman spectroscopy to identify and characterize transitional cell carcinoma in vitro. BJU Int. 2004;93:1232–1236. doi: 10.1111/j.1464-410X.2004.04852.x. [DOI] [PubMed] [Google Scholar]
- 5.Notingher I, Verrier S, Haque S, Polak JM, Hench LL. Spectroscopic study of human lung epithelial cells (A549) in culture: living cells versus dead cells. Biopolymers. 2003;72:230–240. doi: 10.1002/bip.10378. [DOI] [PubMed] [Google Scholar]
- 6.Gao XL, Butler IS, Richard KR. A Novel Model of Assessment of Medical effect and Mechanisms of Anticancer Drugs Raman Spectroscopy. Acta Laser Biol Sinica. 1998;7:22–26. [Google Scholar]
- 7.Xu Y, Zhang Z, Zhang W. Raman spectroscopic characteristics of microcosmic and photosensitive damage on space structure of liposomes sensitized by hypocrellin and its derivatives. Sci China C Life Sci. 1998;41:459–464. doi: 10.1007/BF02882882. [DOI] [PubMed] [Google Scholar]
- 8.Li G, Yang H, Xu Y, Zhang Z. Raman microspectroscopic study of biomolecular structure inside living adhesive cells. Sci China C Life Sci. 2002;45:397–405. doi: 10.1360/02yc9044. [DOI] [PubMed] [Google Scholar]
- 9.Dong R, Yan X, Pang X, Liu S. Temperature-dependent Raman spectra of collagen and DNA. Spectrochim Acta A Mol Biomol Spectrosc. 2004;60:557–561. doi: 10.1016/s1386-1425(03)00262-2. [DOI] [PubMed] [Google Scholar]
- 10.Feofanov AV, Grichine AI, Shitova LA, Karmakova TA, Yakubovskaya RI, Egret-Charlier M, Vigny P. Confocal raman microspectroscopy and imaging study of theraphthal in living cancer cells. Biophys J. 2000;78:499–512. doi: 10.1016/S0006-3495(00)76612-4. [DOI] [PMC free article] [PubMed] [Google Scholar]